Knowledgebase (2595)
Children categories
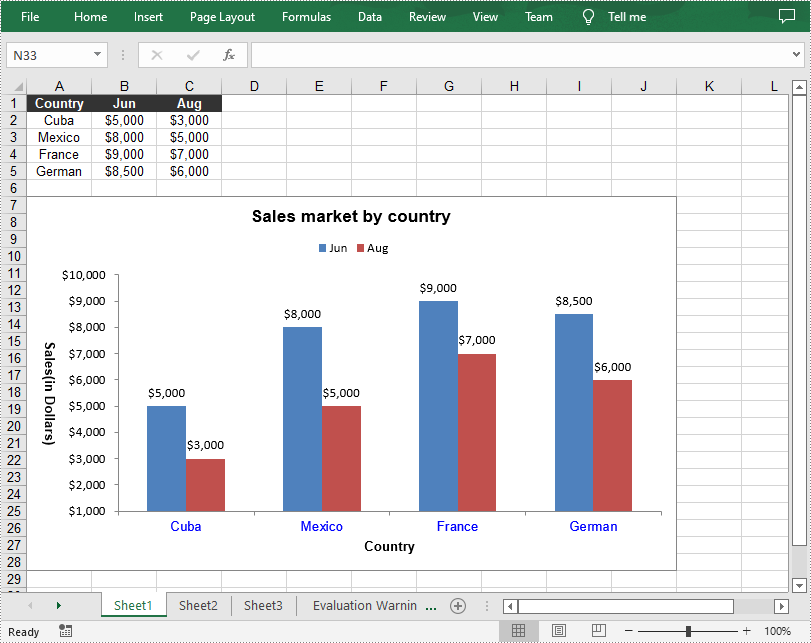
A column chart is a chart that visualizes data as a set of rectangular columns, and the height of the column indicates the value of the data point. Creating column charts in Excel is a great way to compare data and show data change over time. In this article, you will learn how to programmatically create a column chart in Excel using Spire.XLS for .NET.
Install Spire.XLS for .NET
To begin with, you need to add the DLL files included in the Spire.XLS for .NET package as references in your .NET project. The DLL files can be either downloaded from this link or installed via NuGet.
PM> Install-Package Spire.XLS
Create a Column Chart in Excel
The detailed steps are as follows.
- Create a Workbook instance.
- Get the first worksheet using Workbook.Worksheets[sheetIndex] property.
- Add data to specified cells and set the cell styles.
- Add a clustered column chart to the worksheet using Worksheet.Charts.Add(ExcelChartType.ColumnClustered) method.
- Set data range for the chart using Chart.DataRange property.
- Set position, title, category axis and value axis for the chart.
- Loop through the data series of the chart, and show data labels for data points by setting the ChartSerie.DataPoints.DefaultDataPoint.DataLabels.HasValue property as true.
- Set the position of chart legend using Chart.Legend.Position property.
- Save the result file using Workbook.SaveToFile() method.
- C#
- VB.NET
using Spire.Xls;
using Spire.Xls.Charts;
using System.Drawing;

namespace ColumnChart
{
    class Program
    {
        static void Main(string[] args)
        {
            //Create a Workbook instance
            Workbook workbook = new Workbook();

            //Get the first worksheet
            Worksheet sheet = workbook.Worksheets[0];

            //Add data to specified cells
            sheet.Range["A1"].Value = "Country";
            sheet.Range["A2"].Value = "Cuba";
            sheet.Range["A3"].Value = "Mexico";
            sheet.Range["A4"].Value = "France";
            sheet.Range["A5"].Value = "German";

            sheet.Range["B1"].Value = "Jun";
            sheet.Range["B2"].NumberValue = 5000;
            sheet.Range["B3"].NumberValue = 8000;
            sheet.Range["B4"].NumberValue = 9000;
            sheet.Range["B5"].NumberValue = 8500;

            sheet.Range["C1"].Value = "Aug";
            sheet.Range["C2"].NumberValue = 3000;
            sheet.Range["C3"].NumberValue = 5000;
            sheet.Range["C4"].NumberValue = 7000;
            sheet.Range["C5"].NumberValue = 6000;

            //Set cell styles
            sheet.Range["A1:C1"].Style.Font.IsBold = true;
            sheet.Range["A1:C1"].Style.KnownColor = ExcelColors.Black;
            sheet.Range["A1:C1"].Style.Font.Color = Color.White;
            sheet.Range["A1:C5"].Style.HorizontalAlignment = HorizontalAlignType.Center;
            sheet.Range["A1:C5"].Style.VerticalAlignment = VerticalAlignType.Center;

            //Set number format
            sheet.Range["B2:C5"].Style.NumberFormat = "\"$\"#,##0";

            //Add a column chart to the worksheet
            Chart chart = sheet.Charts.Add(ExcelChartType.ColumnClustered);

            //Set data range for the chart
            chart.DataRange = sheet.Range["A1:C5"];
            chart.SeriesDataFromRange = false;

            //Set position of the chart
            chart.LeftColumn = 1;
            chart.TopRow = 7;
            chart.RightColumn = 11;
            chart.BottomRow = 29;

            //Set and format chart title
            chart.ChartTitle = "Sales market by country";
            chart.ChartTitleArea.Size = 13;
            chart.ChartTitleArea.IsBold = true;

            //Set and format category axis
            chart.PrimaryCategoryAxis.Title = "Country";
            chart.PrimaryCategoryAxis.Font.Color = Color.Blue;

            //Set and format value axis
            chart.PrimaryValueAxis.Title = "Sales(in Dollars)";
            chart.PrimaryValueAxis.HasMajorGridLines = false;
            chart.PrimaryValueAxis.MinValue = 1000;
            chart.PrimaryValueAxis.TitleArea.TextRotationAngle = 90;

            //Show data labels for data points
            foreach (ChartSerie cs in chart.Series)
            {
                cs.Format.Options.IsVaryColor = true;
                cs.DataPoints.DefaultDataPoint.DataLabels.HasValue = true;
            }

            //Set position of chart legend
            chart.Legend.Position = LegendPositionType.Top;

            //Save the result file
            workbook.SaveToFile("ExcelColumnChart.xlsx", ExcelVersion.Version2010);
        }
    }
}
Apply for a Temporary License
If you'd like to remove the evaluation message from the generated documents, or to get rid of the function limitations, please request a 30-day trial license for yourself.
Automation of an Excel file allows us to doing various operations in C#/VB.NET. Any loss in these operations may result in unexpected negative consequences for developers and the clients of the developers. That means we must find a solution that enables us to Save Excel with no loss in quality of our operations. This section will demonstrate how to fast save Excel file with perfect performance as directly operations in Excel files.
Spire.Xls for .NET is a professional component that enables developers directly manages Excel operation regardless whether Microsoft Excel is installed on or not. With Spire.Xls for .NET, we can save Excel to what we want it to be. Any kind of trial and evaluation on Spire.Xls for .NET is always welcomed; so now please feel free to download Spire.Xls for .NET and then follow our guide to save perfect Excel or try other function of Spire.Xls for .NET.
Spire.Xls for .NET allows us to create a new Excel file, write data in to it, edit the input data and then save Excel file.
using Spire.Xls;
namespace Excel_save
{
   class Program
    {
        static void Main(string[] args)
        {
           //Create a new workbook
            Workbook workbook = new Workbook();
           //Initialize worksheet
            Worksheet sheet = workbook.Worksheets[0];
           //Append text
            sheet.Range["A1"].Text = "Demo: Save Excel in .NET";
           //Save it as Excel file
            workbook.SaveToFile("Sample.xls",ExcelVersion.Version97to2003);
           //Launch the file
           System.Diagnostics.Process.Start(workbook.FileName);
        }
    }
}
Imports Spire.Xls
Namespace Excel_save
	Class Program
		Private Shared Sub Main(args As String())
			'Create a new workbook
			Dim workbook As New Workbook()
			'Initialize worksheet
			Dim sheet As Worksheet = workbook.Worksheets(0)
			'Append text
			sheet.Range("A1").Text = "Demo: Save Excel in .NET"
			'Save it as Excel file
			workbook.SaveToFile("Sample.xls",ExcelVersion.Version97to2003)
			'Launch the file
			System.Diagnostics.Process.Start(workbook.FileName)
		End Sub
	End Class
End Namespace
