
Knowledgebase (2370)
Children categories
Spire.XLS for Python is a high-performance library for reading and writing Excel spreadsheets in Python. With Spire.XLS, you can create, read, edit, and convert XLS and XLSX files without the need for Microsoft Excel to be installed on your system.
This article demonstrates how to install Spire.XLS for Python on Mac.
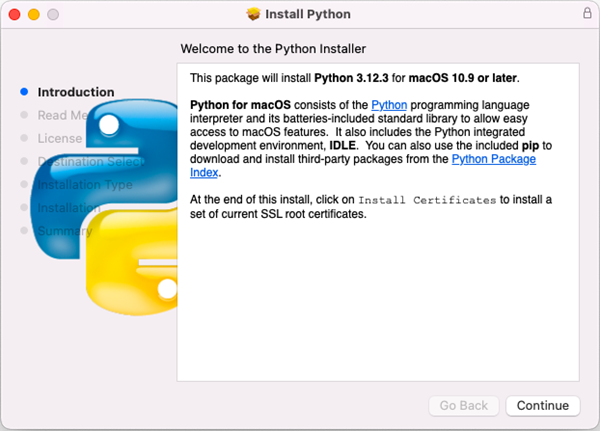
Step 1
Download the most recent version of Python for macOS and install it on your Mac. If you have already completed this step, proceed directly to step 2.
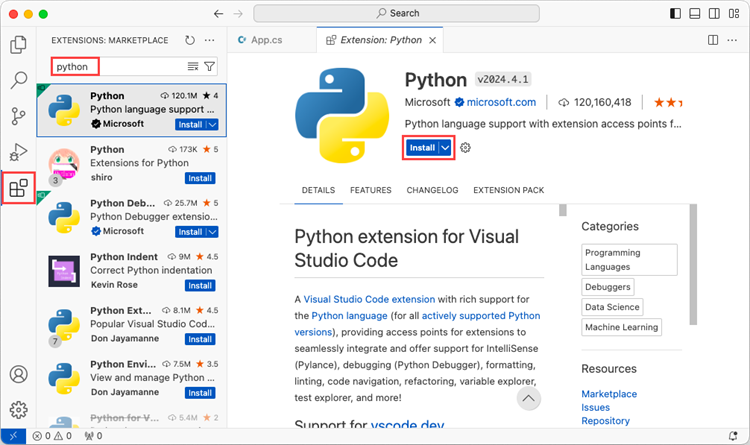
Step 2
Open VS Code and search for 'Python' in the Extensions panel. Click 'Install' to add support for Python in your VS Code.
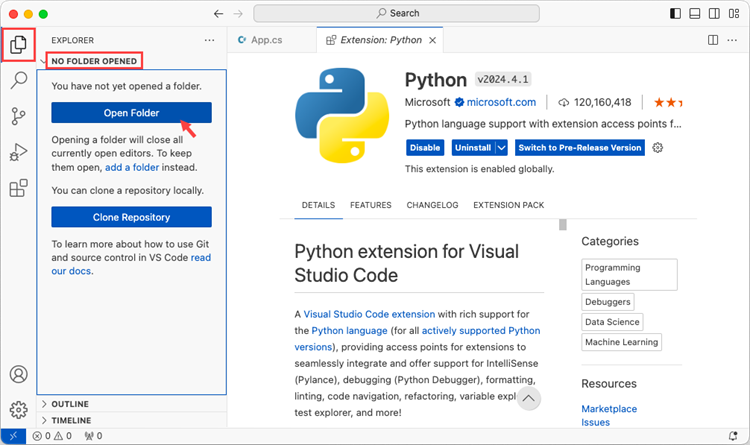
Step 3
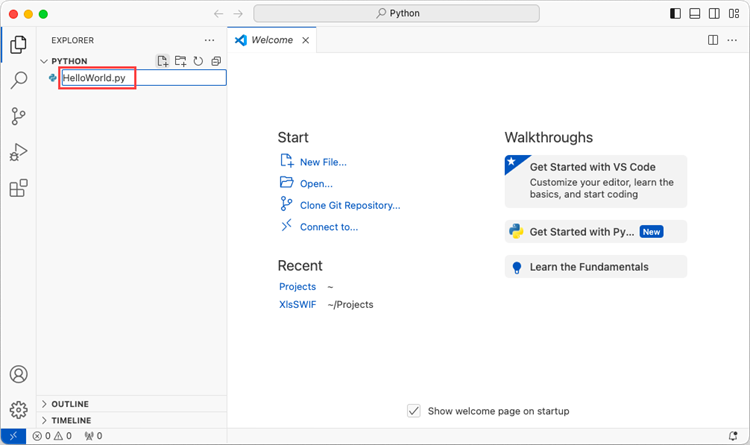
Click 'Explorer' > 'NO FOLRDER OPENED' > 'Open Folder'.
Choose an existing folder as the workspace, or you can create a new folder and then open it.
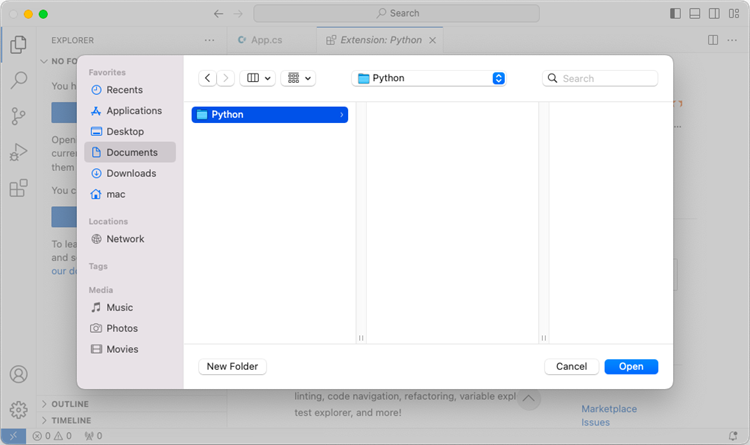
Add a .py file to the folder you just opened and name it whatever you want (in this case, HelloWorld.py).
Step 4
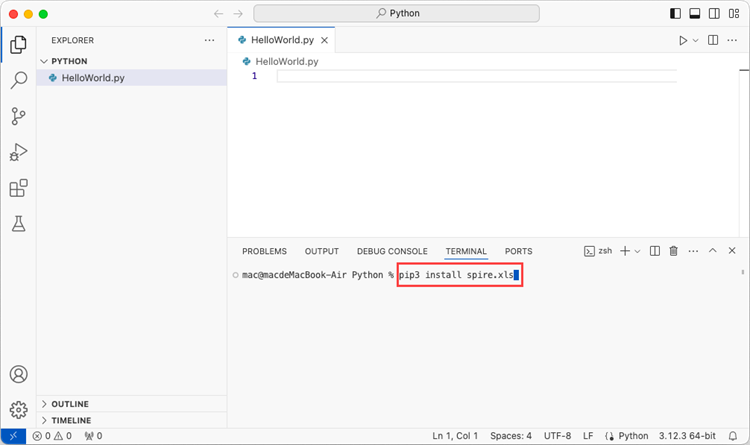
Use the keyboard shortcut Ctrl + ` to open the Terminal. Then, install Spire.XLS for Python by entering the following command line in the terminal.
pip3 install spire.xls
Note that pip3 is a package installer specifically designed for Python 3.x versions, while pip is a package installer for Python 2.x versions. If you are working with Python 2.x, you can use the pip command.
Step 5
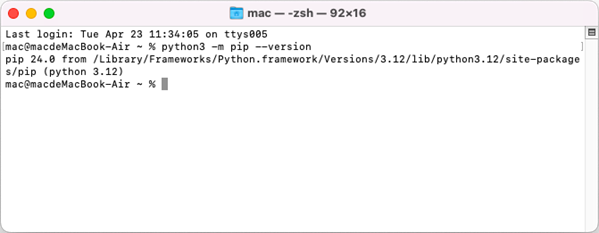
Open a Terminal window on your Mac, and type the following command to obtain the installation path of Python on your system.
python3 -m pip --version
Step 6
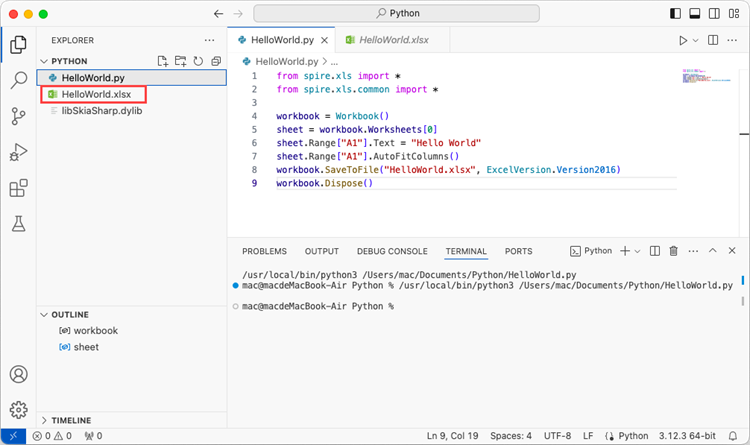
Add the following code snippet to the 'HelloWorld.py' file.
- Python
from spire.xls.common import *
from spire.xls import *

workbook = Workbook()
sheet = workbook.Worksheets[0]
sheet.Range["A1"].Text = "Hello World"
sheet.Range["A1"].AutoFitColumns()
workbook.SaveToFile("HelloWorld.xlsx", ExcelVersion.Version2010)
workbook.Dispose()
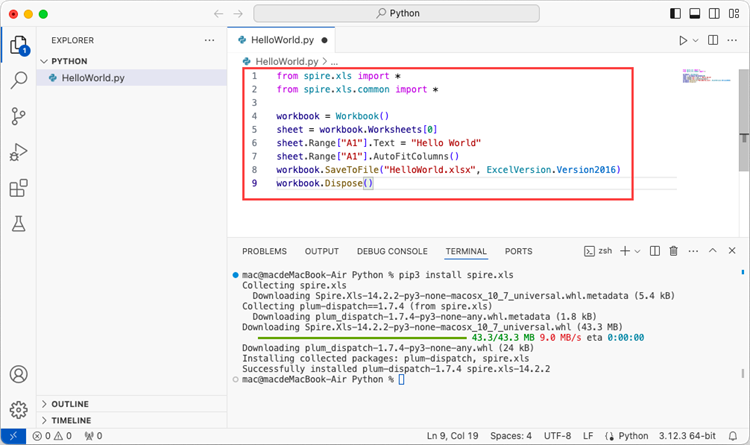
After executing the Python file, you will find the resulting Excel document displayed in the 'EXPLORER' panel.
Mail merge is a powerful tool that allows users to efficiently create personalized documents for a large number of recipients. By using mail merge, users can streamline the document-creating process by automatically merging a template document with a data source, resulting in personalized and professional-looking documents that are tailored to each recipient, which is especially useful for tasks like sending out personalized emails, generating invoices, or creating customized marketing materials. This article demonstrates how to create and execute mail merge in Word documents with Spire.Doc for Python through Python code.
Install Spire.Doc for Python
This scenario requires Spire.Doc for Python and plum-dispatch v1.7.4. They can be easily installed in your Windows through the following pip command.
pip install Spire.Doc
If you are unsure how to install, please refer to: How to Install Spire.Doc for Python on Windows
Create Mail Merge in Word Documents with Python
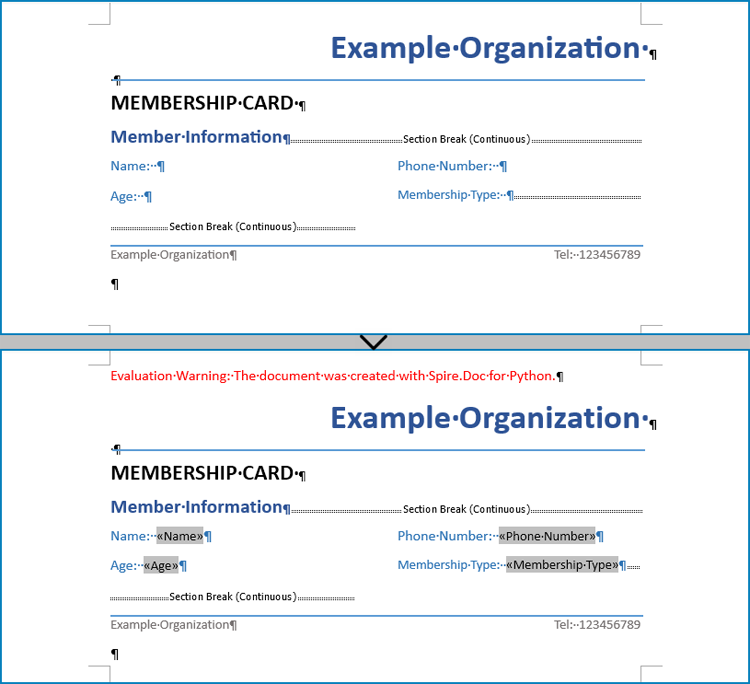
Mail merging in Word documents involves the utilization of mail merge fields. Spire.Doc for Python offers the Paragraph.AppendField(str: fieldName, FieldType.FieldMergeField) method, which allows users to efficiently create mail merge fields within a designated paragraph of a document. This feature enables users to easily generate a set of documents tailored to specific recipients by swiftly inputting personalized information at a later stage.
The detailed steps for creating mail merge fields in Word documents are as follows:
- Create an object of Document class and load a Word document using Document.LoadFromFile() method.
- Get a section using Document.Sections.get_Item() method.
- Get the paragraphs to insert mail merge fields using Section.Paragraphs.get_Item() method.
- Append mail merge fields to the paragraphs using Paragraph.AppendField() method.
- Save the document using Document.SaveToFile() method.
- Python
from spire.doc import *
from spire.doc.common import *

# Create an object of Document class
doc = Document()

# Load a Word document
doc.LoadFromFile("Sample.docx")

# Get a section
section = doc.Sections.get_Item(1)

# Get the paragraphs to append the mail merge fields
para1 = section.Paragraphs.get_Item(0)
para2 = section.Paragraphs.get_Item(1)
para3 = section.Paragraphs.get_Item(2)
para4 = section.Paragraphs.get_Item(3)

# Append the mail merge fields and specify the field names
para1.AppendField("Name", FieldType.FieldMergeField)
para2.AppendField("Age", FieldType.FieldMergeField)
para3.AppendField("Phone Number", FieldType.FieldMergeField)
para4.AppendField("Membership Type", FieldType.FieldMergeField)

# Save the document
doc.SaveToFile("output/MailMergeFields.docx", FileFormat.Docx)
doc.Close()
Perform Mail Merge in Word Documents with Python
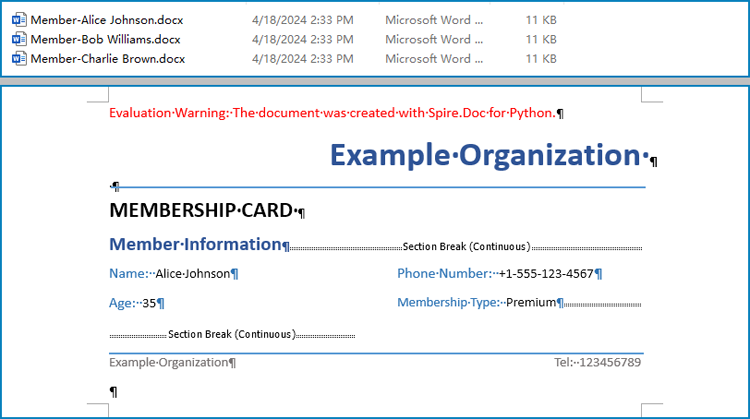
Once the mail merge has been created, the MailMerge.Execute(List: fieldNames, List: dataSource) method can be employed to execute the mail merge within the document. This enables the swift generation of multiple Word documents, each containing unique content as per the specified data source.
The detailed steps for performing mail merge and generate personalized documents are as follows:
- Specify the data source
- Loop through the data source:
- Create an object of Document class and load a Word document using Document.LoadFromFile() method.
- Get the mail merge field names as a list using Document.MailMerge.GetMergeFieldNames() method.
- Execute mail merge with specified data using Document.MailMerge.Execute() method.
- Save the document using Document.SaveToFile() method.
- Python
from spire.doc import Document

# Specify the data source
dataSource = member_data = [
    ["Alice Johnson", "35", "+1-555-123-4567", "Premium"],
    ["Bob Williams", "42", "+1-555-765-4321", "Standard"],
    ["Charlie Brown", "28", "+44-1234-567890", "Basic"],
]

# Loop through the data source
for i in range(len(dataSource)):
    # Create an instance of Document
    doc = Document()
    # Load a Word document with mail merge fields
    doc.LoadFromFile("output/MailMergeFields.docx")
    # Get the merge field names
    fieldNames = doc.MailMerge.GetMergeFieldNames()
    # Execute mail merge
    doc.MailMerge.Execute(fieldNames, dataSource[i])
    # Save the document
    doc.SaveToFile(f"output/Members/Member-{dataSource[i][0]}.docx")
doc.Close()
Apply for a Temporary License
If you'd like to remove the evaluation message from the generated documents, or to get rid of the function limitations, please request a 30-day trial license for yourself.
Paragraph indentations determine the horizontal space between the page margins and the text of paragraphs. They are an important formatting tool used in various types of written documents, such as essays, reports, and articles, to improve readability and create a visual distinction between paragraphs. In this article, we will demonstrate how to set paragraph indentations in Word documents in Python using Spire.Doc for Python.
Install Spire.Doc for Python
This scenario requires Spire.Doc for Python and plum-dispatch v1.7.4. They can be easily installed in your Windows through the following pip command.
pip install Spire.Doc
If you are unsure how to install, please refer to this tutorial: How to Install Spire.Doc for Python on Windows
Set Paragraph Indentations in Word in Python
Microsoft Word provides four types of paragraph indent options that enable you to format your document efficiently. These options are as follows:
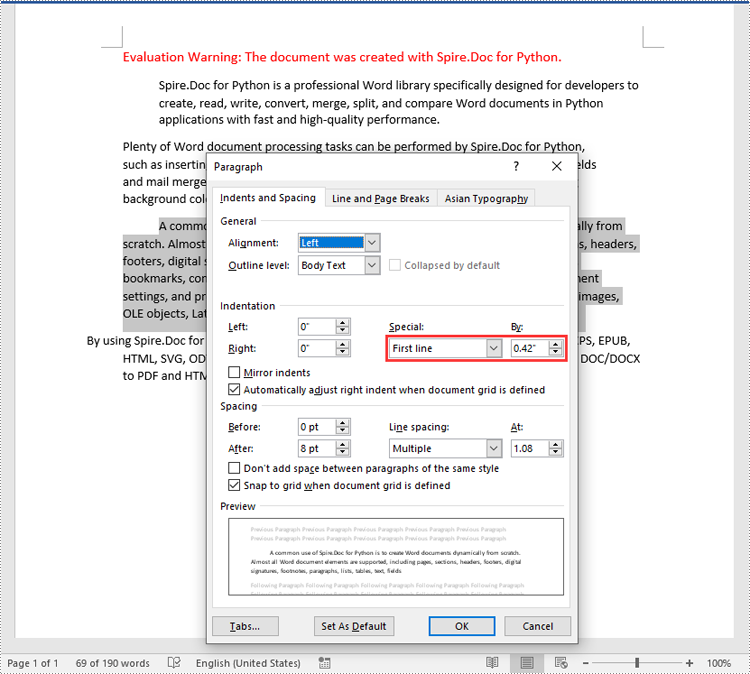
- First Line Indent: The first line indent refers to the horizontal space between the left margin and the beginning of the first line of a paragraph. It indents only the first line while keeping the subsequent lines aligned with the left margin.
- Left Indent: The left indent, also known as the paragraph indent or the left margin indent, determines the horizontal distance between the left margin and the entire paragraph. It uniformly indents the entire paragraph from the left margin.
- Right Indent: The right indent sets the horizontal distance between the right margin and the entire paragraph. It indents the paragraph from the right side, shifting the text towards the left.
- Hanging Indent: The hanging indent is a unique indentation style where the first line remains aligned with the left margin, while all subsequent lines of the paragraph are indented inward. This creates a "hanging" effect, commonly used for bibliographies, references, or citations.
Spire.Doc for Python supports all these types of indents. The table below lists some of the core classes and methods that are used to set different paragraph indents in Word with Spire.Doc for Python:
| Name | Description |
| ParagraphFormat Class | Represents the format of a paragraph. |
| ParagraphFormat.SetLeftIndent() Method | Sets the left indent value for paragraph. |
| ParagraphFormat.SetRightIndent() Method | Sets the right indent value for paragraph. |
| ParagraphFormat.SetFirstLineIndent() Method | Sets the first line or hanging indent value. Positive value represents first-line indent, and negative value represents hanging indent. |
The steps below explain how to set paragraph indents in a Word document using Spire.Doc for Python:
- Create a Document instance.
- Load a sample Word document using Document.LoadFromFile() method.
- Get a specific section using Document.Sections[] property.
- Get a specific paragraph using Section.Paragraphs[] property.
- Get the paragraph format using Paragraph.Format property, and then set the paragraph indent using the above listed methods of ParagraphFormat class.
- Save the document to another file using Document.SaveToFile() method.
- Python
from spire.doc import *
from spire.doc.common import *

# Create a Document instance
doc = Document()
# Load a sample Word document
doc.LoadFromFile(""Sample6.docx"")

# Get the first section
section = doc.Sections.get_Item(0)

# Get the first paragraph and set the left indent
para1 = section.Paragraphs.get_Item(0)
para1.Format.SetLeftIndent(30)

# Get the second paragraph and set the right indent
para2 = section.Paragraphs.get_Item(1)
para2.Format.SetRightIndent(30)

# Get the third paragraph and set the first line indent
para3 = section.Paragraphs.get_Item(2)
para3.Format.SetFirstLineIndent(30)

# Get the fourth paragraph and set the hanging indent
para4 = section.Paragraphs.get_Item(3)
para4.Format.SetFirstLineIndent(-30)

# Save the document to file
doc.SaveToFile(""SetIndents.docx"", FileFormat.Docx2013)
doc.Close()
Apply for a Temporary License
If you'd like to remove the evaluation message from the generated documents, or to get rid of the function limitations, please request a 30-day trial license for yourself.
