
.NET (1327)
Children categories
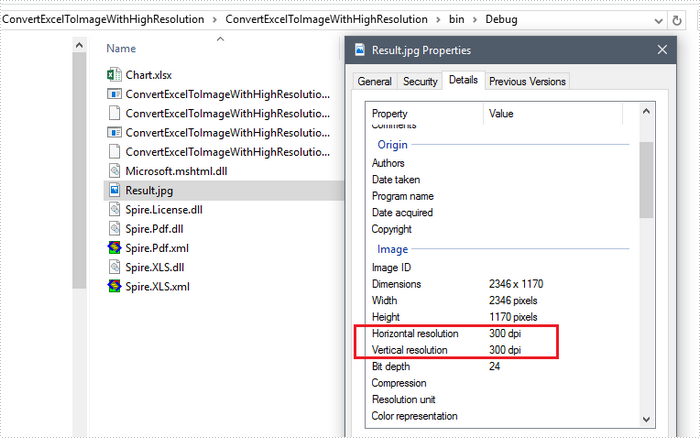
Sometimes, you may want to convert Excel sheet to a high-resolution image, especially when the Excel report contains graphs or pictures. This article will show you how to set image resolution when saving Excel sheet to JPG using Spire.XLS.
Step 1: Create a custom function that you can use to reset the image resolution.
private static Bitmap ResetResolution(Metafile mf, float resolution)
{
    int width = (int)(mf.Width * resolution / mf.HorizontalResolution);
    int height = (int)(mf.Height * resolution / mf.VerticalResolution);
    Bitmap bmp = new Bitmap(width, height);
    bmp.SetResolution(resolution, resolution);
    Graphics g = Graphics.FromImage(bmp);
    g.DrawImage(mf, 0, 0);
    g.Dispose();
    return bmp;
}
Step 2: Create a workbook instance and load the sample Excel file.
Workbook workbook = new Workbook();
workbook.LoadFromFile("Chart.xlsx",ExcelVersion.Version2013);
Step 3: Get the worksheet you want to convert.
Worksheet worksheet = workbook.Worksheets[0];
Step 4: Convert the worksheet to EMF stream.
MemoryStream ms = new MemoryStream();
worksheet.ToEMFStream(ms, 1, 1, worksheet.LastRow, worksheet.LastColumn);
Step 5: Create an image from the EMF stream, and call ResetResolution to reset the resolution for the image.
Image image = Image.FromStream(ms);
Bitmap images = ResetResolution(image as Metafile, 300);
Step 6: Save the image in JPG file format.
images.Save("Result.jpg", ImageFormat.Jpeg);
Output:
Full Code:
using Spire.Xls;
using System.Drawing;
using System.Drawing.Imaging;
using System.IO;
namespace Convert
{
    class Program
    {
        static void Main(string[] args)
        {
            Workbook workbook = new Workbook();
            workbook.LoadFromFile("Chart.xlsx", ExcelVersion.Version2013);
            Worksheet worksheet = workbook.Worksheets[0];

            using (MemoryStream ms = new MemoryStream())
            {

                worksheet.ToEMFStream(ms, 1, 1, worksheet.LastRow, worksheet.LastColumn);
                Image image = Image.FromStream(ms);
                Bitmap images = ResetResolution(image as Metafile, 300);
                images.Save("Result.jpg", ImageFormat.Jpeg);
            }
        }
        private static Bitmap ResetResolution(Metafile mf, float resolution)
        {
            int width = (int)(mf.Width * resolution / mf.HorizontalResolution);
            int height = (int)(mf.Height * resolution / mf.VerticalResolution);
            Bitmap bmp = new Bitmap(width, height);
            bmp.SetResolution(resolution, resolution);
            Graphics g = Graphics.FromImage(bmp);
            g.DrawImage(mf, 0, 0);
            g.Dispose();
            return bmp;
        }
    }
}
Imports Spire.Xls
Imports System.Drawing
Imports System.Drawing.Imaging
Imports System.IO
Namespace Convert
	Class Program
		Private Shared Sub Main(args As String())
			Dim workbook As New Workbook()
			workbook.LoadFromFile("Chart.xlsx", ExcelVersion.Version2013)
			Dim worksheet As Worksheet = workbook.Worksheets(0)

			Using ms As New MemoryStream()

				worksheet.ToEMFStream(ms, 1, 1, worksheet.LastRow, worksheet.LastColumn)
				Dim image__1 As Image = Image.FromStream(ms)
				Dim images As Bitmap = ResetResolution(TryCast(image__1, Metafile), 300)
				images.Save("Result.jpg", ImageFormat.Jpeg)
			End Using
		End Sub
		Private Shared Function ResetResolution(mf As Metafile, resolution As Single) As Bitmap
			Dim width As Integer = CInt(mf.Width * resolution / mf.HorizontalResolution)
			Dim height As Integer = CInt(mf.Height * resolution / mf.VerticalResolution)
			Dim bmp As New Bitmap(width, height)
			bmp.SetResolution(resolution, resolution)
			Dim g As Graphics = Graphics.FromImage(bmp)
			g.DrawImage(mf, 0, 0)
			g.Dispose()
			Return bmp
		End Function
	End Class
End Namespace
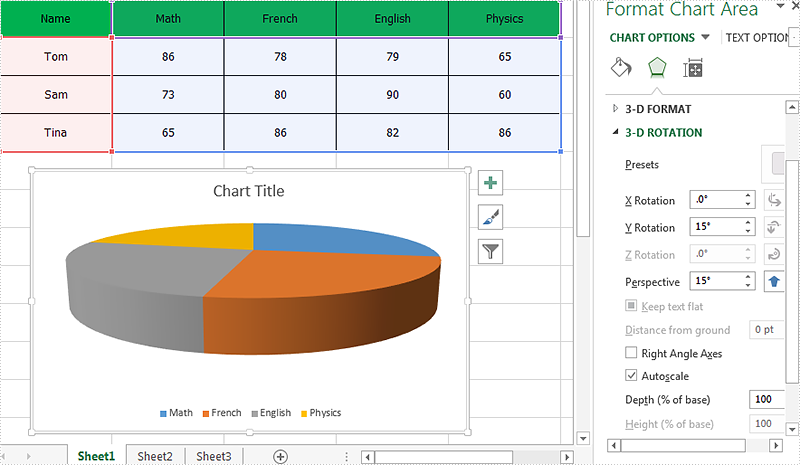
With Spire.XLS, we can set the 3-D rotation easily in C#. The following code example explains how to set the rotation of the 3D chart view in C#. We will use 3D pie chart for example. Firstly, view the original 3D pie chart:
Code snippet of how to set the 3D rotation for Excel Chart:
Step 1: Create a new instance of workbook and load the sample document from file.
Workbook workbook = new Workbook();
workbook.LoadFromFile("Sample.xlsx");
Step 2: Get the chart from the first worksheet.
Worksheet sheet = workbook.Worksheets[0];
Chart chart = sheet.Charts[0];
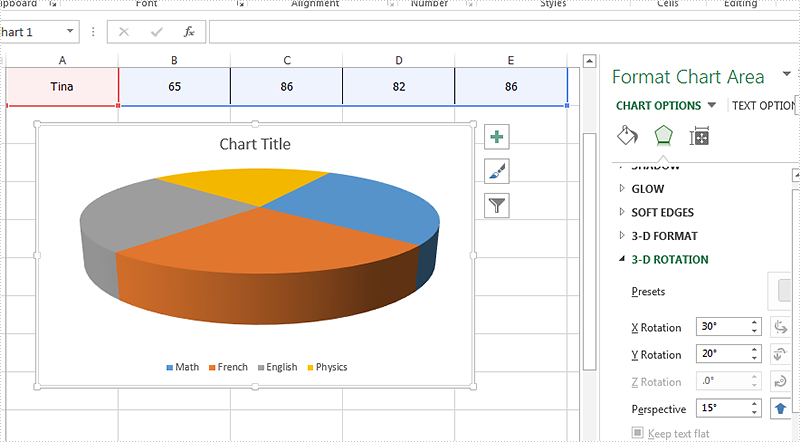
Step 3: Set Rotation of the 3D chart view for X and Y.
//X rotation:
chart.Rotation=30;
//Y rotation:
chart.Elevation = 20;
Step 4: Save the document to file.
workbook.SaveToFile("Result.xlsx", ExcelVersion.Version2010);
Effective screenshot of the Excel 3D chart rotation:
Full codes:
using Spire.Xls;
namespace SetRotation
{

    class Program
    {

        static void Main(string[] args)
        {
            Workbook workbook = new Workbook();
            workbook.LoadFromFile("Sample.xlsx");

            Worksheet sheet = workbook.Worksheets[0];
            Chart chart = sheet.Charts[0];

            //X rotation:
            chart.Rotation = 30;
            //Y rotation:
            chart.Elevation = 20;

            workbook.SaveToFile("Result.xlsx", ExcelVersion.Version2010);
        }
    }
}
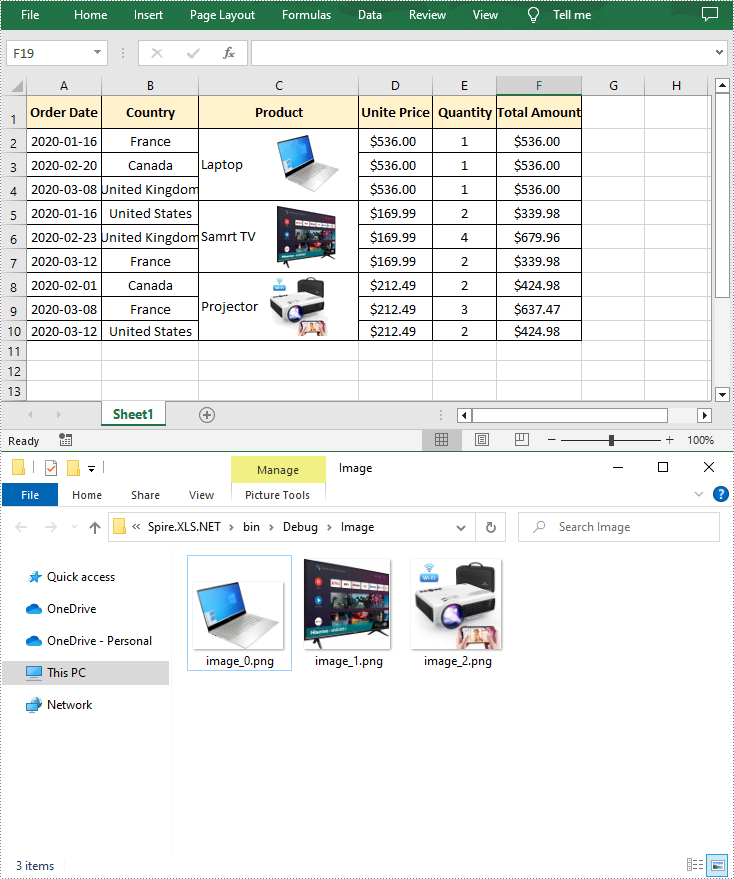
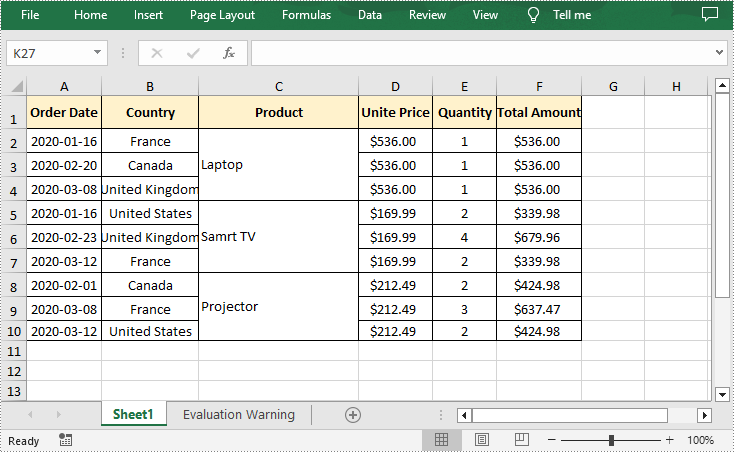
Although Excel files typically store numbers and data, they can also contain images associated with the file. After inserting images into Excel, it may sometimes be necessary to extract the images for use elsewhere, or to remove them to improve simplicity. In this article, you will learn how to programmatically extract or remove images from an Excel document using Spire.XLS for .NET.
Install Spire.XLS for .NET
To begin with, you need to add the DLL files included in the Spire.XLS for .NET package as references in your .NET project. The DLL files can be either downloaded from this link or installed via NuGet.
PM> Install-Package Spire.XLS
Extract Images from Excel in C# and VB.NET
Spire.XLS for .NET allows you to extract all images in an Excel worksheet at once. The following are the detailed steps.
- Create a Workbook instance.
- Load a sample Excel file using Workbook.LoadFromFile() method.
- Get a specific worksheet using Workbook.Worksheets[] property.
- Loop through to get all pictures in the worksheet using Worksheet.Pictures property.
- Extract pictures and save them to a specified file path using ExcelPicture.Picture.Save() method.
- C#
- VB.NET
using Spire.Xls;

namespace ExtractImages
{
    class Program
    {
        static void Main(string[] args)
        {
            //Create a Workbook instance
            Workbook workbook = new Workbook();

            //Load a sample Excel document
            workbook.LoadFromFile("input.xlsx");

            //Get the first worksheet
            Worksheet sheet = workbook.Worksheets[0];

            //Get all images in the worksheet
            for (int i = sheet.Pictures.Count - 1; i >= 0; i--)
            {
                ExcelPicture picture = sheet.Pictures[i];

                //Extract the images
                picture.Picture.Save(string.Format(@"Image\image_{0}.png", i));
            }
        }
    }
}
Delete Images from Excel in C# and VB.NET
To delete pictures from an Excel worksheet, you can use the Worksheet.Pictures.Remove() method. The following are the detailed steps.
- Create a Workbook instance.
- Load a sample Excel file using Workbook.LoadFromFile() method.
- Get a specific worksheet using Workbook.Worksheets[] property.
- Loop through all pictures in the worksheet and remove them using Worksheet.Pictures.Remove() method.
- Save the result document using Workbook.SaveToFile() method.
- C#
- VB.NET
using Spire.Xls;

namespace DeleteImages
{
    class Program
    {
        static void Main(string[] args)
        {
            //Create a Workbook instance
            Workbook workbook = new Workbook();

            //Load a sample Excel document
            workbook.LoadFromFile("input0.xlsx");

            //Get the first worksheet
            Worksheet sheet = workbook.Worksheets[0];

            //Delete all pictures from the worksheet
            for (int i = sheet.Pictures.Count - 1; i >= 0; i--)
            {
                sheet.Pictures[i].Remove();
            }

            //Save the result document
            workbook.SaveToFile("DeleteImages.xlsx", ExcelVersion.Version2016);
        }
    }
}
Apply for a Temporary License
If you'd like to remove the evaluation message from the generated documents, or to get rid of the function limitations, please request a 30-day trial license for yourself.
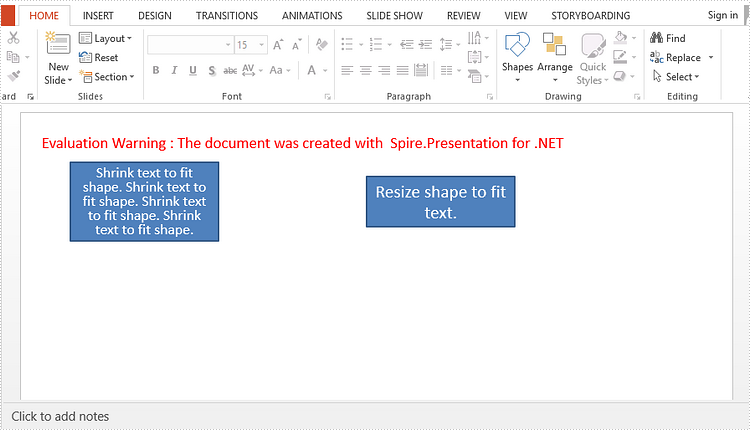
With auto-fit feature, you can automatically reduce the font size of text to fit a shape, or you can shrink or enlarge shape to fit the exact size of your text. This article will show you how to auto-fit text or shape using Spire.Presentation with C#, VB.NET.
Step 1: Create an instance of Presentation class.
Presentation presentation = new Presentation();
Step 2: Insert a shape, and set the AutofitType property to Normal, which means the text automatically shrinks to fit shape.
IAutoShape textShape1 = presentation.Slides[0].Shapes.AppendShape(ShapeType.Rectangle, new RectangleF(50, 50, 150, 80));
textShape1.TextFrame.Text = "Shrink text to fit shape. Shrink text to fit shape. Shrink text to fit shape. Shrink text to fit shape.";
textShape1.TextFrame.AutofitType = TextAutofitType.Normal;
Step 3: Insert a shape, and set the AutofitType property to Shape, which means the shape size automatically decreases or increases to fit text.
IAutoShape textShape2 = presentation.Slides[0].Shapes.AppendShape(ShapeType.Rectangle, new RectangleF(350, 50, 150, 80));
textShape2.TextFrame.Text = "Resize shape to fit text.";
textShape2.TextFrame.AutofitType = TextAutofitType.Shape;
Step 4: Save the file.
presentation.SaveToFile("output.pptx", FileFormat.Pptx2013);
Output:
Full Code:
using Spire.Presentation;
using System.Drawing;
namespace AutofitinPPT
{
    class Program
    {
        static void Main(string[] args)
        {

            Presentation presentation = new Presentation();

            IAutoShape textShape1 = presentation.Slides[0].Shapes.AppendShape(ShapeType.Rectangle, new RectangleF(50, 50, 150, 80));
            textShape1.TextFrame.Text = "Shrink text to fit shape. Shrink text to fit shape. Shrink text to fit shape. Shrink text to fit shape.";
            textShape1.TextFrame.AutofitType = TextAutofitType.Normal;

            IAutoShape textShape2 = presentation.Slides[0].Shapes.AppendShape(ShapeType.Rectangle, new RectangleF(350, 50, 150, 80));
            textShape2.TextFrame.Text = "Resize shape to fit text.";
            textShape2.TextFrame.AutofitType = TextAutofitType.Shape;

            presentation.SaveToFile("output.pptx", FileFormat.Pptx2013);
        }
    }
}
Imports Spire.Presentation
Imports System.Drawing
Namespace AutofitinPPT
	Class Program
		Private Shared Sub Main(args As String())

			Dim presentation As New Presentation()

			Dim textShape1 As IAutoShape = presentation.Slides(0).Shapes.AppendShape(ShapeType.Rectangle, New RectangleF(50, 50, 150, 80))
			textShape1.TextFrame.Text = "Shrink text to fit shape. Shrink text to fit shape. Shrink text to fit shape. Shrink text to fit shape."
			textShape1.TextFrame.AutofitType = TextAutofitType.Normal

			Dim textShape2 As IAutoShape = presentation.Slides(0).Shapes.AppendShape(ShapeType.Rectangle, New RectangleF(350, 50, 150, 80))
			textShape2.TextFrame.Text = "Resize shape to fit text."
			textShape2.TextFrame.AutofitType = TextAutofitType.Shape

			presentation.SaveToFile("output.pptx", FileFormat.Pptx2013)
		End Sub
	End Class
End Namespace
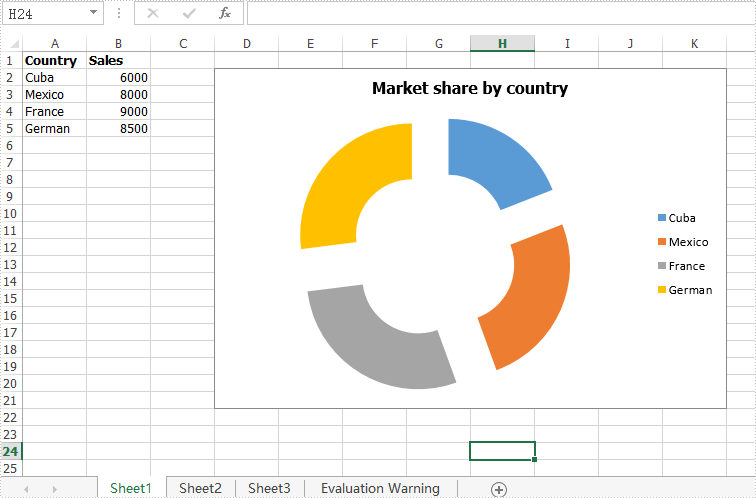
In the previous article, we have demonstrated how to explode a pie chart via Spire.XLS. This article we will explain how to explode a doughnut chart in C#.
When we need to explode a doughnut chart, we can set the chart type as DoughnutExploded when we create a doughnut chart from scratch. For the existing doughnut chart, we can easily change the chart type to explode the doughnut chart.
Step 1: Create an instance of Excel workbook and load the document from file.
Workbook workbook = new Workbook();
workbook.LoadFromFile("DoughnutChart.xlsx",ExcelVersion.Version2010);
Step 2: Get the first worksheet from the sample workbook.
Worksheet sheet = workbook.Worksheets[0];
Step 3: Get the first chart from the first worksheet.
Chart chart = sheet.Charts[0];
Step 4: Set the chart type as DoughnutExploded to explode the doughnut chart.
chart.ChartType = ExcelChartType.DoughnutExploded;
Step 5: Save the document to file.
workbook.SaveToFile("ExplodedDoughnutChart.xlsx", ExcelVersion.Version2010);
Effective screenshot of the explode doughnut chart:
Full codes of how to explode a doughnut chart:
using Spire.Xls;
namespace ExplodeDoughnut
{

    class Program
    {

        static void Main(string[] args)
        {
            Workbook workbook = new Workbook();
            workbook.LoadFromFile("DoughnutChart.xlsx", ExcelVersion.Version2010);

            Worksheet sheet = workbook.Worksheets[0];
            Chart chart = sheet.Charts[0];
            chart.ChartType = ExcelChartType.DoughnutExploded;

            workbook.SaveToFile("ExplodedDoughnutChart.xlsx", ExcelVersion.Version2010);
        }

    }
}
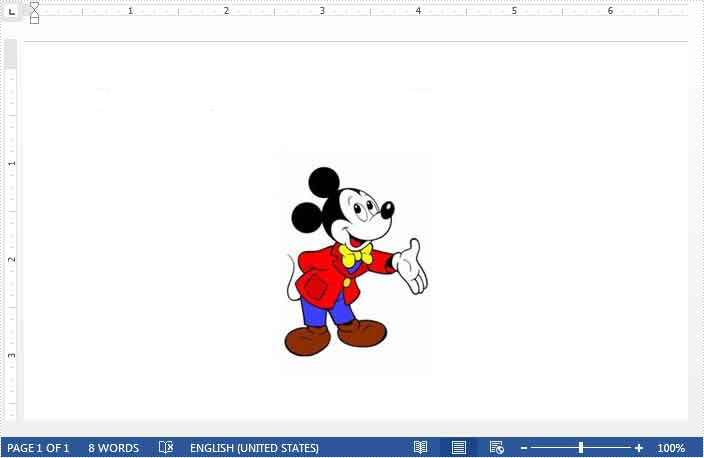
We often need to resize images to a desired size after we insert them into a Word document. This article demonstrates how to programmatically resize images in a Word document using Spire.Doc and C#.
Below is the screenshot of the example document we used for demonstration:
Detail steps:
Step 1: Load the Word document.
Document document = new Document("Input.docx");
Step 2: Get the first section and the first paragraph in the section.
Section section = document.Sections[0];
Paragraph paragraph = section.Paragraphs[0];
Step 3: Resize images in the paragraph.
foreach (DocumentObject docObj in paragraph.ChildObjects)
{
    if (docObj is DocPicture)
    {
        DocPicture picture = docObj as DocPicture;
        picture.Width = 50f;
        picture.Height = 50f;
    }
}
Step 4: Save the document.
document.SaveToFile("ResizeImages.docx");
Output:

Full code:
using Spire.Doc;
using Spire.Doc.Documents;
using Spire.Doc.Fields;
namespace Resize
{
    class Program
    {
        static void Main(string[] args)
        {
            Document document = new Document("Input.docx");
            Section section = document.Sections[0];
            Paragraph paragraph = section.Paragraphs[0];

            foreach (DocumentObject docObj in paragraph.ChildObjects)
            {
                if (docObj is DocPicture)
                {
                    DocPicture picture = docObj as DocPicture;
                    picture.Width = 50f;
                    picture.Height = 50f;
                }
            }
            document.SaveToFile("ResizeImages.docx");
        }
    }
}
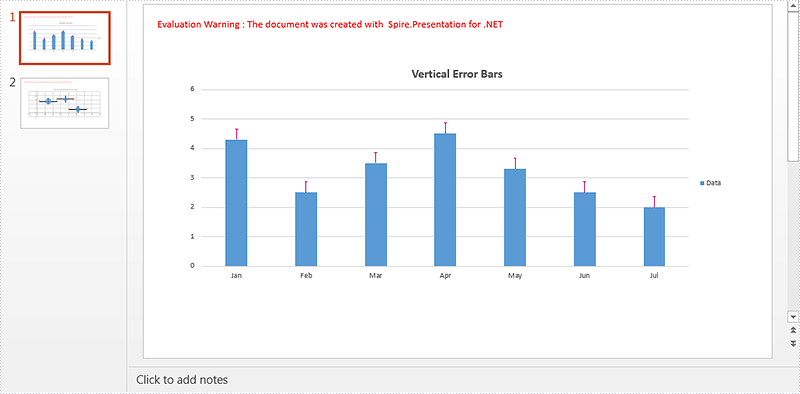
Error bars in charts can help us to see margins of error and standard deviations at a glance. We can use error bars in area, bar, column, line, and XY charts. In XY charts i.e. scatter and bubble charts, we can show X (Horizontal) and Y (Vertical) error bars. However if the chart type is not XY, the error bars for X values are disabled.
This article demonstrates how to add and format error bars for non-XY and XY charts in a PowerPoint document using Spire.Presentation and C#.
Detail steps:
Step 1: Initialize an object of Presentation class and load the PowerPoint document.
Presentation ppt = new Presentation();
ppt.LoadFromFile("Input.pptx");
Step 2: Get the column chart on the first slide and set chart title.
IChart columnChart = ppt.Slides[0].Shapes[0] as IChart;
columnChart.ChartTitle.TextProperties.Text = "Vertical Error Bars";
Step 3: Add Y (Vertical) error bars to the first chart series and format the error bars.
//Get Y error bars of the first chart series
IErrorBarsFormat errorBarsYFormat1 = columnChart.Series[0].ErrorBarsYFormat;
//Set end cap
errorBarsYFormat1.ErrorBarNoEndCap = false;
//Specify direction
errorBarsYFormat1.ErrorBarSimType = ErrorBarSimpleType.Plus;
//Specify error amount type
errorBarsYFormat1.ErrorBarvType = ErrorValueType.StandardError;
//Set value
errorBarsYFormat1.ErrorBarVal = 0.3f;
//Set line format
errorBarsYFormat1.Line.FillType = FillFormatType.Solid;
errorBarsYFormat1.Line.SolidFillColor.Color = Color.MediumVioletRed;
errorBarsYFormat1.Line.Width = 1;
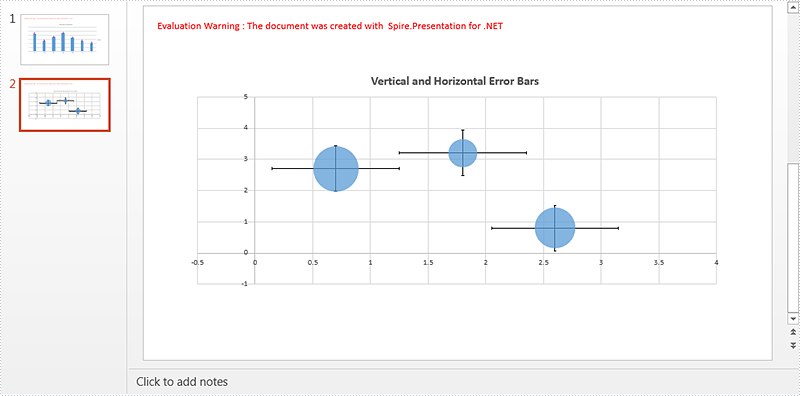
Step 4: Get the bubble chart on the second slide and set chart title.
IChart chart2 = ppt.Slides[1].Shapes[0] as IChart;
chart2.ChartTitle.TextProperties.Text = "Vertical and Horizontal Error Bars";
Step 5: Add x (Horizontal) and Y (Vertical) error bars to the first chart series and format the error bars.
//Get X error bars of the first chart series
IErrorBarsFormat errorBarsXFormat = bubbleChart.Series[0].ErrorBarsXFormat;
//Set end cap
errorBarsXFormat.ErrorBarNoEndCap = false;
//Specify direction
errorBarsXFormat.ErrorBarSimType = ErrorBarSimpleType.Both;

//Specify error amount type
errorBarsXFormat.ErrorBarvType = ErrorValueType.StandardError;
//Set value
errorBarsXFormat.ErrorBarVal = 0.3f;

//Get Y error bars of the first chart series
IErrorBarsFormat errorBarsYFormat2 = bubbleChart.Series[0].ErrorBarsYFormat;
//Set end cap
errorBarsYFormat2.ErrorBarNoEndCap = false;
//Specify direction
errorBarsYFormat2.ErrorBarSimType = ErrorBarSimpleType.Both;
//Specify error amount type
errorBarsYFormat2.ErrorBarvType = ErrorValueType.StandardError;
//Set value
errorBarsYFormat2.ErrorBarVal = 0.3f;
Step 6: Save the document.
ppt.SaveToFile("ErrorBars.pptx", FileFormat.Pptx2013);
Screenshot:
Full code:
using System.Drawing;
using Spire.Presentation;
using Spire.Presentation.Charts;
using Spire.Presentation.Drawing;

namespace Add_error_bars_to_chart_in_PPT
{
    class Program
    {
        static void Main(string[] args)
        {
            //Load the PowerPoint document
            Presentation ppt = new Presentation();
            ppt.LoadFromFile("Input.pptx");

            //Get the column chart on the first slide and set chart title
            IChart columnChart = ppt.Slides[0].Shapes[0] as IChart;
            columnChart.ChartTitle.TextProperties.Text = "Vertical Error Bars";

            //Add Y (Vertical) Error Bars

            //Get Y error bars of the first chart series
            IErrorBarsFormat errorBarsYFormat1 = columnChart.Series[0].ErrorBarsYFormat;
            //Set end cap
            errorBarsYFormat1.ErrorBarNoEndCap = false;
            //Specify direction
            errorBarsYFormat1.ErrorBarSimType = ErrorBarSimpleType.Plus;
            //Specify error amount type
            errorBarsYFormat1.ErrorBarvType = ErrorValueType.StandardError;
            //Set value
            errorBarsYFormat1.ErrorBarVal = 0.3f;
            //Set line format
            errorBarsYFormat1.Line.FillType = FillFormatType.Solid;
            errorBarsYFormat1.Line.SolidFillColor.Color = Color.MediumVioletRed;
            errorBarsYFormat1.Line.Width = 1;

            //Get the bubble chart on the second slide and set chart title
            IChart bubbleChart = ppt.Slides[1].Shapes[0] as IChart;
            bubbleChart.ChartTitle.TextProperties.Text = "Vertical and Horizontal Error Bars";

            //Add X (Horizontal) and Y (Vertical) Error Bars

            //Get X error bars of the first chart series
            IErrorBarsFormat errorBarsXFormat = bubbleChart.Series[0].ErrorBarsXFormat;
            //Set end cap
            errorBarsXFormat.ErrorBarNoEndCap = false;
            //Specify direction
            errorBarsXFormat.ErrorBarSimType = ErrorBarSimpleType.Both;
            //Specify error amount type
            errorBarsXFormat.ErrorBarvType = ErrorValueType.StandardError;
            //Set value
            errorBarsXFormat.ErrorBarVal = 0.3f;

            //Get Y error bars of the first chart series
            IErrorBarsFormat errorBarsYFormat2 = bubbleChart.Series[0].ErrorBarsYFormat;
            //Set end cap
            errorBarsYFormat2.ErrorBarNoEndCap = false;
            //Specify direction
            errorBarsYFormat2.ErrorBarSimType = ErrorBarSimpleType.Both;
            //Specify error amount type
            errorBarsYFormat2.ErrorBarvType = ErrorValueType.StandardError;
            //Set value
            errorBarsYFormat2.ErrorBarVal = 0.3f;

            //Save the document
            ppt.SaveToFile("ErrorBars.pptx", FileFormat.Pptx2013);
        }
    }
}
How to set the indent style for the paragraph on presentation slide in C#
2018-01-30 07:45:45 Written by KoohjiSpire.Presentation supports to operate the paragraph styles from code. There are two kinds of special indentation styles for the paragraph, first line and hanging. This article will demonstrate how to set the indent style for the paragraph on presentation slide in C#.
Step 1: Create an instance of presentation and load the document from file.
Presentation presentation = new Presentation();
presentation.LoadFromFile("Sample.pptx");
Step 2: Get the paragraphs from the first slide.
IAutoShape shape = (IAutoShape)presentation.Slides[0].Shapes[0];
ParagraphCollection paras = shape.TextFrame.Paragraphs;
Step 3: Set the indentation as first line for the first paragraph.
paras[0].Indent = 20;
paras[0].SpaceAfter = 10;
Step 4: Set the indentation as Hanging for the third paragraph.
paras[2].Indent = -100;
paras[2].LeftMargin = 30;
Step 5: Save the document to file.
presentation.SaveToFile("Result.pptx", FileFormat.Pptx2010);
Effective screenshot of the presentation with indentation style:
Full codes:
using Spire.Presentation;
using Spire.Presentation.Collections;
namespace SetIndentStyle
{
    class Program
    {
        static void Main(string[] args)
        {

            Presentation presentation = new Presentation();
            presentation.LoadFromFile("Sample.pptx");

            IAutoShape shape = (IAutoShape)presentation.Slides[0].Shapes[0];
            ParagraphCollection paras = shape.TextFrame.Paragraphs;

            paras[0].Indent = 20;
            paras[0].SpaceAfter = 10;

            paras[2].Indent = -100;
            paras[2].LeftMargin = 30;

            presentation.SaveToFile("Result.pptx", FileFormat.Pptx2010);
        }
    }
}
A file with the .ODT file extension is an OpenDocument Text document file. These files are most often created by the free OpenOffice Writer word processor program. ODT files are similar to the popular DOCX file format used with Microsoft Word. Both of the two file types can hold things like text, images, objects, and styles.
However, when you open an ODT document in Microsoft Word, the formatting of the ODT document may differ as a result of the two programs not sharing the same features. When converting ODT to DOCX or vice versa, the data and content will be converted successfully, but may not including the original formatting.
Following code snippets introduce how to convert ODT to DOC or DOCX and vice versa using Spire.Doc.
ODT to DOCX
To convert ODT to DOC, change the file extension and file format to .Doc in SaveToFile method.
using Spire.Doc;

namespace ODTtoDOCX
{
    class Program
    {
        static void Main(string[] args)
        {
            Document doc = new Document();
            doc.LoadFromFile("SampleODTFile.odt");
            doc.SaveToFile("output.docx", FileFormat.Docx)

        }


    }
}
Imports Spire.Doc

Namespace ODTtoDOCX
	Class Program
		Private Shared Sub Main(args As String())
			Dim doc As New Document()
			doc.LoadFromFile("SampleODTFile.odt")
			doc.SaveToFile("output.docx", FileFormat.Docx)

		End Sub
	End Class
End Namespace
DOCX to ODT
To convert Doc to ODT, load a .Doc file format document when loading the source file.
using Spire.Doc;
namespace DOCXtoODT
{
    class Program
    {
        static void Main(string[] args)
        {
            Document doc = new Document();
            doc.LoadFromFile("SampleODTFile.odt");
            doc.SaveToFile("output.docx", FileFormat.Docx);

        }
    }
}
Imports Spire.Doc
Namespace DOCXtoODT
	Class Program
		Private Shared Sub Main(args As String())
			Dim doc As New Document()
			doc.LoadFromFile("SampleODTFile.odt")
			doc.SaveToFile("output.docx", FileFormat.Docx)

		End Sub
	End Class
End Namespace
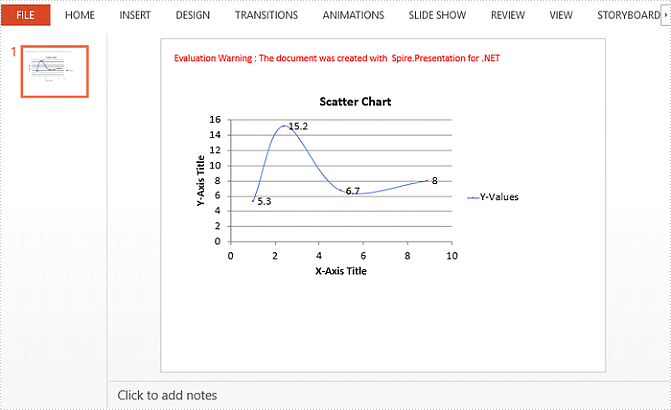
A Scatter (X Y) Chart has two value axes – X value axis and Y value axis. It combines X and Y values into single data points and shows them in irregular intervals, or clusters. This article will show you how to create scatter chart in PowerPoint using Spire.Presentation with C#.
Step 1: Create a Presentation object.
Presentation presentation = new Presentation();
Step 2: Add a "Scatter with Smooth Lines and Markers" chart to the first slide, and set the chart title.
IChart chart = presentation.Slides[0].Shapes.AppendChart(ChartType.ScatterSmoothLinesAndMarkers, new RectangleF(40, 80, 550, 320), false);
chart.ChartTitle.TextProperties.Text = "Scatter Chart";
chart.ChartTitle.TextProperties.IsCentered = true;
chart.ChartTitle.Height = 20;
chart.HasTitle = true;
Step 3: Write data to the chart data.
Double[] xdata = new Double[] { 1.0, 2.4, 5.0, 8.9 };
Double[] ydata = new Double[] { 5.3, 15.2, 6.7, 8 };
chart.ChartData[0, 0].Text = "X-Values";
chart.ChartData[0, 1].Text = "Y-Values";
for (Int32 i = 0; i < xdata.Length; ++i)
{
    chart.ChartData[i + 1, 0].Value = xdata[i];
    chart.ChartData[i + 1, 1].Value = ydata[i];
}
Step 4: Set up the data source of the X values, the Y values, and the series label.
chart.Series.SeriesLabel = chart.ChartData["B1", "B1"];
chart.Series[0].XValues= chart.ChartData["A2", "A5"];
chart.Series[0].YValues = chart.ChartData["B2", "B5"];
Step 5: Add and display the data labels in the chart.
for (int i = 0; i < 4; i++)
{
    ChartDataLabel dataLabel = chart.Series[0].DataLabels.Add();
    dataLabel.LabelValueVisible = true;
}
Step 6: Set the axis titles.
chart.PrimaryValueAxis.HasTitle = true;
chart.PrimaryValueAxis.Title.TextProperties.Text = "X-Axis Title";
chart.SecondaryValueAxis.HasTitle = true;
chart.SecondaryValueAxis.Title.TextProperties.Text = "Y-Axis Title";
Step 7: Format the gridlines.
chart.SecondaryValueAxis.MajorGridTextLines.FillType = FillFormatType.Solid;
chart.SecondaryValueAxis.MajorGridTextLines.Style = TextLineStyle.ThinThin;
chart.SecondaryValueAxis.MajorGridTextLines.SolidFillColor.Color = Color.Gray;
chart.PrimaryValueAxis.MajorGridTextLines.FillType = FillFormatType.None;
Step 8: Format the outline.
chart.Series[0].Line.FillType = FillFormatType.Solid;
chart.Series[0].Line.Width = 0.1f;
chart.Series[0].Line.SolidFillColor.Color = Color.RoyalBlue;
Step 9: Save the file.
presentation.SaveToFile("ScatterChart.pptx", FileFormat.Pptx2010);
Output:
Full Code:
using Spire.Presentation;
using Spire.Presentation.Charts;
using Spire.Presentation.Drawing;
using System;
using System.Drawing;

namespace CreateScatterChart
{
    class Program
    {
        static void Main(string[] args)
        {
            Presentation presentation = new Presentation();
            IChart chart = presentation.Slides[0].Shapes.AppendChart(ChartType.ScatterSmoothLinesAndMarkers, new RectangleF(40, 80, 550, 320), false);
            chart.ChartTitle.TextProperties.Text = "Scatter Chart";
            chart.ChartTitle.TextProperties.IsCentered = true;
            chart.ChartTitle.Height = 20;
            chart.HasTitle = true;

            Double[] xdata = new Double[] { 1.0, 2.4, 5.0, 8.9 };
            Double[] ydata = new Double[] { 5.3, 15.2, 6.7, 8 };
            chart.ChartData[0, 0].Text = "X-Values";
            chart.ChartData[0, 1].Text = "Y-Values";
            for (Int32 i = 0; i < xdata.Length; ++i)
            {
                chart.ChartData[i + 1, 0].Value = xdata[i];
                chart.ChartData[i + 1, 1].Value = ydata[i];
            }

            chart.Series.SeriesLabel = chart.ChartData["B1", "B1"];
            chart.Series[0].XValues = chart.ChartData["A2", "A5"];
            chart.Series[0].YValues = chart.ChartData["B2", "B5"];

            for (int i = 0; i < 4; i++)
            {
                ChartDataLabel dataLabel = chart.Series[0].DataLabels.Add();
                dataLabel.LabelValueVisible = true;
            }

            chart.PrimaryValueAxis.HasTitle = true;
            chart.PrimaryValueAxis.Title.TextProperties.Text = "X-Axis Title";
            chart.SecondaryValueAxis.HasTitle = true;
            chart.SecondaryValueAxis.Title.TextProperties.Text = "Y-Axis Title";

            chart.SecondaryValueAxis.MajorGridTextLines.FillType = FillFormatType.Solid;
            chart.SecondaryValueAxis.MajorGridTextLines.Style = TextLineStyle.ThinThin;
            chart.SecondaryValueAxis.MajorGridTextLines.SolidFillColor.Color = Color.Gray;
            chart.PrimaryValueAxis.MajorGridTextLines.FillType = FillFormatType.None;

            chart.Series[0].Line.FillType = FillFormatType.Solid;
            chart.Series[0].Line.Width = 0.1f;
            chart.Series[0].Line.SolidFillColor.Color = Color.RoyalBlue;

            presentation.SaveToFile("ScatterChart.pptx", FileFormat.Pptx2010);
        }
    }
}
