
Knowledgebase (2370)
Children categories
This article demonstrates how to detect the used themes in a PowerPoint document using Spire.Presentation.
Detail steps:
Step 1: Instantiate a Presentation object and load the PowerPoint document.
Presentation ppt = new Presentation();
ppt.LoadFromFile(@"Sample.pptx");
Step 2: Get the theme name of each slide in the document.
StringBuilder sb = new StringBuilder();
string themeName = null;

foreach (ISlide slide in ppt.Slides)
{
    themeName = slide.Theme.Name;
    sb.AppendLine(themeName);
}
Step 3: Save to a .txt file.
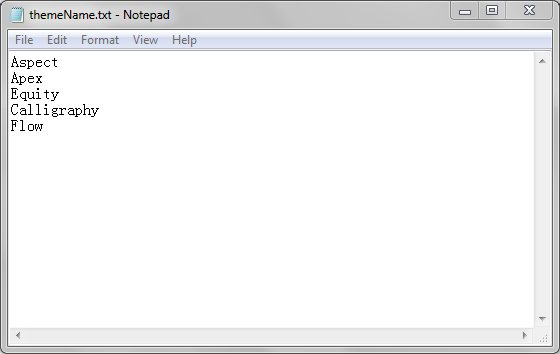
File.WriteAllText("themeName.txt", sb.ToString());
Output:
Full code:
using Spire.Presentation;
using System.IO;
using System.Text;
namespace DetectThemes
{
    class Program
    {
        static void Main(string[] args)
        {
            //Instantiate a Presentation object
            Presentation ppt = new Presentation();
            //Load the PowerPoint document
            ppt.LoadFromFile(@"Sample.pptx");

            StringBuilder sb = new StringBuilder();
            string themeName = null;

            //Get the theme name of each slide in the document
            foreach (ISlide slide in ppt.Slides)
            {
                themeName = slide.Theme.Name;
                sb.AppendLine(themeName);
            }

            //Save to a .txt file
            File.WriteAllText("themeName.txt", sb.ToString());

            }
        }
    }
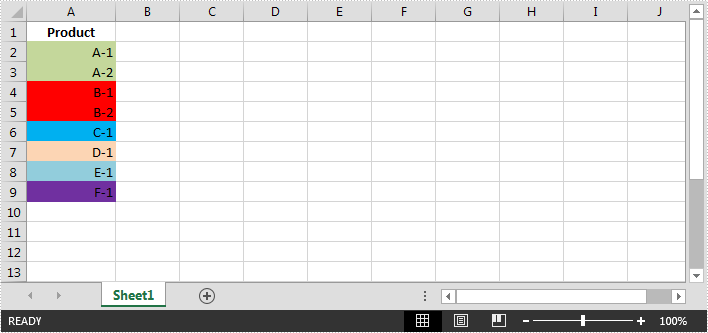
In Excel, cells can be filtered based on the cell color. This article is going to show you how to filter rows by cell color using Spire.XLS.
The example Excel file:
Detail steps:
Step 1: Instantiate a Workbook object and load the Excel file.
Workbook workbook = new Workbook();
workbook.LoadFromFile("sample.xlsx");
Step 2: Get the first worksheet.
Worksheet sheet = workbook.Worksheets[0];
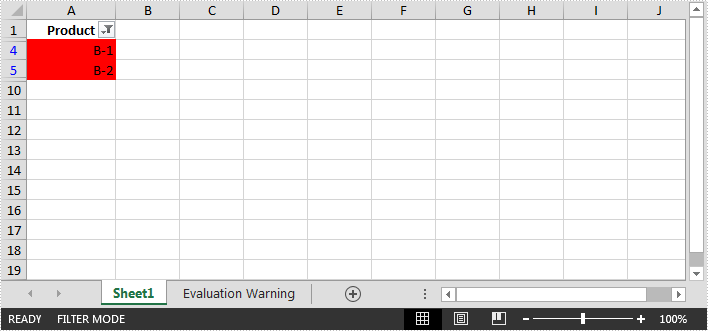
Step 3: Add a color filter to filter cells based on cell color.
//Create an auto filter in the sheet and specify the range to be filterd
sheet.AutoFilters.Range = sheet.Range["A1:A9"];
//Get the coloumn to be filterd
FilterColumn filtercolumn = (FilterColumn)sheet.AutoFilters[0];
//Add a color filter to filter the column based on cell color
sheet.AutoFilters.AddFillColorFilter(filtercolumn, Color.Red);
Step 4: Filter the data.
sheet.AutoFilters.Filter();
Step 5: Save the file.
workbook.SaveToFile("ColorFilter.xlsx", ExcelVersion.Version2013);
Screenshot:
Full code:
using Spire.Xls;
using Spire.Xls.Core.Spreadsheet.AutoFilter;
namespace FilterCells
{
    class Program
    {
        static void Main(string[] args)
        {
            //Instantiate a Workbook object
            Workbook workbook = new Workbook();
            //Load the Excel file
            workbook.LoadFromFile("sample.xlsx");

            //Get the first worksheet
            Worksheet sheet = workbook.Worksheets[0];

            //Create an auto filter in the sheet and specify the range to be filterd
            sheet.AutoFilters.Range = sheet.Range["A1:A9"];
            //Get the coloumn to be filterd
            FilterColumn filtercolumn = (FilterColumn)sheet.AutoFilters[0];
            //Add a color filter to filter the column based on cell color
            sheet.AutoFilters.AddFillColorFilter(filtercolumn, Color.Red);

            //Filter the data
            sheet.AutoFilters.Filter();

            //Save the file
            workbook.SaveToFile("ColorFilter.xlsx", ExcelVersion.Version2013);
        }
    }
}
Want to make your Excel data easier to explore and analyze? Auto Filters are your go-to tool. With just a few clicks, you can sort, filter and focus on the rows that matter. In this guide, you’ll learn how to add filters in Excel with C# using Spire.XLS for .NET, making it easy to insert Auto Filters into your spreadsheets. As a bonus, we’ll also show you how to remove Auto Filters in Excel when you're done.
Let’s dive in and make your spreadsheets smarter!
- Add Auto Filters to a Cell Range in Excel
- Apply Built-in Auto Filters in Excel: Date
- Create Custom Auto Filters in Excel
- Bonus: How to Remove Auto Filters in Excel
- Wrapping Up
- FAQ: Excel AutoFilter Questions Answered
What is Spire.XLS and Why Use It
Spire.XLS for .NET is a powerful Excel library that enables you to create, edit, and convert Excel files programmatically — no need for Microsoft Excel to be installed on your machine. It’s ideal for automating Excel tasks in C# and other .NET applications.
To get started, you can install the library via NuGet with the following command:
PM> Install-Package Spire.XLSFor smaller or lightweight Excel projects, the free version is available:
PM> Install-Package FreeSpire.XLSIf you prefer manual setup or need more installation options, you can also download Spire.XLS for .NET or Free Spire.XLS for .NET directly from the official website.
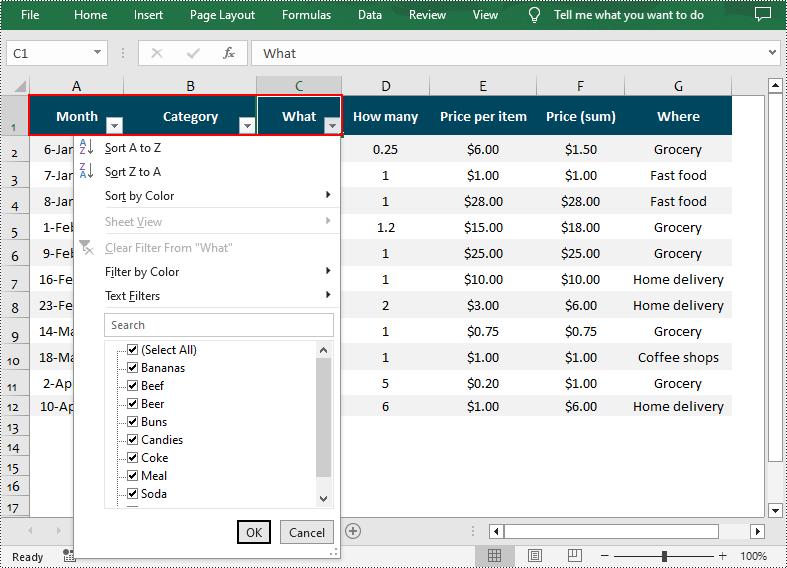
How to Add Auto Filters to a Cell Range in Excel
If you want to quickly filter data in an Excel sheet without writing formulas, Auto Filters will help to instantly display only the needed rows. In this section, you'll learn how to add Auto Filters to a specific cell range in Excel using C#. Whether you're working with a small table or a large dataset, this method helps streamline data analysis with just a few lines of code.
The steps to apply Auto Filters to a cell range with C#:
- Create a Workbook instance and read an Excel file.
- Get a certain worksheet.
- Add an AutoFilter to a specified cell range using Worksheet.AutoFilters.Range property.
- Save the modified Excel file.
Here’s a code example showing how to add an Auto Filter in the cell range “A1:C1”:
- C#
using Spire.Xls;

namespace AddAutoFilter
{
    class Program
    {
        static void Main(string[] args)
        {
            // Create a Workbook instance
            Workbook workbook = new Workbook();

            // Load an Excel file
            workbook.LoadFromFile(@"C:\Users\Administrator\Desktop\Data.xlsx");

            // Get the first worksheet
            Worksheet sheet = workbook.Worksheets[0];

            // Create an AutoFilter in the sheet and specify the range to be filtered
            sheet.AutoFilters.Range = sheet.Range["A1:C1"];

            // Save the result file
            workbook.SaveToFile("ExcelAutoFilter.xlsx", ExcelVersion.Version2016);
        }
    }
}
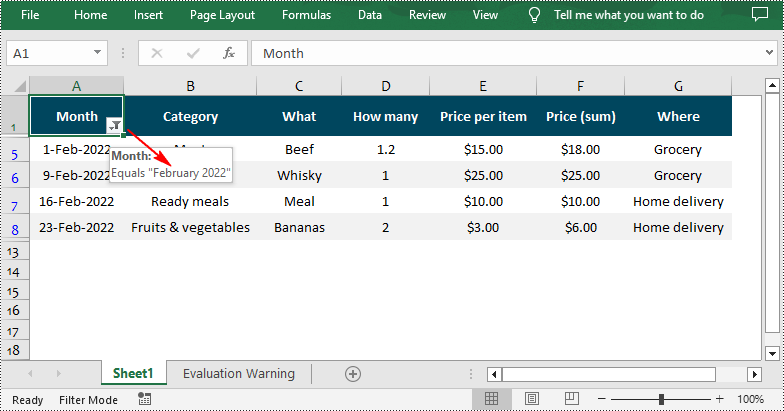
How to Add Built-in Auto Filters in Excel - Date
Excel’s built-in Auto Filters make it easy to filter data by common criteria like dates, numbers, and text. In this part, we’ll show you how to add a date Auto Filter in Excel using C#. The example focuses on applying a filter to a date column so you can quickly display rows based on specific days, months, or years.
- Create a Workbook instance and load a sample Excel spreadsheet.
- Get a worksheet and apply filters to a cell range through Worksheet.AutoFilters.Range property.
- Add a date filter to the cell range with Workbook.AutoFilters.AddDateFilter() method.
- Apply the date filter using Workbook.AutoFilters.Filter() method.
- Save the updated Excel file.
- C#
using Spire.Xls;
using Spire.Xls.Core;
using Spire.Xls.Core.Spreadsheet.AutoFilter;

namespace AddAutoFilter
{
    class Program
    {
        static void Main(string[] args)
        {
            // Create a Workbook instance
            Workbook workbook = new Workbook();

            // Load an Excel file
            workbook.LoadFromFile(@"C:\Users\Administrator\Desktop\Data.xlsx");

            // Get the first worksheet
            Worksheet sheet = workbook.Worksheets[0];

            // Create an auto filter in the sheet and specify the range to be filtered
            sheet.AutoFilters.Range = sheet.Range["A1:A12"];

            // Get the column to be filtered
            IAutoFilter filtercolumn = sheet.AutoFilters[0];

            // Add a date filter to filter data related to February 2022
            sheet.AutoFilters.AddDateFilter(filtercolumn, DateTimeGroupingType.Month, 2022, 2, 0, 0, 0, 0);

            // Apply the filter
            sheet.AutoFilters.Filter();

           // Save the result file
            workbook.SaveToFile("DateAutoFilter.xlsx", ExcelVersion.Version2016);
        }
    }
}
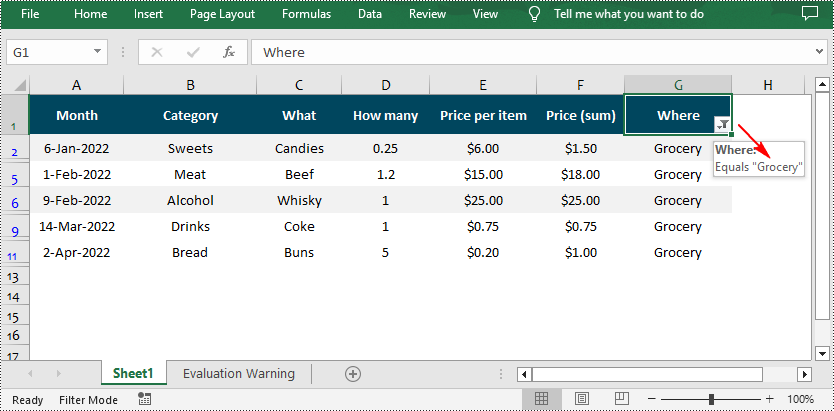
Quickly Apply Custom AutoFilter in Excel in C#
While built-in filters like date filters offer quick presets, there are times when you need more control over what gets displayed. That’s where custom AutoFilters come in. In this section, we’ll show you how to add a custom AutoFilter in Excel using C#, allowing you to filter by specific values or conditions — such as greater than, contains, or equals — to fit more complex data scenarios.
Steps to apply custom Auto Filters in Excel:
- Create a Workbook object and load an Excel file.
- Retrieve a worksheet.
- Add an Auto Filter to a cell range.
- Add a custom filter to the cell range through Workbook.AutoFilters.CustomFilter() method.
- Apply the filter using Workbook.AutoFilters.Filter() method.
- Save the resulting file.
- C#
using Spire.Xls;
using Spire.Xls.Core.Spreadsheet.AutoFilter;

namespace AddAutoFilter
{
    class Program
    {
        static void Main(string[] args)
        {
            // Create a Workbook instance
            Workbook workbook = new Workbook();

            // Load an Excel file
            workbook.LoadFromFile(@"C:\Users\Administrator\Desktop\Data.xlsx");

            // Get the first worksheet
            Worksheet sheet = workbook.Worksheets[0];

            // Create an auto filter in the sheet and specify the range to be filtered
            sheet.AutoFilters.Range = sheet.Range["G1:G12"];

            // Get the column to be filtered
            FilterColumn filtercolumn = (FilterColumn)sheet.AutoFilters[0];

            // Add a custom filter to filter data containing the string "Grocery"
            string strCrt = "Grocery";
            sheet.AutoFilters.CustomFilter(filtercolumn, FilterOperatorType.Equal, strCrt);

            // Apply the filter
            sheet.AutoFilters.Filter();

           // Save the result file
            workbook.SaveToFile("CustomAutoFilter.xlsx", ExcelVersion.Version2016);
        }
    }
}
Bonus Tip: How to Remove AutoFilters in Excel
Once you're done filtering, removing AutoFilters in Excel is just as easy. You can clear filters from a worksheet using a single line of C# code. This helps reset the view and ensures your data is fully visible again.
Want the exact steps? Check out our full guide on how to remove AutoFilters in Excel, including detailed instructions and code samples.
Wrapping Up
Adding AutoFilters in Excel using C# doesn’t have to be complicated — whether you’re working with a standard cell range, dates, or applying custom filter criteria. With just a few lines of code, you can make your Excel spreadsheets far more interactive and easier to analyze.
FAQ: Excel AutoFilter Questions Answered
Q1: How do I quickly add filters in Excel using C#?
You can quickly add filters to a cell range in Excel by using the Worksheet.AutoFilters.Range property in C#. Just define the target range and apply the filter with a single line of code.
Q2: How do I insert a drop-down filter in Excel?
Excel AutoFilters are essentially drop-down filters. Once you apply an AutoFilter to a column, Excel automatically creates a drop-down menu that lets you sort or filter the data based on values, conditions, or custom criteria.
Q3: How do I add a drop-down slicer in Excel?
Slicers are a visual filtering tool mainly used with PivotTables. While AutoFilters apply to standard worksheets, slicers offer a more user-friendly UI for filtering PivotTable data. If you're working with regular data (not PivotTables), AutoFilters are the better choice.
Q4: Can I remove filters once they’re applied in Excel with C#?
Yes, you can easily remove filters using C#. Just call the Worksheet.AutoFilters.Clear() method to remove all active filters from your worksheet.
