
Knowledgebase (2370)
Children categories
Adding Watermarks to PDF in Java: Text, Images & Custom Styling
2023-02-06 07:02:00 Written by Koohji
Watermarking PDF documents serves as an essential measure for intellectual property protection, document status identification, and brand reinforcement. Java developers can efficiently automate this process using specialized libraries like Spire.PDF for Java, which offers comprehensive solutions for applying both text-based watermarks (such as "CONFIDENTIAL" labels) and graphical watermarks (including corporate logos).
This practical guide provides step-by-step instructions for implementing PDF watermarking in Java using Spire.PDF. You'll learn proven techniques to enhance document security and professional presentation through effective watermark implementation.
- Java Library for Watermarking PDF
- Steps to Add a Watermark to PDF in Java
- Add a Text Watermark to PDF
- Add an Image Watermark to PDF
- Conclusion
- FAQs
Java Library for Watermarking PDF
Spire.PDF for Java is a versatile library that simplifies PDF manipulation, including watermarking. Its intuitive API allows developers to add watermarks with minimal code while offering fine-grained control over appearance and placement.
To get started, download Spire.PDF for Java and reference it in your project. For Maven users, include the following in your pom.xml:
<repositories>
    <repository>
        <id>com.e-iceblue</id>
        <name>e-iceblue</name>
        <url>https://repo.e-iceblue.com/nexus/content/groups/public/</url>
    </repository>
</repositories>
<dependencies>
    <dependency>
        <groupId>e-iceblue</groupId>
        <artifactId>spire.pdf</artifactId>
        <version>12.7.0</version>
    </dependency>
</dependencies>
Steps to Add a Watermark to PDF in Java
- Load the PDF using PdfDocument.
- Define the watermark (text with font/style or an image file).
- Set transparency (e.g., 0.3 for faint, 0.7 for stronger visibility).
- Calculate position (e.g., centered, custom location).
- Apply the watermark to all pages or specific ones.
- Save the modified document to a new file.
Add a Text Watermark to PDF
Text watermarks are ideal for adding labels like "DRAFT", "CONFIDENTIAL", or copyright notices. The implementation involves loading the PDF using PdfDocument , defining the font and brush for styling, and iterating through each page to apply the watermark text using a dedicated method that manages transparency, positioning, and drawing.
import com.spire.pdf.*;
import com.spire.pdf.graphics.*;
import java.awt.*;
import java.awt.geom.Dimension2D;

public class AddTextWatermark {
    public static void main(String[] args) {

        // Create a PdfDocument object
        PdfDocument doc = new PdfDocument();

        // Load a PDF document
        doc.loadFromFile("C:\\Users\\Administrator\\Desktop\\AI.pdf");

        // Create a font and a brush
        PdfTrueTypeFont font = new PdfTrueTypeFont(new Font("Arial Black", Font.PLAIN, 50), true);
        PdfBrush brush = PdfBrushes.getBlue();

        // Specify the watermark text
        String watermarkText = "DO NOT COPY";

        // Specify the opacity level
        float opacity = 0.6f;

        // Iterate through the pages
        for (int i = 0; i < doc.getPages().getCount(); i++) {
            PdfPageBase page = doc.getPages().get(i);
            // Draw watermark text on the page
            addTextWatermark(page, watermarkText, font, brush, opacity);
        }

        // Save the changes to another file
        doc.saveToFile("output/Watermark.pdf");

        // Dispose resources
        doc.dispose();
    }

    // Method to add a text watermark to a given page
    private static void addTextWatermark(PdfPageBase page, String watermarkText, PdfTrueTypeFont font, PdfBrush brush, float opacity) {

        // Set the transparency level for the watermark
        page.getCanvas().setTransparency(opacity);

        // Measure the size of the watermark text
        Dimension2D textSize = font.measureString(watermarkText);

        // Get the width and height of the page
        double pageWidth = page.getActualSize().getWidth();
        double pageHeight = page.getActualSize().getHeight();

        // Calculate the position to center the watermark on the page
        double x = (pageWidth - textSize.getWidth()) / 2;
        double y = (pageHeight - textSize.getHeight()) / 2;

        // Draw the watermark text on the page at the calculated position
        page.getCanvas().drawString(watermarkText, font, brush, x, y);
    }
}
Output:
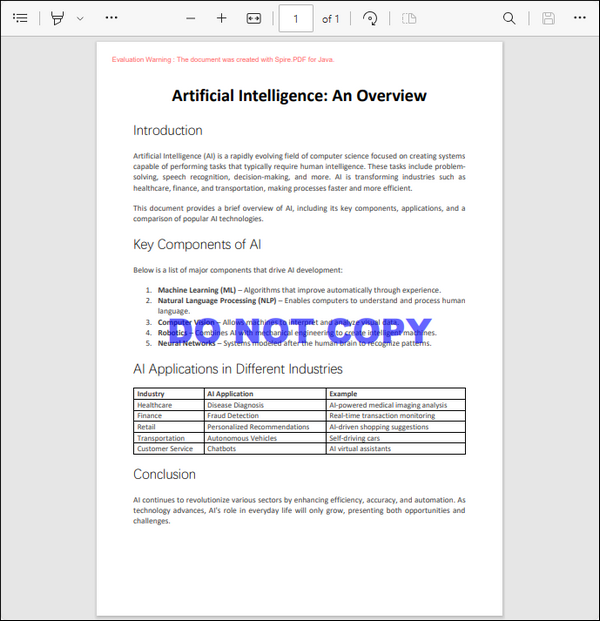
Add an Image Watermark to PDF
Image watermarks, such as logos, can elevate the professionalism of a document. This process begins by loading the PDF and specifying the image path and opacity. We then iterate through each page, calling a method that loads the image, calculates its position, and draws it on the page with the specified transparency.
import com.spire.pdf.*;
import com.spire.pdf.graphics.*;

public class AddImageWatermark {
    public static void main(String[] args) {

        // Create a PdfDocument object
        PdfDocument doc = new PdfDocument();

        // Load a PDF document
        doc.loadFromFile("C:\\Users\\Administrator\\Desktop\\AI.pdf");

        // Specify the image path
        String imagePath = "C:\\Users\\Administrator\\Desktop\\logo2.png";

        // Specify the opacity level
        float opacity = 0.3f;

        // Iterate through the pages
        for (int i = 0; i < doc.getPages().getCount(); i++) {

            // Draw watermark text on the current page
            addImageWatermark(doc.getPages().get(i), imagePath, opacity);
        }

        // Save the changes to another file
        doc.saveToFile("output/Watermark.pdf");

        // Dispose resources
        doc.dispose();
    }

    // Method to add an Image watermark to a given page
    private static void addImageWatermark(PdfPageBase page, String imagePath, float opacity) {

        // Load the image
        PdfImage image = PdfImage.fromFile(imagePath);

        // Get the width and height of the image
        double imageWidth = (double)image.getWidth();
        double imageHeight = (double)image.getHeight();

        // Get the width and height of the page
        double pageWidth = page.getActualSize().getWidth();
        double pageHeight = page.getActualSize().getHeight();

        // Calculate the position to center the watermark on the page
        double x = (pageWidth - imageWidth) / 2;
        double y = (pageHeight - imageHeight) / 2;

        // Set the transparency level for the watermark
        page.getCanvas().setTransparency(opacity);

        // Draw the image on the page at the calculated position
        page.getCanvas().drawImage(image, x, y);
    }
}
Output:
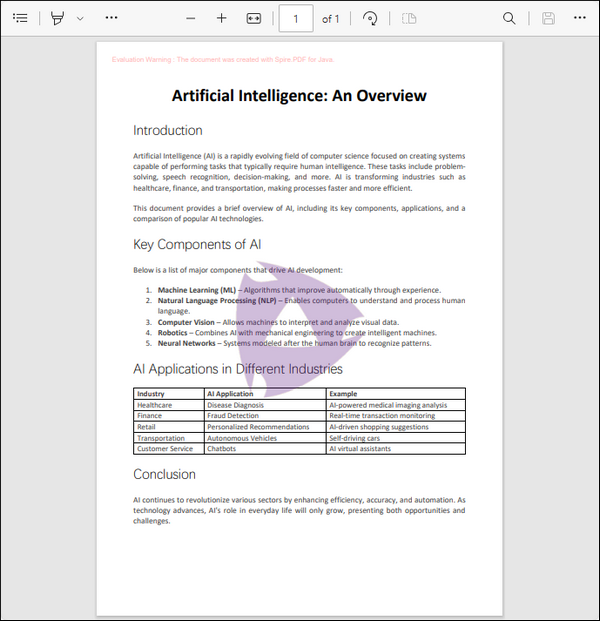
Conclusion
In conclusion, adding watermarks to PDF documents in Java is a straightforward task with the right tools and techniques. By leveraging the Spire.PDF for Java library, developers can seamlessly integrate dynamic text watermarks (like copyright notices) or high-resolution image logos while maintaining optimal file performance.
This guide provided a step-by-step approach, from initial setup to final implementation, ensuring that you can protect your documents effectively. Whether for personal use or professional needs, watermarking is an essential skill that adds a layer of professionalism and integrity to your work.
FAQs
Q1. Can I rotate the watermark text?
Yes, use page.getCanvas().rotateTransform(angle) before drawing the text.
Q2. How do I adjust the position of the watermark?
You can modify the x and y coordinates in the addTextWatermark and addImageWatermark methods to change the watermark position.
Q3. Is it possible to add multiple watermarks to the same PDF?
Yes, by calling drawString() or drawImage() multiple times with different parameters.
Q4. Can I use a transparent PNG as a watermark?
Yes, Spire.PDF preserves the transparency of PNG images.
Q5. How do I apply watermarks to specific pages only?
Modify the loop to target specific pages, e.g., if (i == 0) applies the watermark only to the first page.
Get a Free License
To fully experience the capabilities of Spire.PDF for Java without any evaluation limitations, you can request a free 30-day trial license.
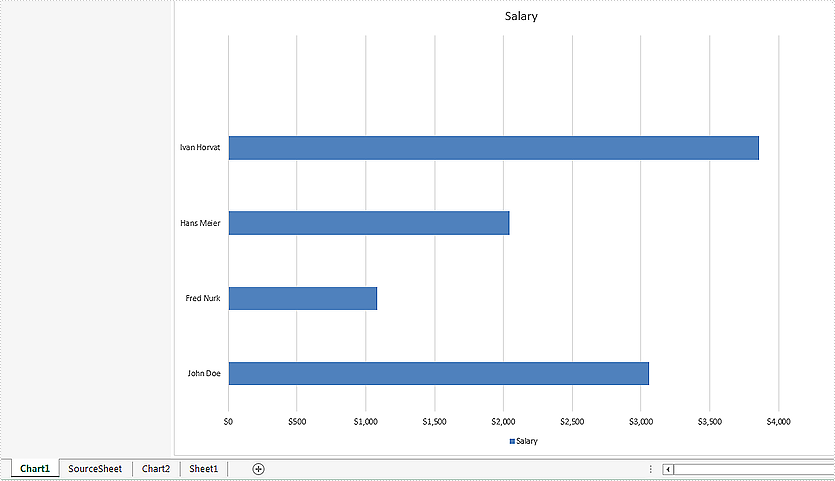
A ChartSheet represents a chart sheet. It is a worksheet that contains only a chart. This article will demonstrate how to convert a chart sheet to SVG stream by using Spire.XLS.
Firstly, view the sample Excel worksheets with two chart sheets.
Convert all the chart sheets to SVG stream:
using System.Drawing.Imaging;
using System.IO;
namespace Convert
{
    class Program
    {
        static void Main(string[] args)
        {
            //load the document from file
            Workbook workbook = new Workbook();
            workbook.LoadFromFile("Sample.xlsx");

            //call ToSVGStream(Stream stream) method to save each chart sheet to SVG stream
            for (int i = 0; i < workbook.Chartsheets.Count; i++)
            {
                FileStream fs = new FileStream(string.Format("chartsheet-{0}.svg", i), FileMode.Create);
                workbook.Chartsheets[i].ToSVGStream(fs);
                fs.Flush();
                fs.Close();
            }


        }
    }
}
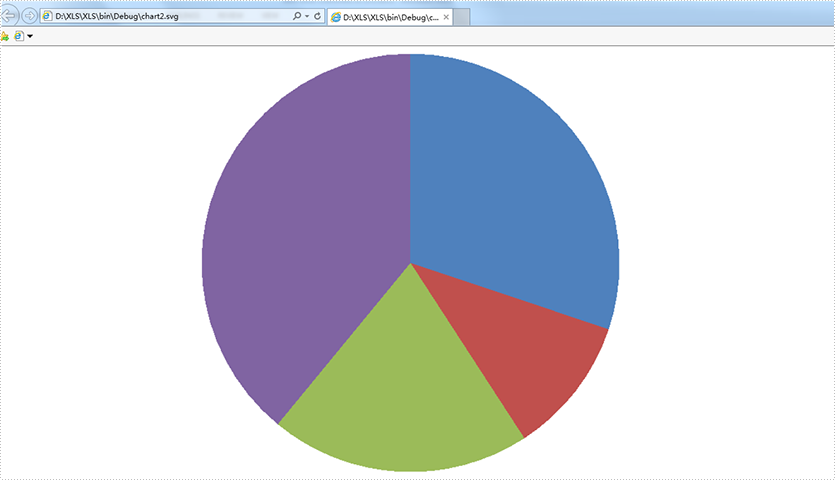
Effective screenshot of the two chart sheets to SVG.
using System.Drawing.Imaging;
using System.IO;
namespace Convert
{
    class Program
    {
        static void Main(string[] args)
        {
            //load the document from file
            Workbook workbook = new Workbook();
            workbook.LoadFromFile("Sample.xlsx");

            //get the second chartsheet by name
            ChartSheet cs = workbook.GetChartSheetByName("Chart2");

            //save to SVG stream
            FileStream fs = new FileStream(string.Format("chart2.svg"), FileMode.Create);
            cs.ToSVGStream(fs);
            fs.Flush();
            fs.Close();


        }
    }
}
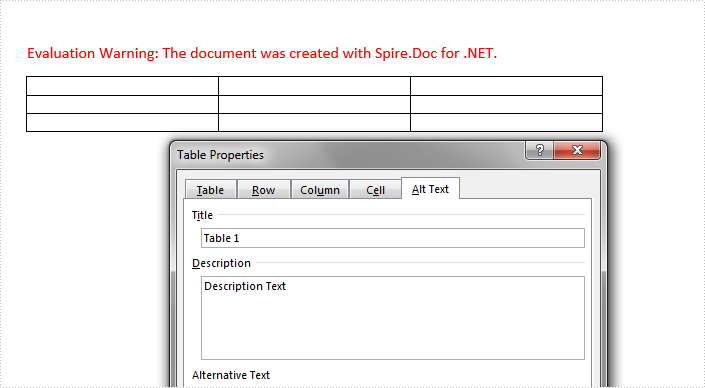
Alternative text (alt text) can help people with screen readers understand the content of our table. This article is going to demonstrate how to add or get the alternative text of a table in a word document using Spire.Doc.
In Spire.Doc, we can set or get the alternative text of a table using the Table.Title and Table.TableDescription properties. The following example shows how to add alternative text to a table.
Detail steps:
Step 1: Instantiate a Document object and load a word document.
Document doc = new Document();
doc.LoadFromFile("Input.docx");
Step 2: Get the first section.
Section section = doc.Sections[0];
Step 3: Get the first table in the section.
Table table = section.Tables[0] as Table;
Step 4: Add alt text to the table.
//Add title
table.Title = "Table 1";
//Add description
table.TableDescription = "Description Text";
Step 5: Save the document.
doc.SaveToFile("output.docx", FileFormat.Docx2013);
Screenshot:
Full code:
using Spire.Doc;

namespace Add_Alt_Text_To_Word_Table
{
    class Program
    {
        static void Main(string[] args)
        {
            //Instantiate a Document object
            Document doc = new Document();
            //Load a word document
            doc.LoadFromFile("Input.docx");

            //Get the first section
            Section section = doc.Sections[0];

            //Get the first table in the section
            Table table = section.Tables[0] as Table;

            //Add alt text

            //Add tile
            table.Title = "Table 1";
            //Add description
            table.TableDescription = "Description Text";

            //Save the document
            doc.SaveToFile("output.docx", FileFormat.Docx2013);
        }
    }
}
