
Knowledgebase (2370)
Children categories
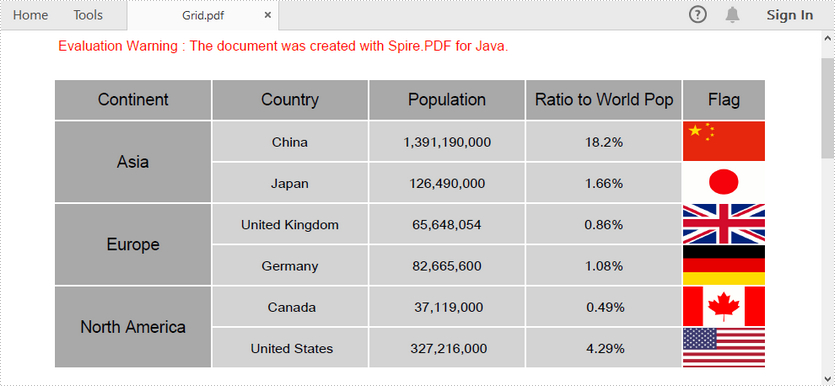
In this article, you'll learn how to add a grid to PDF and how to format the grid as well, by using Spire.PDF with Java.
import com.spire.pdf.graphics.*;
import com.spire.pdf.grid.PdfGrid;

import java.awt.*;

public class CreateGrid {

    public static void main(String[] args) {

        //create a pdf document
        PdfDocument doc = new PdfDocument();
        PdfPageBase page = doc.getPages().add();

        //create a PdfGrid object
        PdfGrid grid = new PdfGrid();

        //set the cell padding, font, text brush, background brush of the grid
        grid.getStyle().setCellPadding(new PdfPaddings(3,3,3,3));
        grid.getStyle().setFont(new PdfTrueTypeFont(new Font("Arial Unicode MS", Font.PLAIN,10), true));
        grid.getStyle().setTextBrush(PdfBrushes.getBlack());
        grid.getStyle().setBackgroundBrush(PdfBrushes.getLightGray());

        //create a PdfBorders object
        PdfBorders borders= new PdfBorders();
        borders.setAll(new PdfPen(PdfBrushes.getWhite(),1f));

        //define sample data
        String[] data = {"Continent;Country;Population;Ratio to World Pop;Flag",
                "Asia;China;1,391,190,000;18.2%; ",
                "Asia;Japan;126,490,000;1.66%; ",
                "Europe;United Kingdom;65,648,054;0.86%; ",
                "Europe;Germany;82,665,600;1.08%; ",
                "North America; Canada; 37,119,000; 0.49%; ",
                "North America; United States; 327,216,000; 4.29%; "
                };
        String[][] dataSource = new String[data.length][];
        for (int i = 0; i < data.length; i++) {
            dataSource[i] = data[i].split("[;]", -1);
        }

        //fill the grid with data
        grid.setDataSource(dataSource);

        //fill the cells with background images
        grid.getRows().get(1).getCells().get(4).getStyle().setBackgroundImage(PdfImage.fromFile("F:\\Documents\\flags\\flag-of-China.png"));
        grid.getRows().get(2).getCells().get(4).getStyle().setBackgroundImage(PdfImage.fromFile("F:\\Documents\\flags\\flag-of-Japan.png"));
        grid.getRows().get(3).getCells().get(4).getStyle().setBackgroundImage(PdfImage.fromFile("F:\\Documents\\flags\\flag-of-United-Kingdom.png"));
        grid.getRows().get(4).getCells().get(4).getStyle().setBackgroundImage(PdfImage.fromFile("F:\\Documents\\flags\\flag-of-Germany.png"));
        grid.getRows().get(5).getCells().get(4).getStyle().setBackgroundImage(PdfImage.fromFile("F:\\Documents\\flags\\flag-of-Canada.png"));
        grid.getRows().get(6).getCells().get(4).getStyle().setBackgroundImage(PdfImage.fromFile("F:\\Documents\\flags\\flag-of-United-States-of-America.png"));

        //set the width of the last column
        grid.getColumns().get(grid.getColumns().getCount()-1).setWidth(60f);

        //vertically span cells
        grid.getRows().get(1).getCells().get(0).setRowSpan(2);
        grid.getRows().get(3).getCells().get(0).setRowSpan(2);
        grid.getRows().get(5).getCells().get(0).setRowSpan(2);

        for (int i = 0; i < data.length ; i++) {

            //set the height of each row
            grid.getRows().get(i).setHeight(30f);
            //set the background color of the first column
            grid.getRows().get(i).getCells().get(0).getStyle().setBackgroundBrush(PdfBrushes.getDarkGray());
            //set the font of the first column
            grid.getRows().get(i).getCells().get(0).getStyle().setFont(new PdfTrueTypeFont(new Font("Arial",Font.PLAIN,12),true));

            for (int j = 0; j < grid.getColumns().getCount(); j++) {

                //apply border style to all cells
                grid.getRows().get(i).getCells().get(j).getStyle().setBorders(borders);
                //apply text alignment to all cells
                grid.getRows().get(i).getCells().get(j).setStringFormat(new PdfStringFormat(PdfTextAlignment.Center,PdfVerticalAlignment.Middle));
                //set the font of the first row
                grid.getRows().get(0).getCells().get(j).getStyle().setFont(new PdfTrueTypeFont(new Font("Arial",Font.PLAIN,12),true));
                //set the background color of the first row
                grid.getRows().get(0).getCells().get(j).getStyle().setBackgroundBrush(PdfBrushes.getDarkGray());

            }
        }

        //draw grid on the pdf page
        grid.draw(page,0,30);

        //save to file
        doc.saveToFile("Grid.pdf");
        doc.close();
    }
}
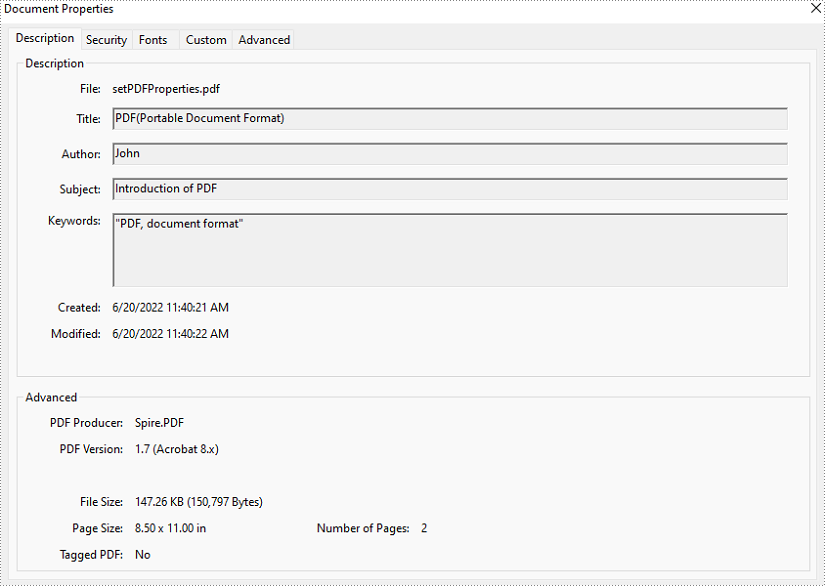
PDF properties, as a part of a PDF document, are not shown on a page. Those properties contain information on documents, including title, author, subject, keywords, creation date, and creator. Some of the property values will not be produced automatically, and we have to set them by ourselves. This article will show you how to set or retrieve PDF properties programmatically using Spire.PDF for Java.
Install Spire.PDF for Java
First of all, you're required to add the Spire.Pdf.jar file as a dependency in your Java program. The JAR file can be downloaded from this link. If you use Maven, you can easily import the JAR file in your application by adding the following code to your project's pom.xml file.
<repositories>
    <repository>
        <id>com.e-iceblue</id>
        <name>e-iceblue</name>
        <url>https://repo.e-iceblue.com/nexus/content/groups/public/</url>
    </repository>
</repositories>
<dependencies>
    <dependency>
        <groupId>e-iceblue</groupId>
        <artifactId>spire.pdf</artifactId>
        <version>12.7.0</version>
    </dependency>
</dependencies>
Set Properties of a PDF Document in Java
The detailed steps of setting PDF properties are as follows.
- Create an object of PdfDocument class.
- Load a PDF document from disk using PdfDocument.loadFromFile() method.
- Set document properties including title, author, subject, keywords, creation date, modification date, creator, and producer using the methods under DocumentInformation object returned by PdfDocument.getDocumentInformation() method.
- Save the document using PdfDocument.saveToFile() method.
- Java
import com.spire.pdf.*;
import java.util.Date;

public class setPDFProperties {
    public static void main(String[] args) {
        //Create an object of PdfDocument
        PdfDocument pdfDocument = new PdfDocument();

        //Load a PDF document from disk
        pdfDocument.loadFromFile("D:/Samples/Sample.pdf");

        //Set the title
        pdfDocument.getDocumentInformation().setTitle("PDF(Portable Document Format)");

        //Set the author
        pdfDocument.getDocumentInformation().setAuthor("John");

        //Set the subject
        pdfDocument.getDocumentInformation().setSubject("Introduction of PDF");

        //Set the keywords
        pdfDocument.getDocumentInformation().setKeywords("PDF, document format");

        //Set the creation time
        pdfDocument.getDocumentInformation().setCreationDate(new Date());

        //Set the creator name
        pdfDocument.getDocumentInformation().setCreator("John");

        //Set the modification time
        pdfDocument.getDocumentInformation().setModificationDate(new Date());

        //Set the producer name
        pdfDocument.getDocumentInformation().setProducer("Spire.PDF for Java");

        //Save the document
        pdfDocument.saveToFile("output/setPDFProperties.pdf");
    }
}
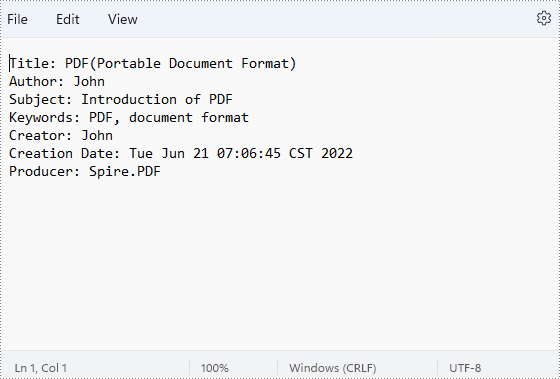
Get Properties of a PDF Document in Java
The detailed steps of retrieving PDF properties are as follows.
- Create an object of PdfDocument class.
- Load a PDF document from disk using PdfDocument.loadFromFile() method.
- Create a StringBuilder instance to store the values of document properties.
- Get properties using the methods under DocumentInformation object returned by PdfDocument.getDocumentInformation() method and put them in the StringBuilder.
- Create a new TXT file using File.createNewFile() method.
- Write the StringBuilder to the TXT file using BufferedWriter.write() method.
- Java
import com.spire.pdf.*;
import java.io.*;

public class getPDFProperties {
    public static void main(String[] args) throws IOException {
        //Create an object of PdfDocument class
        PdfDocument pdf = new PdfDocument();

        //Load a PDF document from disk
        pdf.loadFromFile("D:/Samples/Sample.pdf");

        //Create a StringBuilder instance to store the values of document properties
        StringBuilder stringBuilder = new StringBuilder();

        //Retrieve property values and put them in the StringBuilder
        stringBuilder.append("Title: " + pdf.getDocumentInformation().getTitle() + "\r\n");
        stringBuilder.append("Author: " + pdf.getDocumentInformation().getAuthor() + "\r\n");
        stringBuilder.append("Subject: " + pdf.getDocumentInformation().getSubject() + "\r\n");
        stringBuilder.append("Keywords: " + pdf.getDocumentInformation().getKeywords() + "\r\n");
        stringBuilder.append("Creator: " + pdf.getDocumentInformation().getCreator() + "\r\n");
        stringBuilder.append("Creation Date: " + pdf.getDocumentInformation().getCreationDate() + "\r\n");
        stringBuilder.append("Producer: " + pdf.getDocumentInformation().getProducer() + "\r\n");

        //Create a new TXT file
        File file = new File("D:/output/getPDFProperties.txt");
        file.createNewFile();

        //Write the StringBuilder to the TXT file
        FileWriter fileWriter = new FileWriter(file, true);
        BufferedWriter bufferedWriter = new BufferedWriter(fileWriter);
        bufferedWriter.write(stringBuilder.toString());
        bufferedWriter.flush();
    }
}
Apply for a Temporary License
If you'd like to remove the evaluation message from the generated documents, or to get rid of the function limitations, please request a 30-day trial license for yourself.
When creating PDF, it’s important to use appropriate fonts in different situations. For normal PDF files, you can draw text with common fonts such as Arial, Times New Roman. If you want to create a distinctive PDF with a unique visual identity, you can use private fonts. This article will demonstrate how to use different fonts in a PDF document with Spire.PDF for Java library.
Install Spire.PDF for Java
First of all, you're required to add the Spire.Pdf.jar file as a dependency in your Java program. The JAR file can be downloaded from this link. If you use Maven, you can easily import the JAR file in your application by adding the following code to your project's pom.xml file.
<repositories>
    <repository>
        <id>com.e-iceblue</id>
        <name>e-iceblue</name>
        <url>https://repo.e-iceblue.com/nexus/content/groups/public/</url>
    </repository>
</repositories>
<dependencies>
    <dependency>
        <groupId>e-iceblue</groupId>
        <artifactId>spire.pdf</artifactId>
        <version>12.7.0</version>
    </dependency>
</dependencies>
Apply Different Fonts in a PDF Document in Java
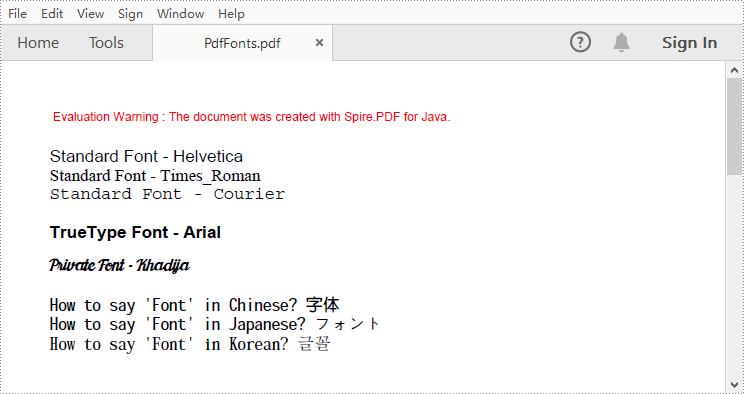
Spire.PDF for Java supports standard PDF fonts, TrueType fonts, private fonts as well as CJK font. The following are the steps to draw text in PDF using these fonts.
- Create a PdfDocument instance.
- Add a page and then create a brush.
- Create an instance of the PdfFont class with a standard PDF font, and then use the PdfPageBase.getCanvas().drawString() method to draw text on the page with the standard font.
- Create an instance of the PdfTrueTypeFont class with a specified font, and then draw text on the page with the TrueType font.
- Load a private font and create an instance of the PdfTrueTypeFont class with it. Then draw text on the page with the private font.
- Create an instance of PdfCjkStandardFont class with a CJK font, and then draw text on the page with the CJK font.
- Save the result document using PdfDocument.saveToFile() method.
- Java
import com.spire.pdf.PdfDocument;
import com.spire.pdf.PdfPageBase;
import com.spire.pdf.graphics.*;

public class PdfFonts {

    public static void main(String[] args) {

        //Create a PdfDocument instance
        PdfDocument pdf = new PdfDocument();

        //Add a page
        PdfPageBase page = pdf.getPages().add();

        //Create a brush
        PdfBrush brush = PdfBrushes.getBlack();

        //Initialize y coordinate
        float y = 30;

        //Draw text using standard fonts
        PdfFont standardFont = new PdfFont(PdfFontFamily.Helvetica, 14f);
        page.getCanvas().drawString("Standard Font - Helvetica", standardFont, brush, 0, y);
        standardFont = new PdfFont(PdfFontFamily.Times_Roman, 14f);
        page.getCanvas().drawString("Standard Font - Times_Roman", standardFont, brush, 0, (y = y + 16));
        standardFont = new PdfFont(PdfFontFamily.Courier, 14f);
        page.getCanvas().drawString("Standard Font - Courier", standardFont, brush, 0, (y = y + 16));

        //Draw text using truetype font
        java.awt.Font font = new java.awt.Font("Arial", java.awt.Font.BOLD, 14);
        PdfTrueTypeFont trueTypeFont = new PdfTrueTypeFont(font);
        page.getCanvas().drawString("TrueType Font - Arial", trueTypeFont, brush, 0, (y = y + 30f));

        //Draw text using private font
        String fontFileName = "Khadija.ttf";
        trueTypeFont = new PdfTrueTypeFont(fontFileName, 14f);
        page.getCanvas().drawString("Private Font - Khadija", trueTypeFont, brush, 0, (y = y + 30f));

        //Draw text using cjk fonts
        PdfCjkStandardFont cjkFont = new PdfCjkStandardFont(PdfCjkFontFamily.Monotype_Hei_Medium, 14f);
        page.getCanvas().drawString("How to say 'Font' in Chinese? \u5B57\u4F53", cjkFont, brush, 0, (y = y + 30f));
        cjkFont = new PdfCjkStandardFont(PdfCjkFontFamily.Hanyang_Systems_Gothic_Medium, 14f);
        page.getCanvas().drawString("How to say 'Font' in Japanese? \u30D5\u30A9\u30F3\u30C8", cjkFont, brush, 0, (y = y + 16f));
        cjkFont = new PdfCjkStandardFont(PdfCjkFontFamily.Hanyang_Systems_Shin_Myeong_Jo_Medium, 14f);
        page.getCanvas().drawString("How to say 'Font' in Korean? \uAE00\uAF34", cjkFont, brush, 0, (y = y + 16f));

        //Save the result document
        pdf.saveToFile("PdfFonts.pdf");
        pdf.close();
    }
}
Apply for a Temporary License
If you'd like to remove the evaluation message from the generated documents, or to get rid of the function limitations, please request a 30-day trial license for yourself.
