
Knowledgebase (2370)
Children categories
We have demonstrated how to use Spire.Presentation to add and get speaker notes in presentation slides. This article will show how to remove the speaker notes in presentation slides in C#.
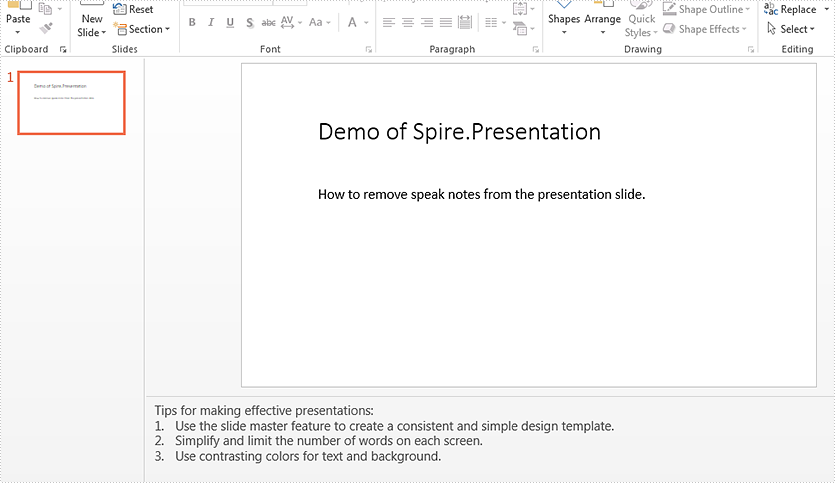
Firstly, view the sample document contains the speaker notes.
Step 1: Create a presentation document and load the document from the file.
Presentation ppt = new Presentation();
ppt.LoadFromFile("Sample.pptx", FileFormat.Pptx2013);
Step 2: Get the first slide from the sample document.
ISlide slide = ppt.Slides[0];
Step 3: Remove the first speak notes:
slide.NotesSlide.NotesTextFrame.Paragraphs.RemoveAt(1);
Remove all the speak notes from the first slide:
slide.NotesSlide.NotesTextFrame.Paragraphs.Clear();
Step 4: Save the document to file.
ppt.SaveToFile("Result.pptx",FileFormat.Pptx2013);
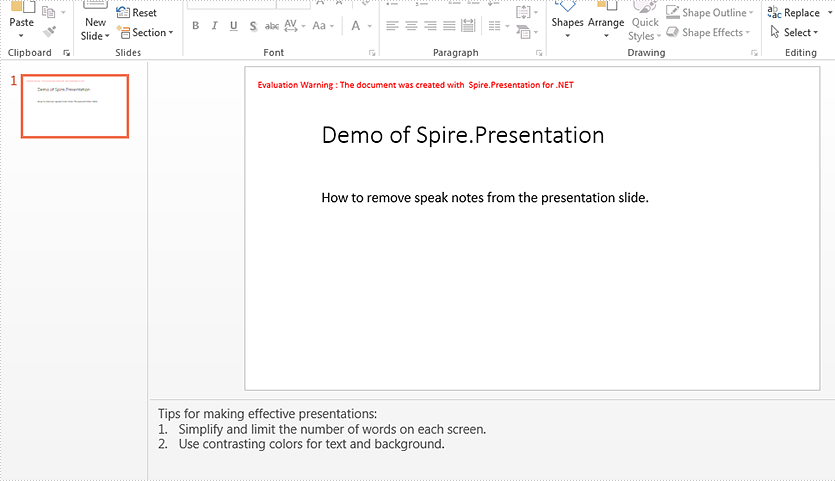
Effective screenshot of removing the first note:
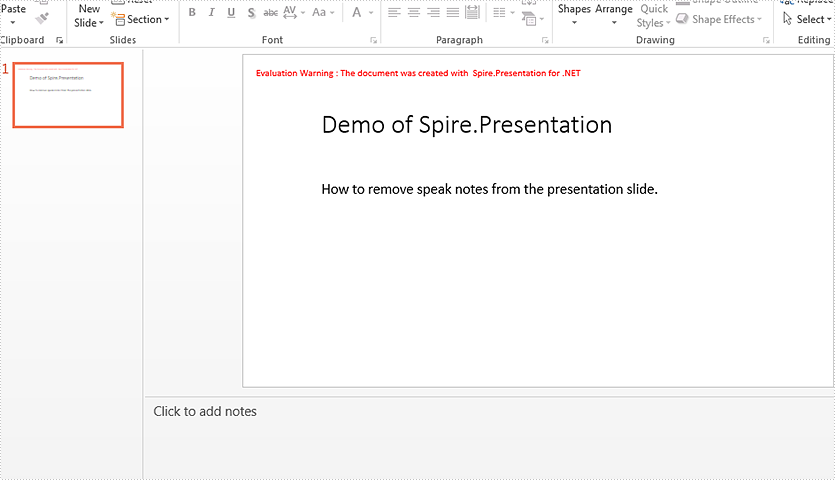
Effective screenshot of removing all the notes:
Full codes:
Remove the first note in presentation slide:
using Spire.Presentation;
namespace RemoveSpeakerNotes
{

    class Program
    {

        static void Main(string[] args)
        {
            Presentation ppt = new Presentation();
            ppt.LoadFromFile("Sample.pptx", FileFormat.Pptx2013);

            ISlide slide = ppt.Slides[0];

            slide.NotesSlide.NotesTextFrame.Paragraphs.RemoveAt(1);
            ppt.SaveToFile("Result.pptx", FileFormat.Pptx2013);

        }

    }
}
Clear all notes in presentation slide:
Imports Spire.Presentation
Namespace RemoveSpeakerNotes

	Class Program

		Private Shared Sub Main(args As String())
			Dim ppt As New Presentation()
			ppt.LoadFromFile("Sample.pptx", FileFormat.Pptx2013)

			Dim slide As ISlide = ppt.Slides(0)

			slide.NotesSlide.NotesTextFrame.Paragraphs.RemoveAt(1)
			ppt.SaveToFile("Result.pptx", FileFormat.Pptx2013)

		End Sub

	End Class
End Namespace
Knowing the number of pages in a PDF helps you understand the length of the document, which is especially useful in scenarios where a large number of PDF documents need to be processed, such as office work, academic research, or legal document management. By getting the PDF page count, you can estimate the time required to process the document, thus rationalizing tasks and increasing efficiency. In this article, you will learn how to get the number of pages in a PDF file in Java using Spire.PDF for Java.
Install Spire.PDF for Java
First of all, you're required to add the Spire.Pdf.jar file as a dependency in your Java program. The JAR file can be downloaded from this link. If you use Maven, you can easily import the JAR file in your application by adding the following code to your project's pom.xml file.
<repositories>
    <repository>
        <id>com.e-iceblue</id>
        <name>e-iceblue</name>
        <url>https://repo.e-iceblue.com/nexus/content/groups/public/</url>
    </repository>
</repositories>
<dependencies>
    <dependency>
        <groupId>e-iceblue</groupId>
        <artifactId>spire.pdf</artifactId>
        <version>12.7.0</version>
    </dependency>
</dependencies>
Count the Number of Pages in a PDF File in Java
The PdfDocument.getPages().getCount() method provided by Spire.PDF for Java allows to quickly count the number of pages in a PDF file without opening it. The following are the detailed steps.
- Create a PdfDocument object.
- Load a sample PDF file using PdfDocument.loadFromFile() method.
- Count the number of pages in the PDF file using PdfDocument.getPages().getCount() method.
- Print out the result.
- Java
import com.spire.pdf.PdfDocument;

public class CountPdfPages {

    public static void main(String[] args) {

        //Create a PdfDocument instance
        PdfDocument pdf = new PdfDocument();

        //Load a PDF file
       pdf.loadFromFile("contract.pdf");

        //Count the number of pages in the PDF file
        int pageCount = pdf.getPages().getCount();

        //Output the result
        System.out.print("The number of pages in the PDF is: " + pageCount);
    }
}

Apply for a Temporary License
If you'd like to remove the evaluation message from the generated documents, or to get rid of the function limitations, please request a 30-day trial license for yourself.
A fillable PDF form is useful for collecting data from users. Being able to create interactive and fillable PDF forms is important since PDF has become one of the most popular file formats in business. This article demonstrates how to create, fill, or remove fillable form fields in PDF using Spire.PDF for Java.
- Create Fillable Form Fields in a PDF Document
- Fill Form Fields in an Existing PDF Document
- Delete a Particular Field or All Fields in an Existing PDF Document
Spire.PDF for Java offers a series of useful classes under the com.spire.pdf.fields namespace, allowing programmers to create and edit various types of form fields including text box, check box, combo box, list box, and radio button. The table below lists some of the core classes involved in this tutorial.
| Class | Description |
| PdfForm | Represents interactive form of the PDF document. |
| PdfField | Represents field of the PDF document's interactive form. |
| PdfTextBoxField | Represents text box field in the PDF form. |
| PdfCheckBoxField | Represents check box field in the PDF form. |
| PdfComboBoxField | Represents combo box field in the PDF Form. |
| PdfListBoxField | Represents list box field of the PDF form. |
| PdfListFieldItem | Represents an item of a list field. |
| PdfRadioButtonListField | Represents radio button field in the PDF form. |
| PdfRadioButtonListItem | Represents an item of a radio button list. |
| PdfButtonField | Represents button field in the PDF form. |
| PdfSignatureField | Represents signature field in the PDF form. |
Install Spire.PDF for Java
First, you're required to add the Spire.Pdf.jar file as a dependency in your Java program. The JAR file can be downloaded from this link. If you use Maven, you can easily import the JAR file in your application by adding the following code to your project's pom.xml file.
<repositories>
    <repository>
        <id>com.e-iceblue</id>
        <name>e-iceblue</name>
        <url>https://repo.e-iceblue.com/nexus/content/groups/public/</url>
    </repository>
</repositories>
<dependencies>
    <dependency>
        <groupId>e-iceblue</groupId>
        <artifactId>spire.pdf</artifactId>
        <version>12.7.0</version>
    </dependency>
</dependencies>
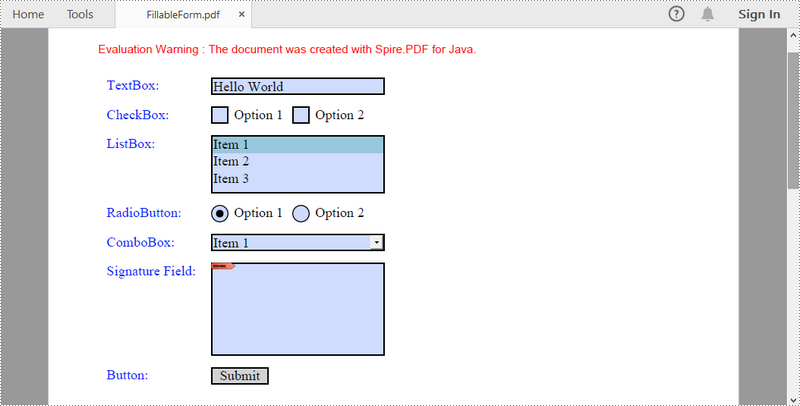
Create Fillable Form Fields in a PDF Document in Java
To create a field, initialize an instance of the corresponding class. Specify its size and position in the document using setBounds() method, and then add it to PDF using PdfForm.getFields().add() method. The following are the steps to create various types of form fields in a PDF document using Spire.PDF for Java.
- Create a PdfDocument object.
- Add a page using PdfDocuemnt.getPages().add() method.
- Create a PdfTextBoxField object, set the properties of the field including Bounds, Font and Text, and then add it to the document using PdFormfFieldCollection.add() method.
- Repeat the step 3 to add check box, combo box, list box, radio button, signature field and button to the document.
- Save the document to a PDF file using PdfDocument.saveToFile() method.
- Java
import com.spire.pdf.FileFormat;
import com.spire.pdf.PdfDocument;
import com.spire.pdf.PdfPageBase;
import com.spire.pdf.actions.PdfSubmitAction;
import com.spire.pdf.fields.*;
import com.spire.pdf.graphics.*;
import com.spire.pdf.packages.sprcfn;

import java.awt.*;
import java.awt.geom.Point2D;
import java.awt.geom.Rectangle2D;

public class CreateFillableFormFields {

    public static void main(String[] args) throws Exception {

        //Create a PdfDocument object
        PdfDocument doc = new PdfDocument();

        //Add a page
        PdfPageBase page = doc.getPages().add();

        //Initialize x and y coordinates
        float baseX = 100;
        float baseY = 30;

        //Create two brush objects
        PdfSolidBrush brush1 = new PdfSolidBrush(new PdfRGBColor(Color.blue));
        PdfSolidBrush brush2 = new PdfSolidBrush(new PdfRGBColor(Color.black));

        //Create a font
        PdfFont font = new PdfFont(PdfFontFamily.Times_Roman, 12f, PdfFontStyle.Regular);

        //Add a textbox
        page.getCanvas().drawString("TextBox:", font, brush1, new Point2D.Float(10, baseY));
        Rectangle2D.Float tbxBounds = new Rectangle2D.Float(baseX, baseY, 150, 15);
        PdfTextBoxField textBox = new PdfTextBoxField(page, "textbox");
        textBox.setBounds(tbxBounds);
        textBox.setText("Hello World");
        textBox.setFont(font);
        doc.getForm().getFields().add(textBox);
        baseY += 25;

        //add two checkboxes
        page.getCanvas().drawString("CheckBox:", font, brush1, new Point2D.Float(10, baseY));
        Rectangle2D.Float checkboxBound1 = new Rectangle2D.Float(baseX, baseY, 15, 15);
        PdfCheckBoxField checkBoxField1 = new PdfCheckBoxField(page, "checkbox1");
        checkBoxField1.setBounds(checkboxBound1);
        checkBoxField1.setChecked(false);
        page.getCanvas().drawString("Option 1", font, brush2, new Point2D.Float(baseX + 20, baseY));

        Rectangle2D.Float checkboxBound2 = new Rectangle2D.Float(baseX + 70, baseY, 15, 15);
        PdfCheckBoxField checkBoxField2 = new PdfCheckBoxField(page, "checkbox2");
        checkBoxField2.setBounds(checkboxBound2);
        checkBoxField2.setChecked(false);
        page.getCanvas().drawString("Option 2", font, brush2, new Point2D.Float(baseX + 90, baseY));
        doc.getForm().getFields().add(checkBoxField1);
        doc.getForm().getFields().add(checkBoxField2);
        baseY += 25;

        //Add a listbox
        page.getCanvas().drawString("ListBox:", font, brush1, new Point2D.Float(10, baseY));
        Rectangle2D.Float listboxBound = new Rectangle2D.Float(baseX, baseY, 150, 50);
        PdfListBoxField listBoxField = new PdfListBoxField(page, "listbox");
        listBoxField.getItems().add(new PdfListFieldItem("Item 1", "item1"));
        listBoxField.getItems().add(new PdfListFieldItem("Item 2", "item2"));
        listBoxField.getItems().add(new PdfListFieldItem("Item 3", "item3")); ;
        listBoxField.setBounds(listboxBound);
        listBoxField.setFont(font);
        listBoxField.setSelectedIndex(0);
        doc.getForm().getFields().add(listBoxField);
        baseY += 60;

        //Add two radio buttons
        page.getCanvas().drawString("RadioButton:", font, brush1, new Point2D.Float(10, baseY));
        PdfRadioButtonListField radioButtonListField = new PdfRadioButtonListField(page, "radio");
        PdfRadioButtonListItem radioItem1 = new PdfRadioButtonListItem("option1");
        Rectangle2D.Float radioBound1 = new Rectangle2D.Float(baseX, baseY, 15, 15);
        radioItem1.setBounds(radioBound1);
        page.getCanvas().drawString("Option 1", font, brush2, new Point2D.Float(baseX + 20, baseY));

        PdfRadioButtonListItem radioItem2 = new PdfRadioButtonListItem("option2");
        Rectangle2D.Float radioBound2 = new Rectangle2D.Float(baseX + 70, baseY, 15, 15);
        radioItem2.setBounds(radioBound2);
        page.getCanvas().drawString("Option 2", font, brush2, new Point2D.Float(baseX + 90, baseY));
        radioButtonListField.getItems().add(radioItem1);
        radioButtonListField.getItems().add(radioItem2);
        radioButtonListField.setSelectedIndex(0);
        doc.getForm().getFields().add(radioButtonListField);
        baseY += 25;

        //Add a combobox
        page.getCanvas().drawString("ComboBox:", font, brush1, new Point2D.Float(10, baseY));
        Rectangle2D.Float cmbBounds = new Rectangle2D.Float(baseX, baseY, 150, 15);
        PdfComboBoxField comboBoxField = new PdfComboBoxField(page, "combobox");
        comboBoxField.setBounds(cmbBounds);
        comboBoxField.getItems().add(new PdfListFieldItem("Item 1", "item1"));
        comboBoxField.getItems().add(new PdfListFieldItem("Item 2", "itme2"));
        comboBoxField.getItems().add(new PdfListFieldItem("Item 3", "item3"));
        comboBoxField.getItems().add(new PdfListFieldItem("Item 4", "item4"));
        comboBoxField.setSelectedIndex(0);
        comboBoxField.setFont(font);
        doc.getForm().getFields().add(comboBoxField);
        baseY += 25;

        //Add a signature field
        page.getCanvas().drawString("Signature Field:", font, brush1, new Point2D.Float(10, baseY));
        PdfSignatureField sgnField = new PdfSignatureField(page, "sgnField");
        Rectangle2D.Float sgnBounds = new Rectangle2D.Float(baseX, baseY, 150, 80);
        sgnField.setBounds(sgnBounds);
        doc.getForm().getFields().add(sgnField);
        baseY += 90;

        //Add a button
        page.getCanvas().drawString("Button:", font, brush1, new Point2D.Float(10, baseY));
        Rectangle2D.Float btnBounds = new Rectangle2D.Float(baseX, baseY, 50, 15);
        PdfButtonField buttonField = new PdfButtonField(page, "button");
        buttonField.setBounds(btnBounds);
        buttonField.setText("Submit");
        buttonField.setFont(font);
        PdfSubmitAction submitAction = new PdfSubmitAction("https://www.e-iceblue.com/getformvalues.php");
        buttonField.getActions().setMouseDown(submitAction);
        doc.getForm().getFields().add(buttonField);

        //Save to file
        doc.saveToFile("FillableForm.pdf", FileFormat.PDF);
    }
}
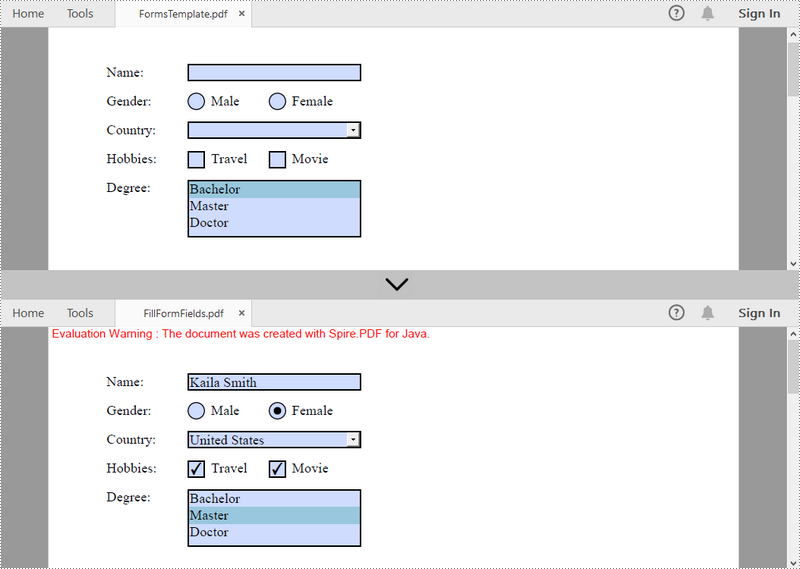
Fill Form Fields in an Existing PDF Document in Java
In order to fill out a form, we must first get all the form fields from the PDF document, determine the type of a certain field, and then input a value or select a value from a predefined list. The following are the steps to fill form fields in an existing PDF document using Spire.PDF for Java.
- Create a PdfDocument object.
- Load a sample PDF document using PdfDocument.loadFromFile() method.
- Get the form from the document through PdfDocument.getForm() method.
- Get the form field widget collection through PdfFormWidget.getFieldsWidget() method.
- Loop through the field widget collection to get a specific PdfField.
- Determine if the PdfField is a certain field type such as text box. If yes, set the text of the text box using PdfTextBoxFieldWidget.setText() method.
- Repeat the sixth step to fill radio button, check box, combo box, and list box with values.
- Save the document to a PDF file using PdfDocument.saveToFile() method.
- Java
import com.spire.pdf.FileFormat;
import com.spire.pdf.PdfDocument;
import com.spire.pdf.fields.PdfField;
import com.spire.pdf.widget.*;

public class FillFormFields {

    public static void main(String[] args) {

        //Create a PdfDocument object
        PdfDocument doc = new PdfDocument();

        //Load a template containing forms
        doc.loadFromFile("C:\\Users\\Administrator\\Desktop\\FormsTemplate.pdf");

        //Get the form from the document
        PdfFormWidget form = (PdfFormWidget)doc.getForm();

        //Get the form widget collection
        PdfFormFieldWidgetCollection formWidgetCollection = form.getFieldsWidget();

        //Loop through the widgets
        for (int i = 0; i < formWidgetCollection.getCount(); i++)
        {
            //Get a specific field
            PdfField field = formWidgetCollection.get(i);

            //Determine if the field is a text box
            if (field instanceof PdfTextBoxFieldWidget)
            {
                if (field.getName().equals("name"))
                {
                    //Set the text of text box
                    PdfTextBoxFieldWidget textBoxField = (PdfTextBoxFieldWidget)field;
                    textBoxField.setText("Kaila Smith");
                }
            }

            //Determine if the field is a radio button
            if (field instanceof PdfRadioButtonListFieldWidget)
            {
                if (field.getName().equals("gender"))
                {
                    //Set the selected index of radio button
                    PdfRadioButtonListFieldWidget radioButtonListField = (PdfRadioButtonListFieldWidget)field;
                    radioButtonListField.setSelectedIndex(1);
                }
            }

            //Determine if the field is a combo box
            if (field instanceof PdfComboBoxWidgetFieldWidget)
            {
                if (field.getName().equals("country"))
                {
                    //Set the selected index of combo box
                    PdfComboBoxWidgetFieldWidget comboBoxField = (PdfComboBoxWidgetFieldWidget)field;
                    comboBoxField.setSelectedIndex(0);
                }
            }

            //Determine if the field is a check box
            if (field instanceof PdfCheckBoxWidgetFieldWidget)
            {
                //Set the "Checked" status of check box
                PdfCheckBoxWidgetFieldWidget checkBoxField = (PdfCheckBoxWidgetFieldWidget)field;
                switch (checkBoxField.getName())
                {
                    case "travel":
                    case "movie":
                        checkBoxField.setChecked(true);
                        break;
                }
            }

            //Determine if the field is a list box
            if (field instanceof PdfListBoxWidgetFieldWidget)
            {
                if (field.getName().equals("degree"))
                {
                    //Set the selected index of list box
                    PdfListBoxWidgetFieldWidget listBox = (PdfListBoxWidgetFieldWidget)field;
                    listBox.setSelectedIndex(1);
                }
            }
        }

        //Save to file
        doc.saveToFile("FillFormFields.pdf", FileFormat.PDF);
    }
}
Delete a Particular Field or All Fields in an Existing PDF Document in Java
A form field in a PDF document can be accessed by its index or name and removed by PdfFieldCollection.remove() method. The following are the steps to remove a particular field or all fields from an existing PDF document using Sprie.PDF for Java.
- Create a PdfDocument object.
- Load a sample PDF document using PdfDocument.loadFromFile() method.
- Get the form from the document using PdfDocument.getForm() method.
- Get the form field widget collection using PdfFormWidget.getFieldsWidget() method.
- Loop through the widget collection to get a specific PdfField. Remove the field one by one using PdfFieldCollection.remove() method.
- To remove a certain form field, get it from the document using PdfFormFieldWidgetCollection.get() method and then call the PdfFieldCollection.remove() method.
- Save the document to a PDF file using PdfDocument.saveToFile() method.
- Java
import com.spire.pdf.PdfDocument;
import com.spire.pdf.fields.PdfField;
import com.spire.pdf.widget.PdfFormFieldWidgetCollection;
import com.spire.pdf.widget.PdfFormWidget;

public class DeleteFormFields {

    public static void main(String[] args) {

        //Create a PdfDocument object
        PdfDocument doc = new PdfDocument();

        //Load a PDF file
        doc.loadFromFile("C:\\Users\\Administrator\\Desktop\\FormsTemplate.pdf");

        //Get the form from the document
        PdfFormWidget form= (PdfFormWidget)doc.getForm();

        //Get form widgets from the form
         PdfFormFieldWidgetCollection widgets = form.getFieldsWidget();

        //Loop through the widgets
        for (int i = widgets.getCount() - 1; i >= 0; i--)
        {
            //Get a specific field
            PdfField field = (PdfField)widgets.getList().get(i) ;

            //Remove the field
            widgets.remove(field);
        }

        //Get a specific field by its name
        //PdfField field = widgets.get("name");
        //Remove the field
        //widgets.remove(field);

        //Save to file
        doc.saveToFile("DeleteAllFields.pdf");
    }
}
Apply for a Temporary License
If you'd like to remove the evaluation message from the generated documents, or to get rid of the function limitations, please request a 30-day trial license for yourself.
