
Knowledgebase (2370)
Children categories
Spire.Doc provides several overloaded Replace methods to replace text in different scenarios. This article is going to show you how to replace a specified text in a template document with another document using Spire.Doc.
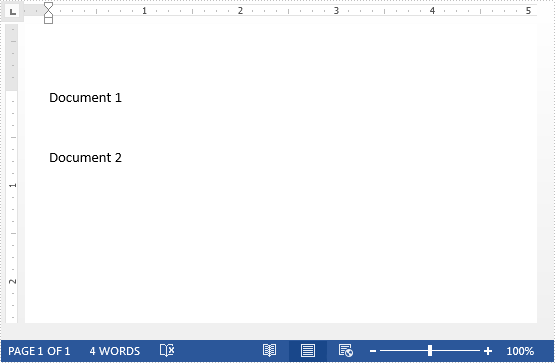
The template document:
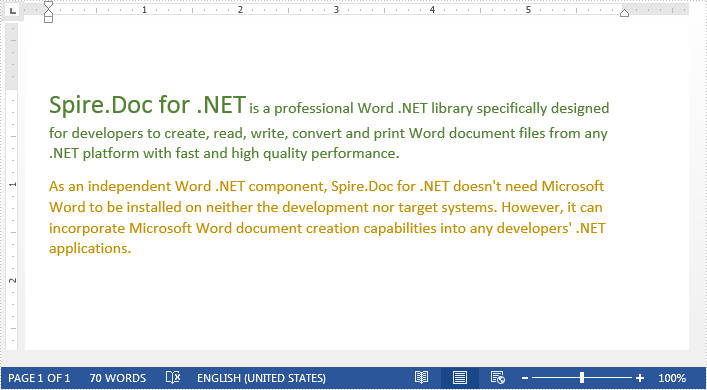
The document to replace text:
Detail steps:
Step 1: Load a template document.
Document document = new Document("Template.docx");
Step 2: Load another document to replace text.
IDocument replaceDocument = new Document("Document1.docx");
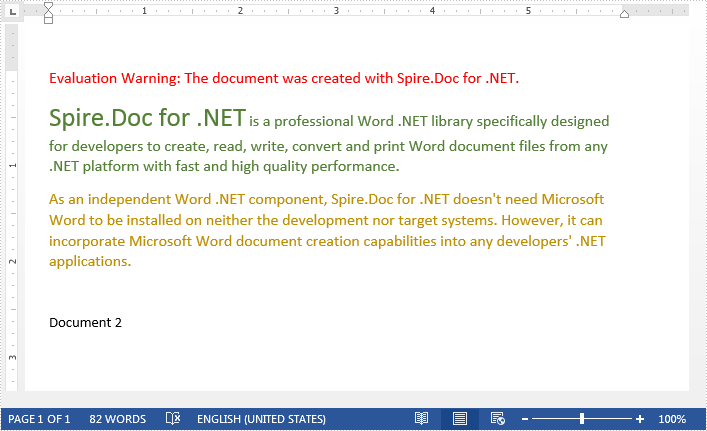
Step 3: Replace specified text with the other document.
document.Replace("Document 1", replaceDocument, false, true);
Step 4: Save the file.
document.SaveToFile("Output.docx", FileFormat.Docx2013);
Output:
Full code:
using Spire.Doc;
using Spire.Doc.Interface;

namespace Replace_Text_With_Document
{
    class Program
    {
        static void Main(string[] args)
        {
            //Load a template document
            Document document = new Document("Template.docx");

            //Load another document to replace text
            IDocument replaceDocument = new Document("Document1.docx");

            //Replace specified text with the other document
            document.Replace("Document 1", replaceDocument, false, true);

            //Save the file
            document.SaveToFile("Output.docx", FileFormat.Docx2013);
        }
    }
}
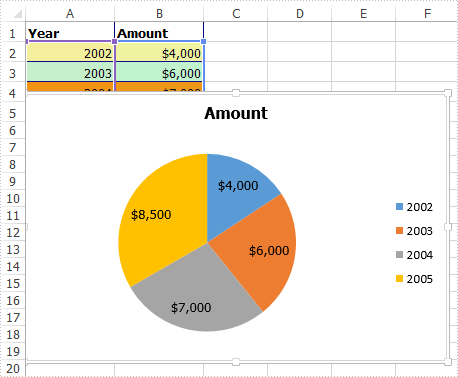
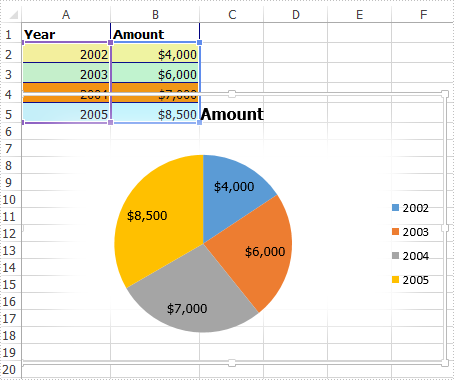
This article elaborates the steps to apply soft edges effect to an excel chart using Spire.XLS.
The example Excel file we used for demonstration:
Detail steps:
Step 1: Instantiate a Workbook object and load the excel file.
Workbook workbook = new Workbook();
workbook.LoadFromFile("Input.xlsx");
Step 2: Get the first worksheet.
Worksheet sheet = workbook.Worksheets[0];
Step 3: Get the chart.
IChart chart = sheet.Charts[0];
Step 4: Specify the size of the soft edge. Value can be set from 0 to 100.
chart.ChartArea.Shadow.SoftEdge = 10;
Step 5: Save the file.
workbook.SaveToFile("Output.xlsx", ExcelVersion.Version2013);
Output:
Full code:
using Spire.Xls;
using Spire.Xls.Core;

namespace Soft_Edges_in_Excel_Chart
{
    class Program
    {
        static void Main(string[] args)
        {
            //Instantiate a Workbook object
            Workbook workbook = new Workbook();
            //Load the Excel file
            workbook.LoadFromFile("Input.xlsx");

            //Get the first worksheet
            Worksheet sheet = workbook.Worksheets[0];

            //Get the chart
            IChart chart = sheet.Charts[0];

            //Specify the size of the soft edge. Value can be set from 0 to 100
            chart.ChartArea.Shadow.SoftEdge = 10;

            //Save the file
            workbook.SaveToFile("Output.xlsx", ExcelVersion.Version2013);
        }
    }
}
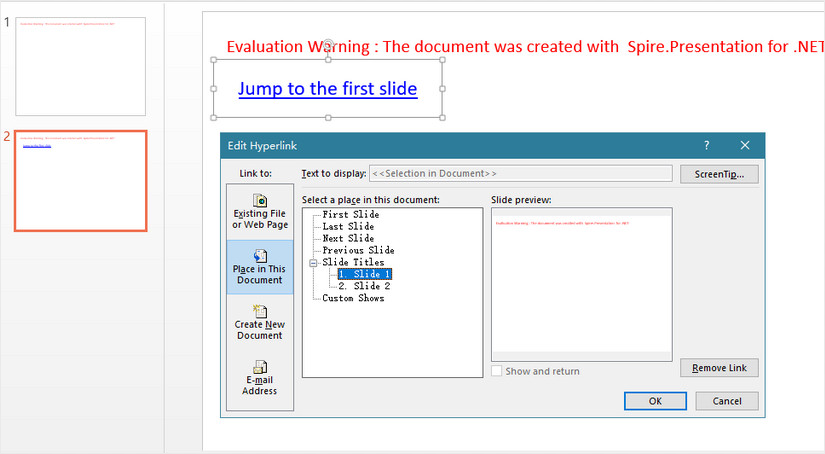
Hyperlinks in a PowerPoint file not only can be linked to external URLs, but also to the specific slide within the document. This article will show you how to create a hyperlink that links to a specified slide using Spire.Presentation.
Step 1: Create a PowerPoint file and append a slide to it.
Presentation presentation = new Presentation();
presentation.Slides.Append();
Step 2: Add a shape to the second slide.
IAutoShape shape = presentation.Slides[1].Shapes.AppendShape(ShapeType.Rectangle, new RectangleF(10, 50, 200, 50));
shape.TextFrame.Text = "Jump to the first slide";
Step 3: Create a hyperlink based on the shape and the text on it, linking to the first slide .
ClickHyperlink hyperlink = new ClickHyperlink(presentation.Slides[0]);
shape.Click = hyperlink;
shape.TextFrame.TextRange.ClickAction = hyperlink;
Step 4: Save the file.
presentation.SaveToFile("hyperlink.pptx", FileFormat.Pptx2010);
Output:
Full Code:
using Spire.Presentation;
using Spire.Presentation.Drawing;
using System.Drawing;
namespace Link_to_a_Specific_Slide
{

    class Program
    {

        static void Main(string[] args)
        {
            Presentation presentation = new Presentation();
            presentation.Slides.Append();
            IAutoShape shape = presentation.Slides[1].Shapes.AppendShape(ShapeType.Rectangle, new RectangleF(10, 50, 200, 50));
            shape.Fill.FillType = FillFormatType.None;
            shape.Line.FillType = FillFormatType.None;
            shape.TextFrame.Text = "Jump to the first slide";
            ClickHyperlink hyperlink = new ClickHyperlink(presentation.Slides[0]);
            shape.Click = hyperlink;
            shape.TextFrame.TextRange.ClickAction = hyperlink;
            presentation.SaveToFile("output.pptx", FileFormat.Pptx2010);


        }
    }
}
Imports Spire.Presentation
Imports Spire.Presentation.Drawing
Imports System.Drawing
Namespace Link_to_a_Specific_Slide

	Class Program

		Private Shared Sub Main(args As String())
			Dim presentation As New Presentation()
			presentation.Slides.Append()
			Dim shape As IAutoShape = presentation.Slides(1).Shapes.AppendShape(ShapeType.Rectangle, New RectangleF(10, 50, 200, 50))
			shape.Fill.FillType = FillFormatType.None
			shape.Line.FillType = FillFormatType.None
			shape.TextFrame.Text = "Jump to the first slide"
			Dim hyperlink As New ClickHyperlink(presentation.Slides(0))
			shape.Click = hyperlink
			shape.TextFrame.TextRange.ClickAction = hyperlink
			presentation.SaveToFile("output.pptx", FileFormat.Pptx2010)


		End Sub
	End Class
End Namespace
