
Knowledgebase (2370)
Children categories
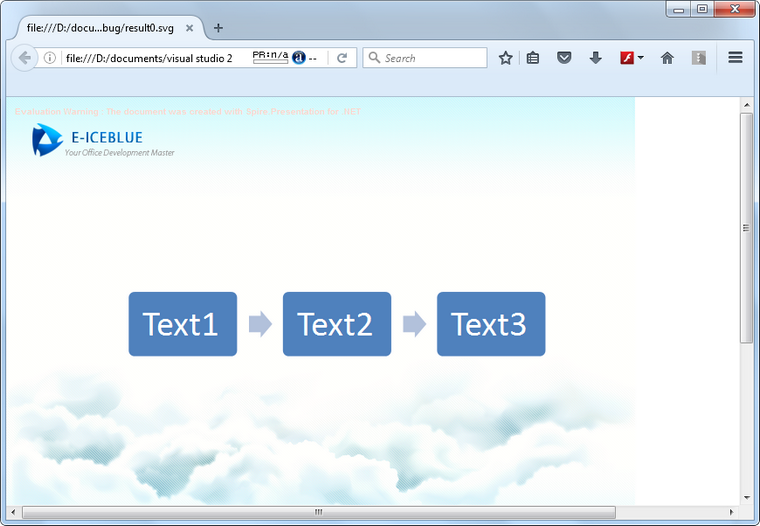
How to Convert PowerPoint Document to SVG Images in C#, VB.NET
2016-10-24 08:38:01 Written by KoohjiSVG, short for scalable vector graphics, is a XML-based file format used to depict two-dimensional vector graphics. As SVG images are defined in XML text lines, they can be easily searched, indexed, scripted, and supported by most of the up to date web browsers. Therefore, office documents are often converted to SGV images for high fidelity viewing. Following sections will introduce how to convert PowerPoint documents to SVG images using Spire.Presentation in C# and VB.NET.
Code Snippet:
Step 1: Initialize an instance of Presentation class and load a sample PowerPoint document to it.
Presentation ppt = new Presentation();
ppt.LoadFromFile(@"C:\Users\Administrator\Desktop\sample.pptx");
Step 2: Convert PowerPoint document to byte array and store in a Queue object.
Queue<Byte[]> svgBytes = ppt.SaveToSVG();
Step 3: Initialize an instance of the FileStream class with the specified file path and creation mode. Dequeue the data in the Queue object and write to the stream.
int len = svgBytes.Count;
for (int i = 0; i < len; i++)
{
    FileStream fs = new FileStream(string.Format("result" + "{0}.svg", i), FileMode.Create);
    byte[] bytes = svgBytes.Dequeue();
    fs.Write(bytes, 0, bytes.Length);
}
Output:
Full Code:
using Spire.Presentation;
using System;
using System.Collections.Generic;
using System.IO;
namespace PPTtoSVG
{
    class Program
    {
        static void Main(string[] args)
        {
            Presentation ppt = new Presentation();
            ppt.LoadFromFile(@"C:\Users\Administrator\Desktop\sample.pptx");
            Queue<byte[]> svgBytes = ppt.SaveToSVG();
            int len = svgBytes.Count;
            for (int i = 0; i < len; i++)
            {
                FileStream fs = new FileStream(string.Format("result" + "{0}.svg", i), FileMode.Create);
                byte[] bytes = svgBytes.Dequeue();
                fs.Write(bytes, 0, bytes.Length);
                ppt.Dispose();
            }
        }
    }
}
Imports Spire.Presentation
Imports System.Collections.Generic
Imports System.IO
Namespace PPTtoSVG
	Class Program
		Private Shared Sub Main(args As String())
			Dim ppt As New Presentation()
			ppt.LoadFromFile("C:\Users\Administrator\Desktop\sample.pptx")
			Dim svgBytes As Queue(Of [Byte]()) = ppt.SaveToSVG()
			Dim len As Integer = svgBytes.Count
			For i As Integer = 0 To len - 1
				Dim fs As New FileStream(String.Format("result" + "{0}.svg", i), FileMode.Create)
				Dim bytes As Byte() = svgBytes.Dequeue()
				fs.Write(bytes, 0, bytes.Length)
				ppt.Dispose()
			Next
		End Sub
	End Class
End Namespace
SVG, short for Scalable Vector Graphics, is a web-friendly vector image format. SVG has many advantages over other image formats. One of the most significant advantages is resolution independence, which means you can resize SVG images as needed without losing image quality. Sometimes, you may need to convert Excel files to SVG for web viewing. This article will demonstrate how to programmatically convert Excel to SVG in C# and VB.NET using Spire.XLS for .NET.
Install Spire.XLS for .NET
To begin with, you need to add the DLL files included in the Spire.XLS for .NET package as references in your .NET project. The DLL files can be either downloaded from this link or installed via NuGet.
PM> Install-Package Spire.XLS
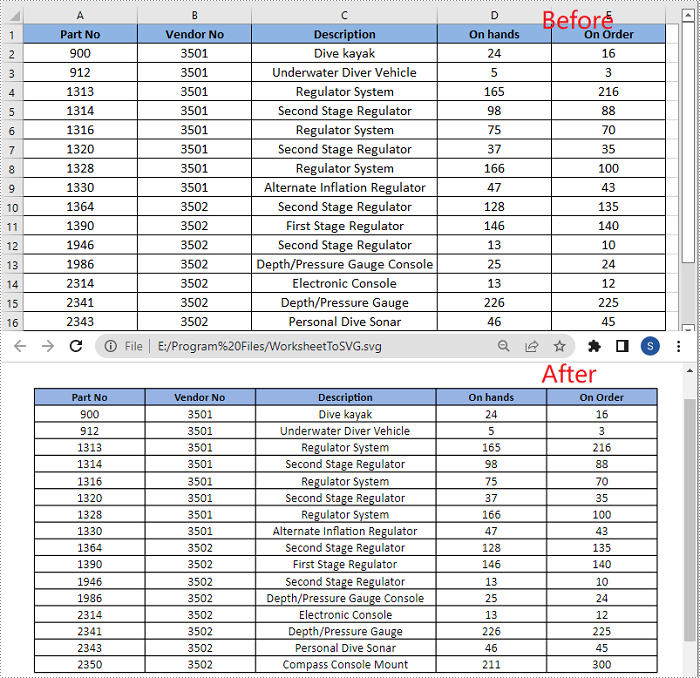
Convert an Excel Worksheet to SVG using C# and VB.NET
Spire.XLS provides the Worksheet.SaveToSVGStream() method to convert an Excel worksheet to SVG. The detailed steps are as follows:
- Initialize an instance of the Workbook class.
- Load an Excel file using Workbook.LoadFromFile() method.
- Get a specific worksheet by its index through Workbook.Worksheets[int] property.
- Initialize an instance of the FileStream class.
- Save the worksheet to SVG using Worksheet.ToSVGStream(Stream, int, int, int, int) method.
- C#
- VB.NET
using Spire.Xls;
using System.IO;

namespace ConvertWorksheetToSVG
{
    class Program
    {
        static void Main(string[] args)
        {
            //Create an instance of Workbook class
            Workbook workbook = new Workbook();
            //Load an Excel file
            workbook.LoadFromFile("Sample1.xlsx");

            //Get the first worksheet
            Worksheet sheet = workbook.Worksheets[0];

            //Create an instance of FileStream class
            FileStream fs = new FileStream("E:\\Program Files\\WorksheetToSVG.svg", FileMode.Create);
            //Save the worksheet to SVG
            sheet.ToSVGStream(fs, 0, 0, 0, 0);
            fs.Flush();
            fs.Close();
        }
    }
}
Convert an Excel Chart Sheet to SVG using C# and VB.NET
A chart sheet is a worksheet that only contains a chart. Spire.XLS allows you to convert a chart sheet to SVG by using the ChartSheet.ToSVGStream() method. The detailed steps are as follows:
- Initialize an instance of the Workbook class.
- Load an Excel file using Workbook.LoadFromFile() method.
- Get a specific chart sheet by its index through Workbook.Chartsheets[int] property.
- Initialize an instance of the FileStream class.
- Save the chart sheet to SVG using ChartSheet.ToSVGStream(Stream) method.
- C#
- VB.NET
using Spire.Xls;
using System.IO;

namespace ConvertChartSheetToSVG
{
    class Program
    {
        static void Main(string[] args)
        {
            //Create an instance of Workbook class
            Workbook workbook = new Workbook();
            //Load an Excel file
            workbook.LoadFromFile("Sample2.xlsx");

            //Get the first chart sheet
            ChartSheet chartSheet = workbook.Chartsheets[0];

            //Create an instance of FileStream class
            FileStream fs = new FileStream("E:\\ProgramFiles\\ChartSheetToSVG.svg", FileMode.Create);
            //Save the chart sheet to SVG
            chartSheet.ToSVGStream(fs);
            fs.Flush();
            fs.Close();
        }
    }
}

Apply for a Temporary License
If you'd like to remove the evaluation message from the generated documents, or to get rid of the function limitations, please request a 30-day trial license for yourself.
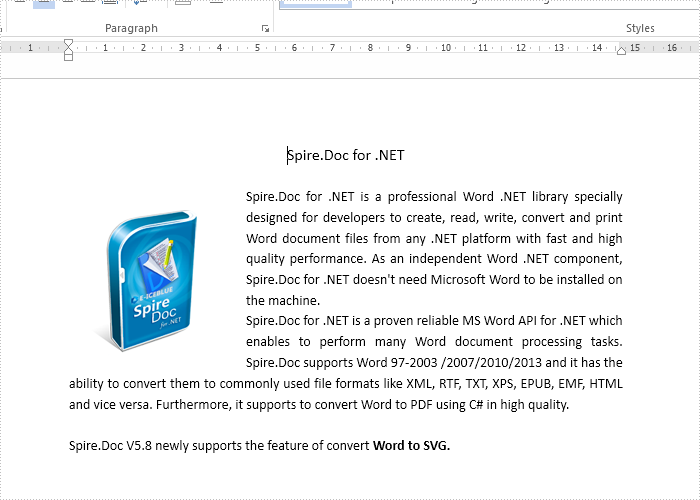
SVG (Scalable Vector Graphics) is an image file format and it has the advantage of be edited and indexed easily. It is widely used for interactivity and animation. Starts from Spire.Doc V5.8, Spire.Doc offers a method doc.SaveToFile() to enable developers to save the word document to SVG file format in C# easily. This article will focus on demonstrate how to convert word document to SVG with the help of Spire.Doc by using a simple line of code in C#.
Firstly, please view the original word document:
Step 1: Create a C# project in visual studio, then add a reference to Spire.Doc.dll and use the following namespace.
using Spire.Doc;
Step 2: Create a word instance and load the source word document from file.
Document doc = new Document();
doc.LoadFromFile("Sample.docx");
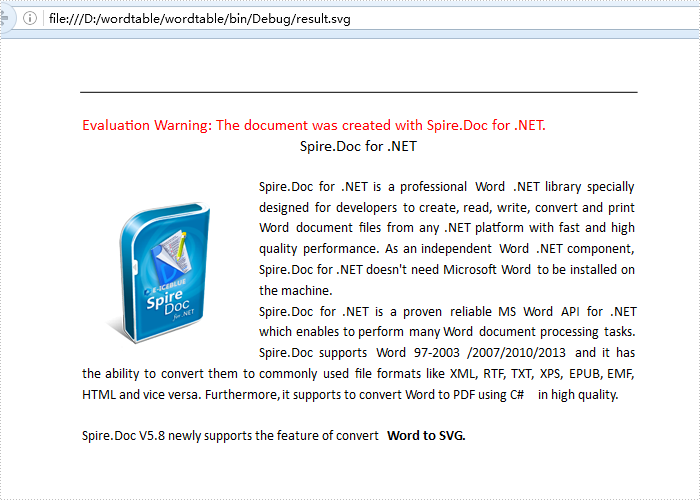
Step 3: Save the document to SVG file.
doc.SaveToFile("result.svg", FileFormat.SVG);
After running the code, we'll get the effective screenshot of the following result SVG file from word document:
Full codes:
using Spire.Doc;

namespace wordconversion.Case
{
    class WordtoSVG
    {

         public WordtoSVG()
         {
        Document doc = new Document();
        doc.LoadFromFile("Sample.docx");

        doc.SaveToFile("result.svg", FileFormat.SVG);
         }

    }
}
