
Knowledgebase (2370)
Children categories
In today's data-driven world, efficiently transferring data into Excel is essential. Python's versatile ecosystem automates the process, eliminating manual entry, reducing errors, and handling large datasets beyond Excel's limits. Whether pulling data from APIs, databases, or unstructured sources, Python creates dynamic workflows that ensure consistency and scalability. Its compatibility with various data formats transforms raw data into structured Excel files, bridging complex data pipelines with user-friendly outputs while boosting productivity and enabling professionals to focus on high-value analysis. This article will demonstrate how to use Spire.XLS for Python to import data into Excel workbooks within Python applications.
- How to Write Data into Excel Files with Spire.XLS for Python
- Import CSV Data into Excel Worksheets
- Transfer Data and Worksheets Between Excel Files
- Import JSON Data into Excel Worksheets
- Import XML Data into Excel Worksheets
- Import Database Records into Excel Worksheets
- Import HTML Table Data into Excel Worksheets
Install Spire.XLS for Python
This scenario requires Spire.XLS for Python and plum-dispatch v1.7.4. They can be easily installed in your Windows through the following pip command.
pip install Spire.XLS
If you are unsure how to install, please refer to: How to Install Spire.XLS for Python on Windows
How to Write Data into Excel Files with Spire.XLS for Python
Spire.XLS for Python is an Excel file processing library that supports reading, editing, and writing Excel files. With this library, you can effortlessly write data into Excel worksheets, apply formatting, and save the workbook as a file.
Before writing data into Excel worksheets, Python provides a variety of built-in and third-party libraries-such as json, xml.etree.ElementTree, and BeautifulSoup-that allow you to read and process data from different file formats, including TXT, CSV, JSON, XML, and HTML. These libraries help transform raw or semi-structured data into lists, dictionaries, or dataframes that are easy to work with in Python.
Once the data is extracted and structured, Spire.XLS for Python can be used to write it into Excel workbooks. The library offers precise control over worksheet creation, cell-level data entry, formatting, and file export in Excel-compatible formats.
Steps to Write Data into Excel Using Spire.XLS for Python:
- Initialize a Workbook
Create an instance of the Workbook class to generate a new Excel workbook with three default worksheets, or use the Workbook.LoadFromFile(filePath: str) method to load an existing Excel file. - Create or Clear Worksheets
Use the Workbook.Worksheets.get_Item() method to get worksheets, or the Workbook.Worksheets.Add(sheetName: str) method to add worksheets. - Prepare the Data
Use Python libraries such as json, csv, or xml.etree.ElementTree to extract and organize your data into row and column structures. - Write Headers and Data
Iterate through your data and use the Worksheet.Range.get_Item(row: int, col: int).Value property to assign values to specific cells. - Format the Worksheet (Optional)
Apply styles using the CellRange.ApplyStyle() method, autofit columns using the Worksheet.AutoFitColumn() method, and set borders or colors to improve the appearance and readability of the worksheet. - Save the Workbook
Save the final Excel file using the Workbook.SaveToFile(filePath: str, format: FileFormat) method in your preferred Excel version.
Import CSV Data into Excel Worksheets
Importing data from CSV files into Excel is a fundamental task in data preparation. With Spire.XLS for Python, you can easily load structured data from CSV files using the Workbook.LoadFromFile(filePath: str, separator: str) method of the Workbook class and convert it into a well-formatted Excel workbook. In fact, data from text files can be imported in the same way. This method supports custom cell styling, header addition, and ensures the data is clean and ready for analysis or reporting.
Steps to import CSV data into Excel workbooks:
- Create an instance of the Workbook class.
- Load the CSV table data using the Workbook.LoadFromFile(filePath: str, separator: str) method and specify the file path and the column separator (e.g., comma or tab).
- Access the first worksheet using the Workbook.Worksheets.get_Item(index: int) method.
- Optionally, read the table from the first worksheet and write it into another using the Worksheet.Range.get_Item(row: int, col: int).Value property of the Worksheet class.
- Format the worksheet as needed and save the result using the Workbook.SaveToFile(filePath: str, fileFormat) method.
- Python
from spire.xls import Workbook, FileFormat, BuiltInStyles

# Create a Workbook object
workbook = Workbook()

# Load the table from the CSV or text file
workbook.LoadFromFile("Sample.csv", ",")
# workbook.LoadFromFile("Sample.txt", "\t")

# Get the first worksheet
sheet = workbook.Worksheets.get_Item(0)
# Format the table
sheet.Rows.get_Item(0).BuiltInStyle = BuiltInStyles.Heading4
for i in range(1, sheet.Rows.Count):
    sheet.Rows.get_Item(i).BuiltInStyle = BuiltInStyles.Accent4_20
for j in range(sheet.Columns.Count):
    sheet.AutoFitColumn(j + 1)

# Save the workbook
workbook.SaveToFile("output/TextCSVToExcel.xlsx", FileFormat.Version2016)
workbook.Dispose()

Transfer Data and Worksheets Between Excel Files
Working with multiple Excel files often requires copying data or entire worksheets from one workbook to another. With Spire.XLS for Python, you can perform these operations programmatically using the Workbook and Worksheet classes, allowing you to preserve formatting, formulas, and data structure when consolidating or merging information from different sources.
Steps to copy data and worksheets between Excel workbooks:
- Create a new instance of the Workbook class and load the source Excel file using the Workbook.LoadFromFile(filePath: str) method.
- Create another Workbook instance and clear the default worksheets using the Workbook.Worksheets.Clear() method.
- To copy data only:
- Iterate through worksheets in the source workbook and create new worksheets in the destination using the Workbook.Worksheets.Add(sheetName: str) method.
- Use the Worksheet.Range.get_Item(row, col).Value property to read from the source worksheet and write into the destination worksheet.
- To copy entire worksheets:
- Use the Worksheet.CopyFrom(sourceWorksheet) method to duplicate the content of each source worksheet into a new worksheet.
- Save the new workbook using the Workbook.SaveToFile(filePath: str, ileFormat: FileFormat) method.
- Python
from spire.xls import Workbook, FileFormat

# Create a Workbook object and load an Excel file
workbook = Workbook()
workbook.LoadFromFile("Sample.xlsx")

# Create another Workbook object and load an Excel file
newWorkbook = Workbook()
newWorkbook.Worksheets.Clear()

# Read data from one workbook and insert it into another
for i in range(workbook.Worksheets.get_Item(0).Rows.Count):
    for j in range(workbook.Worksheets.get_Item(0).Columns.Count):
        # Add a new worksheet
        sheet = newWorkbook.Worksheets.Add(workbook.Worksheets.get_Item(0).Name)
        # Write data
        sheet.Range.get_Item(i + 1, j + 1).Value = workbook.Worksheets.get_Item(0).Range.get_Item(i + 1, j + 1).Value

# Copy worksheets from the first workbook to the second workbook
for i in range(workbook.Worksheets.Count):
    # Add a new worksheet
    newSheet = newWorkbook.Worksheets.Add(workbook.Worksheets.get_Item(i).Name + "-Copy")
    # Copy all contents to the new worksheet
    newSheet.CopyFrom(workbook.Worksheets.get_Item(i))

# Save the workbook
newWorkbook.SaveToFile("output/ExcelToExcel.xlsx", FileFormat.Version2016)
workbook.Dispose()
newWorkbook.Dispose()

Import JSON Data into Excel Worksheets
JSON (JavaScript Object Notation) is a popular format for structured data, commonly used in APIs and modern web applications. With Python's built-in json module, you can easily parse JSON files and extract table-like data. This data can then be written into an Excel worksheet using Spire.XLS for Python, which allows you to format, edit, and organize the content for easier analysis, visualization, or sharing.
A code example demonstrates how to import JSON data into Excel files:
- Python
from spire.xls import Workbook, FileFormat, BuiltInStyles
import json

# Load JSON data
with open("Sample.json", "r", encoding="utf-8") as f:
    jsonData = json.load(f)
headers = list(jsonData[0].keys())
rows = [[str(item[key]) for key in headers] for item in jsonData]

# Create a Workbook instance
workbook = Workbook()
# Clear the default worksheets and add new one
workbook.Worksheets.Clear()
sheet = workbook.Worksheets.Add("JSON Data")

# Write headers and rows into the new worksheet
for col, header in enumerate(headers):
    sheet.Range[1, col + 1].Value = header
for row_idx, row_data in enumerate(rows):
    for col_idx, value in enumerate(row_data):
        sheet.Range[row_idx + 2, col_idx + 1].Value = value

# Apply styles and auto-fit columns
sheet.Rows[0].BuiltInStyle = BuiltInStyles.Heading2
for row in range(1, sheet.Rows.Count):
    sheet.Rows[row].BuiltInStyle = BuiltInStyles.Accent2_40
for col in range(sheet.Columns.Count):
    sheet.AutoFitColumn(col + 1)

# Save Excel file
workbook.SaveToFile("output/JSONToExcel.xlsx", FileFormat.Version2016)
workbook.Dispose()

Import XML Data into Excel Worksheets
XML is a widely used format for representing hierarchical data in enterprise systems and data feeds. With Python's xml.etree.ElementTree module, you can navigate and extract the desired elements and attributes. Once the data is retrieved, Spire.XLS for Python allows you to write the data into Excel worksheets, mapping the hierarchical structure into rows and columns. This makes it easier to present, filter, and analyze complex XML content in a tabular format.
The following example shows how to extract XML data and write it into an Excel worksheet with Spire.XLS for Python:
- Python
from spire.xls import Workbook, FileFormat, BuiltInStyles
import xml.etree.ElementTree as ET

# Load XML data
tree = ET.parse("Sample.xml")
root = tree.getroot()
first_order = root.find("order")
headers = [elem.tag.replace('_', ' ').title() for elem in first_order]

rows = [
    [order.find(tag.lower().replace(" ", "_")).text or "" for tag in headers]
    for order in root.findall("order")
]

# Use Spire.XLS for Python to create and write to workbook
workbook = Workbook()
workbook.Worksheets.Clear()
sheet = workbook.Worksheets.Add("XML Data")

# Write headers and rows
for col, header in enumerate(headers):
    sheet.Range[1, col + 1].Value = header

for row_idx, row_data in enumerate(rows):
    for col_idx, value in enumerate(row_data):
        sheet.Range[row_idx + 2, col_idx + 1].Value = value

# Apply styles and auto-fit columns
sheet.Rows[0].BuiltInStyle = BuiltInStyles.Heading4
for row in range(1, sheet.Rows.Count):
    sheet.Rows[row].BuiltInStyle = BuiltInStyles.Accent4_40
for col in range(sheet.Columns.Count):
    sheet.AutoFitColumn(col + 1)

# Save Excel file
workbook.SaveToFile("output/XMLToExcel.xlsx", FileFormat.Version2016)
workbook.Dispose()

Import Database Records into Excel Worksheets
Importing database records into Excel is a common requirement in reporting and business intelligence. You can use database connector libraries in Python, such as sqlite3, pyodbc, or pymysql, to establish connections with various relational databases and retrieve records via SQL queries.
Once data is fetched from the database, it can be written into Excel using the Workbook class and the Worksheet.Range.get_Item().Value property in Spire.XLS. This enables you to convert relational datasets into readable and portable Excel workbooks that are ideal for reports, dashboards, and archival.
An example demonstrates how to fetch rows from a SQLite database and populate an Excel worksheet:
- Python
import sqlite3
from spire.xls import Workbook, FileFormat, BuiltInStyles

# Connect to the SQLite database
conn = sqlite3.connect("Sample.db")
cursor = conn.cursor()

# Get all table names in the database
cursor.execute("SELECT name FROM sqlite_master WHERE type='table';")
tables = [row[0] for row in cursor.fetchall()]

# Create an Excel workbook
workbook = Workbook()
workbook.Worksheets.Clear()  # Clear the default worksheets

# Loop through each table and export to a worksheet
for table_name in tables:
    # Fetch all data from the table
    cursor.execute(f"SELECT * FROM {table_name}")
    rows = cursor.fetchall()
    # Get column names
    column_names = [desc[0] for desc in cursor.description]
    # Add a new worksheet with the table name
    sheet = workbook.Worksheets.Add(table_name)

    # Write header row
    for col_index, column_name in enumerate(column_names):
        cell = sheet.Range.get_Item(1, col_index + 1)
        cell.Value = str(column_name)

    # Write data rows
    for row_index, row in enumerate(rows, start=2):
        for col_index, value in enumerate(row):
            sheet.Range.get_Item(row_index, col_index + 1).Value = str(value)

    # Apply styles
    sheet.Rows.get_Item(0).BuiltInStyle = BuiltInStyles.Heading4
    for i in range(1, sheet.Rows.Count):
        sheet.Rows.get_Item(i).BuiltInStyle = BuiltInStyles.Accent4_20
    for j in range(sheet.Columns.Count):
        sheet.AutoFitColumn(j + 1)

# Close the database connection
conn.close()

# Save the Excel file
workbook.SaveToFile("output/SQDBToExcel.xlsx", FileFormat.Version2016)
workbook.Dispose()

Import HTML Table Data into Excel Worksheets
Many web pages display data in HTML table format. By using the BeautifulSoup library in Python, you can scrape table data from web content and convert it into structured data. This data can then be written into Excel worksheets using the Spire.XLS for Python library.
With optional styling and formatting capabilities, you can preserve the tabular structure and create professional-looking reports from online sources such as stock data, weather updates, or product listings.
A code example demonstrates how to extract table data from HTML and write it into Excel worksheets:
- Python
from bs4 import BeautifulSoup
from spire.xls import Workbook, FileFormat, BuiltInStyles

# Read HTML file
with open("Sample.html", "r", encoding="utf-8") as f:
    soup = BeautifulSoup(f, "html.parser")

# Find the table
table = soup.find("table")
rows = table.find_all("tr")

# Extract data from table as a 2D list
data = []
for row in rows:
    cells = row.find_all(["th", "td"])
    data.append([cell.get_text(strip=True) for cell in cells])

# Create a new Excel workbook
workbook = Workbook()
# Get the first worksheet
sheet = workbook.Worksheets.get_Item(0)

# Iterate through the data
for row_index, row in enumerate(data, start=1):
    for col_index, cell_value in enumerate(row, start=1):
        # Write the table data to the cells in the worksheet
        sheet.Range.get_Item(row_index, col_index).Value = str(cell_value)

# Format the table
sheet.Rows.get_Item(0).BuiltInStyle = BuiltInStyles.Heading4
for i in range(1, sheet.Rows.Count):
    sheet.Rows.get_Item(i).BuiltInStyle = BuiltInStyles.Accent4_20
for j in range(sheet.Columns.Count):
    sheet.AutoFitColumn(j + 1)

# Save the Excel file
workbook.SaveToFile("output/HTMLToExcel.xlsx", FileFormat.Version2016)
workbook.Dispose()

Get a Free License
To fully experience the capabilities of Spire.XLS for Python without any evaluation limitations, you can request a free 30-day trial license.
A Slicer in Excel is an interactive filtering tool that simplifies data analysis in pivot tables and tables. Unlike traditional dropdown menus, slicers present intuitive, clickable buttons, each representing a distinct value in the dataset (e.g., regions, product categories, or dates). With slicers, users can filter datasets to focus on specific subsets with just a single click, making analysis faster and more visually intuitive. In this guide, we will explore how to create new slicers, update existing slicers, and remove slicers in Excel using Java and the Spire.XLS for Java library.
- Add Slicers to Tables in Excel
- Add Slicers to Pivot Tables in Excel
- Update Slicers in Excel
- Remove Slicers from Excel
Install Spire.XLS for Java
First of all, you're required to add the Spire.Xls.jar file as a dependency in your Java program. The JAR file can be downloaded from this link. If you use Maven, you can easily import the JAR file in your application by adding the following code to your project's pom.xml file.
<repositories>
    <repository>
        <id>com.e-iceblue</id>
        <name>e-iceblue</name>
        <url>https://repo.e-iceblue.com/nexus/content/groups/public/</url>
    </repository>
</repositories>
<dependencies>
    <dependency>
        <groupId>e-iceblue</groupId>
        <artifactId>spire.xls</artifactId>
        <version>16.6.5</version>
    </dependency>
</dependencies>
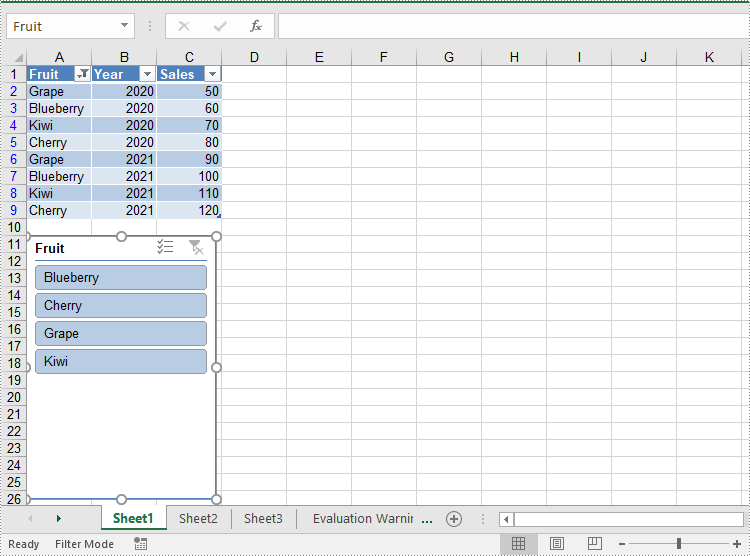
Add Slicers to Tables in Excel
Spire.XLS for Java provides the Worksheet.getSlicers().add(IListObject table, String destCellName, int index) method to add a slicer to a table in an Excel worksheet. The detailed steps are as follows.
- Create an object of the Workbook class.
- Get the first worksheet using the Workbook.getWorksheets.get(0) method.
- Add data to the worksheet using the Worksheet.getRange().get().setValue() and Worksheet.getRange().get().setNumberValue() methods.
- Add a table to the worksheet using the Worksheet.getIListObjects().create() method.
- Add a slicer to the table using the Worksheeet.getSlicers().add(IListObject table, String destCellName, int index) method.
- Save the resulting file using the Workbook.saveToFile() method.
- Java
import com.spire.xls.*;
import com.spire.xls.core.IListObject;
import com.spire.xls.core.spreadsheet.slicer.*;

public class AddSlicerToTable {
    public static void main(String[] args) {
        // Create an object of the Workbook class
        Workbook workbook = new Workbook();

        // Get the first worksheet
        Worksheet worksheet = workbook.getWorksheets().get(0);

        // Add data to the worksheet
        worksheet.getRange().get("A1").setValue("Fruit");
        worksheet.getRange().get("A2").setValue("Grape");
        worksheet.getRange().get("A3").setValue("Blueberry");
        worksheet.getRange().get("A4").setValue("Kiwi");
        worksheet.getRange().get("A5").setValue("Cherry");
        worksheet.getRange().get("A6").setValue("Grape");
        worksheet.getRange().get("A7").setValue("Blueberry");
        worksheet.getRange().get("A8").setValue("Kiwi");
        worksheet.getRange().get("A9").setValue("Cherry");

        worksheet.getRange().get("B1").setValue("Year");
        worksheet.getRange().get("B2").setNumberValue(2020);
        worksheet.getRange().get("B3").setNumberValue(2020);
        worksheet.getRange().get("B4").setNumberValue(2020);
        worksheet.getRange().get("B5").setNumberValue(2020);
        worksheet.getRange().get("B6").setNumberValue(2021);
        worksheet.getRange().get("B7").setNumberValue(2021);
        worksheet.getRange().get("B8").setNumberValue(2021);
        worksheet.getRange().get("B9").setNumberValue(2021);

        worksheet.getRange().get("C1").setValue("Sales");
        worksheet.getRange().get("C2").setNumberValue(50);
        worksheet.getRange().get("C3").setNumberValue(60);
        worksheet.getRange().get("C4").setNumberValue(70);
        worksheet.getRange().get("C5").setNumberValue(80);
        worksheet.getRange().get("C6").setNumberValue(90);
        worksheet.getRange().get("C7").setNumberValue(100);
        worksheet.getRange().get("C8").setNumberValue(110);
        worksheet.getRange().get("C9").setNumberValue(120);

        // Create a table from the specific data range
        IListObject table = worksheet.getListObjects().create("Fruit Sales", worksheet.getRange().get("A1:C9"));

        // Add a slicer to cell "A11" to filter the data based on the first column of the table
        XlsSlicerCollection slicers = worksheet.getSlicers();
        int index = slicers.add(table, "A11", 0);

        // Set name and style for the slicer
        XlsSlicer slicer = slicers.get(index);
        slicer.setName("Fruit");
        slicer.setStyleType(SlicerStyleType.SlicerStyleLight1);

        // Save the resulting file
        workbook.saveToFile("AddSlicerToTable.xlsx", ExcelVersion.Version2013);
        workbook.dispose();
    }
}
Add Slicers to Pivot Tables in Excel
Spire.XLS for Java also supports adding slicers to pivot tables using the Worksheet.getSlicers().add(IPivotTable pivot, String destCellName, int baseFieldIndex) method. The detailed steps are as follows.
- Create an object of the Workbook class.
- Get the first worksheet using the Workbook.getWorksheets.get(0) method.
- Add data to the worksheet using the Worksheet.getRange().get().setValue() and Worksheet.getRange().get().setNumberValue() methods.
- Create a pivot cache from the data using the Workbook.getPivotCaches().add() method.
- Create a pivot table from the pivot cache using the Worksheet.getPivotTables().add() method.
- Drag the pivot fields to the row, column, and data areas. Then calculate the data in the pivot table.
- Add a slicer to the pivot table using the Worksheet.getSlicers().add(IPivotTable pivot, String destCellName, int baseFieldIndex) method.
- Set the properties, such as the name, width, height, style, and cross filter type for the slicer.
- Calculate the data in the pivot table.
- Save the resulting file using the Workbook.saveToFile() method.
- Java
import com.spire.xls.*;
import com.spire.xls.core.IPivotField;
import com.spire.xls.core.IPivotTable;
import com.spire.xls.core.spreadsheet.slicer.*;

public class AddSlicerToPivotTable {
    public static void main(String[] args) {
        // Create an object of the Workbook class
        Workbook workbook = new Workbook();

        // Get the first worksheet
        Worksheet worksheet = workbook.getWorksheets().get(0);

        // Add data to the worksheet
        worksheet.getRange().get("A1").setValue("Fruit");
        worksheet.getRange().get("A2").setValue("Grape");
        worksheet.getRange().get("A3").setValue("Blueberry");
        worksheet.getRange().get("A4").setValue("Kiwi");
        worksheet.getRange().get("A5").setValue("Cherry");
        worksheet.getRange().get("A6").setValue("Grape");
        worksheet.getRange().get("A7").setValue("Blueberry");
        worksheet.getRange().get("A8").setValue("Kiwi");
        worksheet.getRange().get("A9").setValue("Cherry");

        worksheet.getRange().get("B1").setValue("Year");
        worksheet.getRange().get("B2").setNumberValue(2020);
        worksheet.getRange().get("B3").setNumberValue(2020);
        worksheet.getRange().get("B4").setNumberValue(2020);
        worksheet.getRange().get("B5").setNumberValue(2020);
        worksheet.getRange().get("B6").setNumberValue(2021);
        worksheet.getRange().get("B7").setNumberValue(2021);
        worksheet.getRange().get("B8").setNumberValue(2021);
        worksheet.getRange().get("B9").setNumberValue(2021);

        worksheet.getRange().get("C1").setValue("Sales");
        worksheet.getRange().get("C2").setNumberValue(50);
        worksheet.getRange().get("C3").setNumberValue(60);
        worksheet.getRange().get("C4").setNumberValue(70);
        worksheet.getRange().get("C5").setNumberValue(80);
        worksheet.getRange().get("C6").setNumberValue(90);
        worksheet.getRange().get("C7").setNumberValue(100);
        worksheet.getRange().get("C8").setNumberValue(110);
        worksheet.getRange().get("C9").setNumberValue(120);

        // Create a pivot cache from the specific data range
        CellRange dataRange = worksheet.getRange().get("A1:C9");
        PivotCache cache = workbook.getPivotCaches().add(dataRange);

        // Create a pivot table from the pivot cache
        PivotTable pt = worksheet.getPivotTables().add("Fruit Sales", worksheet.getRange().get("A12"), cache);

        // Drag the fields to the row and column areas
        IPivotField pf = pt.getPivotFields().get("Fruit");
        pf.setAxis(AxisTypes.Row);
        IPivotField pf2 = pt.getPivotFields().get("Year");
        pf2.setAxis(AxisTypes.Column);

        // Drag the field to the data area
        pt.getDataFields().add(pt.getPivotFields().get("Sales"), "Sum of Sales", SubtotalTypes.Sum);

        // Set style for the pivot table
        pt.setBuiltInStyle(PivotBuiltInStyles.PivotStyleMedium10);

        // Calculate the pivot table data
        pt.calculateData();

        // Add a Slicer to the pivot table
        XlsSlicerCollection slicers = worksheet.getSlicers();
        int index_1 = slicers.add(pt, "F12", 0);

        // Set the name, width, height, and style for the slicer
        XlsSlicer slicer = slicers.get(index_1);
        slicer.setName("Fruit");
        slicer.setWidth(100);
        slicer.setHeight(120);
        slicer.setStyleType(SlicerStyleType.SlicerStyleLight2);

        // Set the cross filter type for the slicer
        XlsSlicerCache slicerCache = (XlsSlicerCache)slicer.getSlicerCache();
        slicerCache.setCrossFilterType(SlicerCacheCrossFilterType.ShowItemsWithNoData);

        // Calculate the pivot table data again
        pt.calculateData();

        // Save the resulting file
        workbook.saveToFile("AddSlicerToPivotTable.xlsx", ExcelVersion.Version2013);
        workbook.dispose();
    }
}

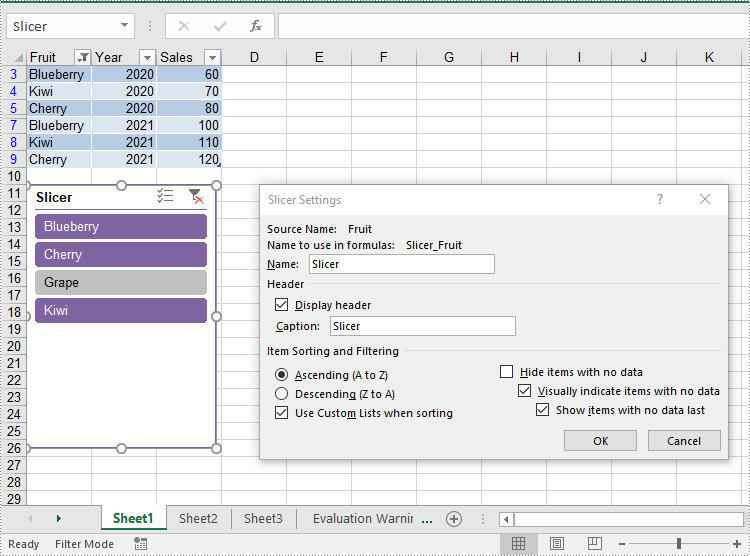
Update Slicers in Excel
The XlsSlicer class in Spire.XLS for Java provides methods for modifying slicer attributes such as name, caption, style, and cross filter type. The detailed steps are as follows.
- Create an object of the Workbook class.
- Load an Excel file using the Workbook.loadFromFile() method.
- Get a specific worksheet by its index using the Workbook.getWorksheets().get() method.
- Get a specific slicer from the worksheet by its index using the Worksheet.getSlicers().get(index) property.
- Update the properties of the slicer, such as its style, name, caption, and cross filter type using the appropriate methods of the XlsSlicer class.
- Save the resulting file using the Workbook.saveToFile() method.
- Java
import com.spire.xls.ExcelVersion;
import com.spire.xls.Workbook;
import com.spire.xls.Worksheet;
import com.spire.xls.core.spreadsheet.slicer.*;

public class UpdateSlicer {
    public static void main(String[] args) {
        // Create an object of the Workbook class
        Workbook workbook = new Workbook();

        // Load an Excel file
        workbook.loadFromFile("AddSlicerToTable.xlsx");

        // Get the first worksheet
        Worksheet worksheet = workbook.getWorksheets().get(0);

        // Get the first slicer in the worksheet
        XlsSlicer slicer = worksheet.getSlicers().get(0);

        // Change the style, name, and caption for the slicer
        slicer.setStyleType(SlicerStyleType.SlicerStyleDark4);
        slicer.setName("Slicer");
        slicer.setCaption("Slicer");

        // Change the cross filter type for the slicer
        XlsSlicerCache slicerCache = slicer.getSlicerCache();
        slicerCache.setCrossFilterType(SlicerCacheCrossFilterType.ShowItemsWithDataAtTop);

        // Deselect an item in the slicer
        XlsSlicerCacheItemCollection slicerCacheItems = slicerCache.getSlicerCacheItems();
        XlsSlicerCacheItem xlsSlicerCacheItem = slicerCacheItems.get(0);
        xlsSlicerCacheItem.isSelected(false);

        // Save the resulting file
        workbook.saveToFile("UpdateSlicer.xlsx", ExcelVersion.Version2013);
        workbook.dispose();
    }
}
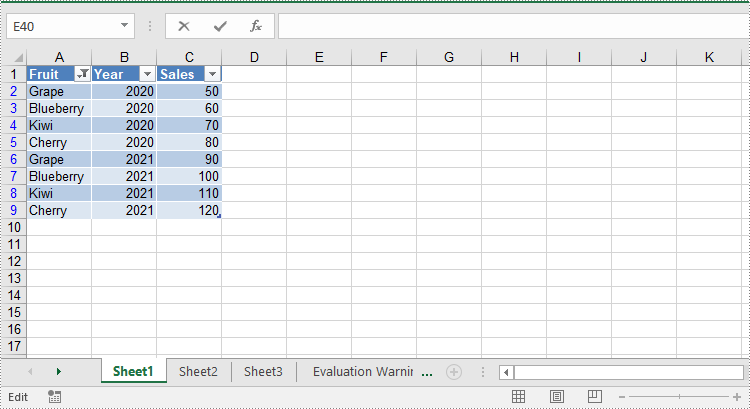
Remove Slicers from Excel
Developers can remove a specific slicer from an Excel worksheet using the Worksheet.getSlicers().removeAt() method, or remove all slicers at once using the Worksheet.getSlicers().clear() method. The detailed steps are as follows.
- Create an object of the Workbook class.
- Load an Excel file using the Workbook.loadFromFile() method.
- Get a specific worksheet by its index using the Workbook.getWorksheets().get() method.
- Remove a specific slicer from the worksheet by its index using the Worksheet.getSlicers().removeAt() method. Or remove all slicers from the worksheet using the Worksheet.getSlicers().clear() method.
- Save the resulting file using the Workbook.saveToFile() method.
- Java
import com.spire.xls.ExcelVersion;
import com.spire.xls.Workbook;
import com.spire.xls.Worksheet;

public class RemoveSlicer {
    public static void main(String[] args) {
        // Create an object of the Workbook class
        Workbook workbook = new Workbook();

        // Load an Excel file
        workbook.loadFromFile("AddSlicerToTable.xlsx");

        // Get the first worksheet
        Worksheet worksheet = workbook.getWorksheets().get(0);

        // Remove the first slicer by index
        worksheet.getSlicers().removeAt(0);

        // Alternatively, remove all slicers
        // worksheet.getSlicers().clear();

        // Save the resulting file
        workbook.saveToFile("RemoveSlicer.xlsx", ExcelVersion.Version2013);
        workbook.dispose();
    }
}
Get a Free License
To fully experience the capabilities of Spire.XLS for Java without any evaluation limitations, you can request a free 30-day trial license.
Microsoft Excel is a powerful tool for data management; however, its proprietary format can pose challenges for sharing and integrating data into web workflows. In contrast, Markdown is a lightweight and widely supported markup language that simplifies text formatting for documentation, wikis, and platforms like GitHub.
By converting Excel files to Markdown, you can seamlessly incorporate structured data into technical documents, READMEs, and static websites. This article will guide you through the steps to programmatically convert Excel files to Markdown format using C# and the Spire.XLS for .NET library.
Install Spire.XLS for .NET
To begin with, you need to add the DLL files included in the Spire.XLS for .NET package as references in your .NET project. The DLL files can be either downloaded from this link or installed via NuGet.
PM> Install-Package Spire.XLS
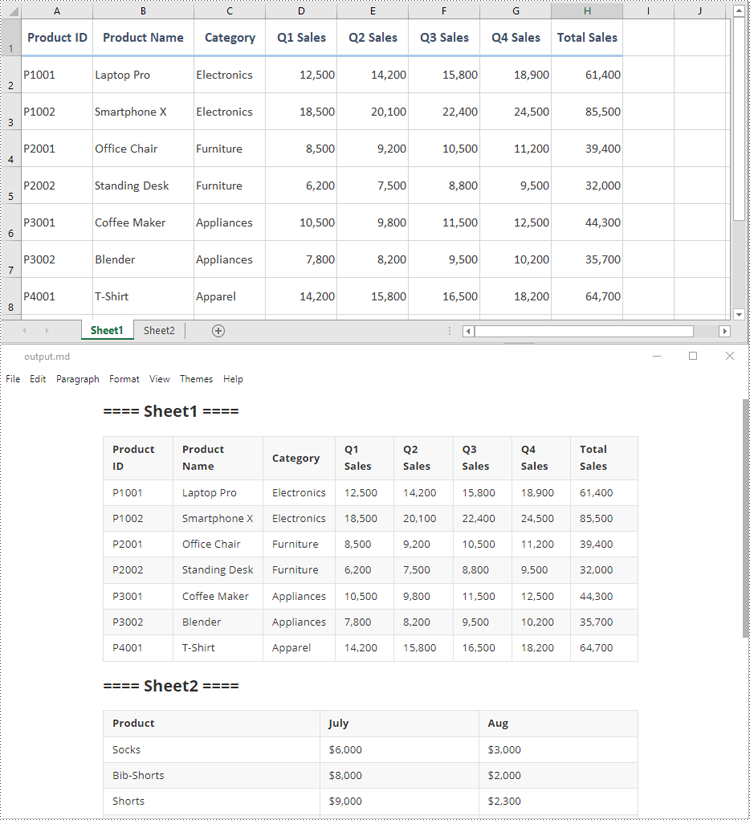
Convert an Excel XLS or XLSX File to Markdown in C#
Developers can effortlessly convert Excel XLS or XLSX files to Markdown files by using the Workbook.SaveToMarkdown() method provided by Spire.XLS for .NET. The detailed steps are as follows.
- Create an object of the Workbook class.
- Load a sample Excel XLS or XLSX file into the Workbook object using the Workbook.LoadFromFile() method.
- Save the Excel file as a Markdown file using the Workbook.SaveToMarkdown() method.
- C#
using Spire.Xls;

namespace ConvertExcelToMarkdown
{
    internal class Program
    {
        static void Main(string[] args)
        {
            // Create an object of the Workbook class
            Workbook workbook = new Workbook();
            // Load a sample Excel XLS file
            //workbook.LoadFromFile("Sample.xls");
            // Load a sample Excel XLSX file
            workbook.LoadFromFile("Sample.xlsx");

            // Save the Excel file as a Markdown file
            workbook.SaveToMarkdown("output.md");
            // Release the resources used by the Workbook object
            workbook.Dispose();
        }
    }
}
Get a Free License
To fully experience the capabilities of Spire.XLS for .NET without any evaluation limitations, you can request a free 30-day trial license.
