
Knowledgebase (2370)
Children categories
In modern web development, generating PDFs directly from HTML is essential for applications requiring dynamic reports, invoices, or user-specific documents. Using JavaScript to convert HTML to PDF in React applications ensures the preservation of structure, styling, and interactivity, transforming content into a portable, print-ready format. This method eliminates the need for separate PDF templates, leverages React's component-based architecture for dynamic rendering, and reduces server-side dependencies. By embedding PDF conversion into the front end, developers can provide a consistent user experience, enable instant document downloads, and maintain full control over design and layout. This article explores how to use Spire.Doc for JavaScript to convert HTML files and strings to PDF in React applications.
Install Spire.Doc for JavaScript
To get started with converting HTML to PDF in a React application, you can either download Spire.Doc for JavaScript from our website or install it via npm with the following command:
npm i spire.officeThe downloaded product package integrates Spire.Doc for JavaScript, Spire.XLS for JavaScript, Spire.PDF for JavaScript, and Spire.Presentation for JavaScript. To use the features of Spire.Doc for JavaScript, you need to copy the corresponding files (spire.doc.js, Spire.Doc.Wasm.zip, spire.common.js, Spire.Common.Wasm.zip, and the _framework folder) to the public folder of your project. To ensure proper text rendering, you can add relevant font files with a custom path. In the following example, the font is added to the path: public\static\font.
For more details, refer to the documentation: How to Integrate Spire.Doc for JavaScript in a React Project
Convert an HTML File to PDF with JavaScript
Using the Spire.Doc WASM module, developers can load HTML files into a Document object with the Document.LoadFromFile() method and then convert them to PDF documents using the Document.SaveToFile() method. This approach provides a concise and efficient solution for HTML-to-PDF conversion in web development.
The detailed steps are as follows:
- Load the Spire.Doc.Base.js file to initialize the WebAssembly module.
- Load the HTML file and the font files used in the HTML file into the virtual file system using the window.spire.FetchFileToVFS() method.
- Create an instance of the Document class using the new wasmModule.Document() method.
- Load the HTML file into the Document instance using the Document.LoadFromFile() method.
- Convert the HTML file to PDF format and save it using the Document.SaveToFile() method.
- Read the converted file as a file array and download it.
- JavaScript
import React, { useState, useEffect } from 'react';

function App() {
  const [wasmModule, setWasmModule] = useState(null);
  // Load Spire.Doc
  useEffect(() => {
    (async () => {
      try {
        const publicUrl = process.env.PUBLIC_URL || '';
        const spireModule = await import(/* webpackIgnore: true */ `${publicUrl}/spire.doc.js`);
        const rawModule = spireModule.default || spireModule;
        window.wasmModule = typeof rawModule === 'function'
          ? await rawModule({ locateFile: p => p.endsWith('.wasm') ? `${publicUrl}/${p}` : p })
          : rawModule;
        setWasmModule(window.wasmModule);
      } catch (error) {
        console.error('Failed to load spire.doc.js WASM module:', error);
      }
    })();
  }, []);

  // Function to convert HTML files to PDF document
  const ConvertHTMLFileToPDF = async () => {
    const wasmModule = window.wasmModule.spiredoc;

    if (wasmModule) {
      // Load the font files into the virtual file system (VFS)
      await window.spire.FetchFileToVFS('CALIBRI.ttf', '/Library/Fonts/', `${process.env.PUBLIC_URL}/static/font/`);

      // Specify the input file name and the output file name
      const inputFileName = 'Sample.html';
      const outputFileName = 'HTMLFileToPDF.pdf';

      // Fetch the input file and add it to the VFS
      await window.spire.FetchFileToVFS(inputFileName, '', `${process.env.PUBLIC_URL}/static/data/`);

      // Create an instance of the Document class
      const doc = new wasmModule.Document();

      // Load the Word document
      doc.LoadFromFile({ fileName: inputFileName, fileFormat: wasmModule.FileFormat.Html, validationType: wasmModule.XHTMLValidationType.None });

      // Save the document to a PDF file
      doc.SaveToFile({ fileName: outputFileName, fileFormat: wasmModule.FileFormat.PDF });

      // Release resources
      doc.Dispose();

      // Read the saved file from the VFS
      const modifiedFileArray = window.dotnetRuntime.Module.FS.readFile(outputFileName);

      // Generate a Blob from the file array and trigger a download
      const blob = new Blob([modifiedFileArray], { type: 'application/pdf' });
      const url = URL.createObjectURL(blob);
      const a = document.createElement("a");
      a.href = url;
      a.download = outputFileName;
      document.body.appendChild(a);
      a.click();
      document.body.removeChild(a);
      URL.revokeObjectURL(url);
    }
  };

  return (
    <div style={{ textAlign: 'center', height: '300px' }}>
      <h1>Convert HTML files to PDF Using JavaScript in React</h1>
      <button onClick={ConvertHTMLFileToPDF} disabled={!wasmModule}>
        Convert
      </button>
    </div>
  );
}

export default App;
Convert an HTML String to PDF with JavaScript
Spire.Doc for JavaScript offers the Paragraph.AppendHTML() method, which allows developers to insert HTML-formatted content directly into a document paragraph. Once the HTML content is added, the document can be saved as a PDF, enabling a seamless conversion from an HTML string to a PDF file.
The detailed steps are as follows:
- Load the Spire.Doc.Base.js file to initialize the WebAssembly module.
- Define the HTML string.
- Load the font files used in the HTML string using the window.spire.FetchFileToVFS() method.
- Create a new Document instance using the new wasmModule.Document() method.
- Add a section to the document using the Document.AddSection() method.
- Add a paragraph to the section using the Section.AddParagraph() method.
- Insert the HTML content into the paragraph using the Paragraph.AppendHTML() method.
- Save the document as a PDF file using the Document.SaveToFile() method.
- Read the converted file as a file array and download it.
- JavaScript
import React, { useState, useEffect } from 'react';

function App() {
  const [wasmModule, setWasmModule] = useState(null);
  // Load Spire.Doc
  useEffect(() => {
    (async () => {
      try {
        const publicUrl = process.env.PUBLIC_URL || '';
        const spireModule = await import(/* webpackIgnore: true */ `${publicUrl}/spire.doc.js`);
        const rawModule = spireModule.default || spireModule;
        window.wasmModule = typeof rawModule === 'function'
          ? await rawModule({ locateFile: p => p.endsWith('.wasm') ? `${publicUrl}/${p}` : p })
          : rawModule;
        setWasmModule(window.wasmModule);
      } catch (error) {
        console.error('Failed to load spire.doc.js WASM module:', error);
      }
    })();
  }, []);

  // Function to convert HTML string to PDF
  const ConvertHTMLStringToPDF = async () => {
    const wasmModule = window.wasmModule.spiredoc;

    if (wasmModule) {
      // Load the font files into the virtual file system (VFS)
      await window.spire.FetchFileToVFS('CALIBRI.ttf', '/Library/Fonts/', `${process.env.PUBLIC_URL}/static/font/`);

      // Create an instance of the Document class
      const doc = new wasmModule.Document();

      // Specify the output file name
      const outputFileName = 'HTMLStringToPDF.pdf';

      // Define the HTML string
      const htmlString = `
          <html lang="en">
              <head>
                  <meta charset="UTF-8">
                  <title>Sales Snippet</title>
              </head>
              <body style="font-family: Arial, sans-serif; margin: 20px;">
                  <div style="border: 1px solid #ddd; padding: 15px; max-width: 600px; margin: auto; background-color: #f9f9f9;">
                      <h1 style="color: #e74c3c; text-align: center;">Limited Time Offer!</h1>
                      <p style="font-size: 1.1em; color: #333; line-height: 1.5;">
                          Get ready to save big on all your favorites. This week only, enjoy 15% off site wide. From trendy clothing to home decor, find everything you love at unbeatable prices.
                      </p>
                      <div style="text-align: center;">
                          <button
                              style="background-color: #5cb85c; border: none; color: white; padding: 10px 20px; text-align: center; text-decoration: none; display: inline-block; font-size: 16px; margin: 4px 2px; cursor: pointer; border-radius: 8px;">
                              Shop Deals
                          </button>
                      </div>
                  </div>
              </body>
          </html>
      `;

      // Add a section to the document
      const section = doc.AddSection();

      // Add a paragraph to the section
      const paragraph = section.AddParagraph();

      // Insert the HTML content to the paragraph
      paragraph.AppendHTML(htmlString)

      // Save the document to a PDF file
      doc.SaveToFile({fileName: outputFileName, fileFormat: wasmModule.FileFormat.PDF});

      // Release resources
      doc.Dispose();

      // Read the saved file from the VFS
      const modifiedFileArray = window.dotnetRuntime.Module.FS.readFile(outputFileName);

      // Generate a Blob from the file array and trigger a download
      const blob = new Blob([modifiedFileArray], {type: 'application/pdf'});
      const url = URL.createObjectURL(blob);
      const a = document.createElement("a");
      a.href = url;
      a.download = outputFileName;
      document.body.appendChild(a);
      a.click();
      document.body.removeChild(a);
      URL.revokeObjectURL(url);
    }
  };

  return (
      <div style={{ textAlign: 'center', height: '300px' }}>
        <h1>Convert HTML Strings to PDF Using JavaScript in React</h1>
        <button onClick={ConvertHTMLStringToPDF} disabled={!wasmModule}>
          Convert and Download
        </button>
      </div>
  );
}

export default App;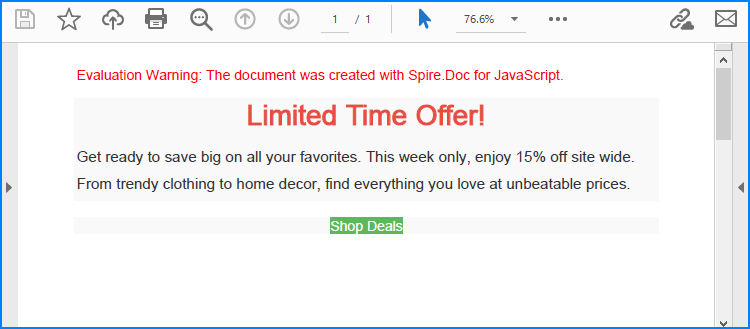
Get a Free License
To fully experience the capabilities of Spire.Doc for JavaScript without any evaluation limitations, you can request a free 30-day trial license.
Protect or Unprotect Excel Workbooks with JavaScript in React
2025-01-27 07:05:58 Written by AdministratorAs businesses increasingly rely on web-based platforms for data manipulation and sharing, the ability to programmatically protect or unprotect Excel files becomes crucial. These security settings not only ensure sensitive information is shielded from unauthorized access but also facilitate seamless collaboration among team members by allowing controlled access to specific data sets. By leveraging JavaScript in React, developers can implement these features natively, providing a robust solution to manage data confidentiality and integrity directly within their applications. In this article, we will explore how to use Spire.XLS for JavaScript to protect and unprotect Excel workbooks using JavaScript in React applications.
- Password-Protect an Excel Workbook using JavaScript
- Protect an Excel Worksheet with Specific Permissions
- Set Editable Ranges when Protect an Excel Worksheet
- Unprotect an Excel Worksheet with JavaScript
- Reset or Remove the Password of an Encrypted Excel Workbook
Install Spire.XLS for JavaScript
To get started with protecting and unprotecting Excel files in a React application, you can either download Spire.XLS for JavaScript from our website or install it via npm with the following command:
npm i spire.office
The downloaded product package has been integrated Spire.Doc for JavaScript,Spire.XLS for JavaScript,Spire.PDF for JavaScript,Spire.Presentation for JavaScript. To use the functionality of Spire.XLS for JavaScript, you need to copy the corresponding files (spire.xls.js, Spire.Xls.Wasm.zip, spire.common.js, Spire.Common.Wasm.zip, and _framework) to the project's "public" folder. At the same time, in order to ensure text rendering, the related font files can be added with custom paths. In the following example, the font addition path is: public\static\font.
For more details, refer to the documentation: How to Integrate Spire.XLS for JavaScript in a React Project
Password-Protect an Excel Workbook using JavaScript
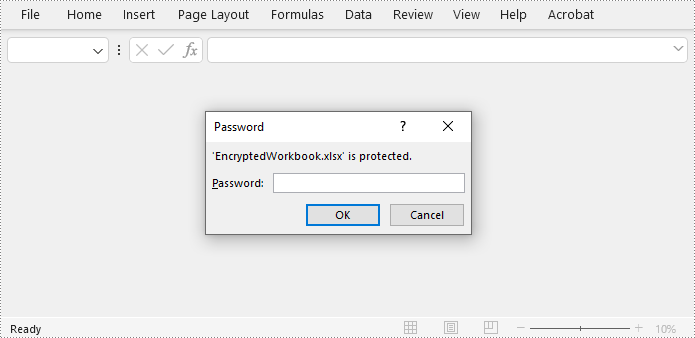
Spire.XLS for JavaScript offers the Workbook.Protect(filename: string) method to encrypt an Excel file with a password. This functionality allows developers to secure the entire Excel workbook. Below are the steps to implement this:
- Load the Spire.Xls.Base.js file to initialize the WebAssembly module.
- Load the Excel file to the virtual file system using the window.spire.FetchFileToVFS() method
- Create an instance of the Workbook class using the new wasmModule.Workbook() method.
- Load the Excel file to the Workbook instance using the Workbook.LoadFromFile() method.
- Protect the workbook with a password using the Workbook.Protect() method.
- Save the workbook to a file using Workbook.SaveToFile() method.
- Create a download link for the result file.
- JavaScript
import React, { useState, useEffect } from 'react';
function App() {
  const [wasmModule, setWasmModule] = useState(null);
  // Load Spire.XLS
  useEffect(() => {
    (async () => {
      try {
        const publicUrl = process.env.PUBLIC_URL || '';
        const spireModule = await import(/* webpackIgnore: true */ `${publicUrl}/spire.xls.js`);
        const rawModule = spireModule.default || spireModule;
        window.wasmModule = typeof rawModule === 'function'
          ? await rawModule({ locateFile: p => p.endsWith('.wasm') ? `${publicUrl}/${p}` : p })
          : rawModule;
        setWasmModule(window.wasmModule);
      } catch (error) {
        console.error('Failed to load spire.xls.js WASM module:', error);
      }
    })();
  }, []);

  //  Function to protect an Excel workbook with a password
  const EncryptExcel  = async () => {
    const wasmModule = window.wasmModule.spirexls;

    if (wasmModule) {
      // Load font into Virtual File System (VFS)
      await window.spire.FetchFileToVFS('Arial.ttf', '/Library/Fonts/', `${process.env.PUBLIC_URL}/static/font/`);


      // Load the Excel files into the virtual file system (VFS)
      let inputFileName = 'sample.xlsx';
      await window.spire.FetchFileToVFS(inputFileName, '', `${process.env.PUBLIC_URL}/static/data/`);


      // Create a new workbook
      let workbook = new wasmModule.Workbook();

      // Load an Excel document
      workbook.LoadFromFile({ fileName: inputFileName });

      // Encrypt the workbook with a password
      workbook.Protect('password')

      //Save result file
      const outputFileName = 'EncryptedWorkbook.xlsx';
      workbook.SaveToFile({ fileName: outputFileName, version: wasmModule.ExcelVersion.Version2016 });

      // Read the saved file and convert to Blob object
      const modifiedFileArray = window.dotnetRuntime.Module.FS.readFile(outputFileName);
      const modifiedFile = new Blob([modifiedFileArray], { type: 'application/vnd.openxmlformats-officedocument.spreadsheetml.sheet' });

      // Create a URL for the Blob and initiate download
      const url = URL.createObjectURL(modifiedFile);
      const a = document.createElement('a');
      a.href = url;
      a.download = outputFileName;
      document.body.appendChild(a);
      a.click();
      document.body.removeChild(a);
      URL.revokeObjectURL(url);

      // Clean up resources used by the workbook
      workbook.Dispose();
    }
  };

  return (
      <div style={{ textAlign: 'center', height: '300px' }}>
        <h1>Protect Excel Workbook Using JavaScript in React</h1>
        <button onClick={EncryptExcel} disabled={!wasmModule}>
          Encrypt and Download
        </button>
      </div>
  );
}

export default App;
Protect an Excel Worksheet with Specific Permissions
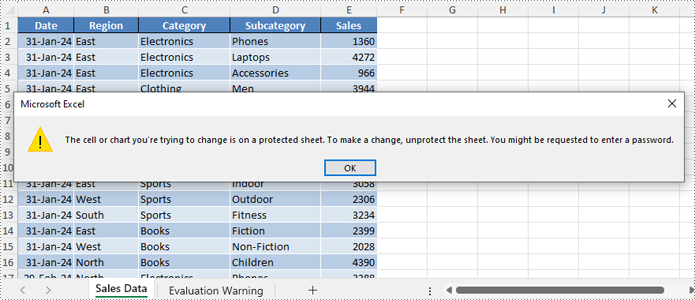
Spire.XLS for JavaScript enables developers to secure worksheets with specific permissions using the Worksheet.Protect() method, such as restricting edits while allowing formatting or filtering, or simply restricting all changes. The permissions are specified by the SheetProtectionType Enum class.
| Protection Type | Allow users to |
| Content | Modify or insert content. |
| DeletingColumns | Delete columns. |
| DeletingRows | Delete rows. |
| Filtering | Set filters. |
| FormattingCells | Format cells. |
| FormattingColumns | Format columns. |
| FormattingRows | Format rows. |
| InsertingColumns | Insert columns. |
| InsertingRows | Insert rows. |
| InsertingHyperlinks | Insert hyperlinks. |
| LockedCells | Select locked cells. |
| UnlockedCells | Select unlocked cells. |
| Objects | Modify drawing objects. |
| Scenarios | Modify saved scenarios. |
| Sorting | Sort data. |
| UsingPivotTables | Use the pivot table and pivot chart. |
| All | Do any operations listed above on the protected worksheet. |
| None | Do nothing on the protected worksheet. |
Follow these steps to protect a worksheet with specific permissions:
- Load the Spire.Xls.Base.js file to initialize the WebAssembly module.
- Load the Excel file into the virtual file system using the window.spire.FetchFileToVFS() method.
- Create a Workbook instance with the new wasmModule.Workbook() method.
- Load the Excel file into the Workbook using the Workbook.LoadFromFile() method.
- Retrieve the desired worksheet using the Workbook.Worksheets.get(index) method.
- Protect the worksheet and allow only filtering with the Worksheet.Protect(password, SheetProtectionType.None) method.
- Save the workbook using the Workbook.SaveToFile() method.
- Create a download link for the protected file.
- JavaScript
import React, { useState, useEffect } from 'react';
function App() {
  const [wasmModule, setWasmModule] = useState(null);
  // Load Spire.XLS
  useEffect(() => {
    (async () => {
      try {
        const publicUrl = process.env.PUBLIC_URL || '';
        const spireModule = await import(/* webpackIgnore: true */ `${publicUrl}/spire.xls.js`);
        const rawModule = spireModule.default || spireModule;
        window.wasmModule = typeof rawModule === 'function'
          ? await rawModule({ locateFile: p => p.endsWith('.wasm') ? `${publicUrl}/${p}` : p })
          : rawModule;
        setWasmModule(window.wasmModule);
      } catch (error) {
        console.error('Failed to load spire.xls.js WASM module:', error);
      }
    })();
  }, []);

  //  Function to protect an Excel worksheet with a password
  const EncryptExcelWorksheet = async () => {
    const wasmModule = window.wasmModule.spirexls;

    if (wasmModule) {
      // Load font into Virtual File System (VFS)
      await window.spire.FetchFileToVFS('Arial.ttf', '/Library/Fonts/', `${process.env.PUBLIC_URL}/static/font/`);


      // Load the Excel files into the virtual file system (VFS)
      let inputFileName = 'sample.xlsx';
      await window.spire.FetchFileToVFS(inputFileName, '', `${process.env.PUBLIC_URL}/static/data/`);


      // Create a new workbook
      let workbook = new wasmModule.Workbook();

      // Load an Excel document
      workbook.LoadFromFile({ fileName: inputFileName });

      // Get a worksheet
      const sheet = workbook.Worksheets.get(0);

      // Protect the worksheet with a specific permission
      sheet.Protect({ password: '123456', options: wasmModule.SheetProtectionType.None });

      //Save result file
      const outputFileName = 'ProtectedWorksheet.xlsx';
      workbook.SaveToFile({ fileName: outputFileName, version: wasmModule.ExcelVersion.Version2016 });

      // Read the saved file and convert to Blob object
      const modifiedFileArray = window.dotnetRuntime.Module.FS.readFile(outputFileName);
      const modifiedFile = new Blob([modifiedFileArray], { type: 'application/vnd.openxmlformats-officedocument.spreadsheetml.sheet' });

      // Create a URL for the Blob and initiate download
      const url = URL.createObjectURL(modifiedFile);
      const a = document.createElement('a');
      a.href = url;
      a.download = outputFileName;
      document.body.appendChild(a);
      a.click();
      document.body.removeChild(a);
      URL.revokeObjectURL(url);

      // Clean up resources used by the workbook
      workbook.Dispose();
    }
  };

  return (
    <div style={{ textAlign: 'center', height: '300px' }}>
      <h1>Protect Excel Worksheet Using JavaScript in React</h1>
      <button onClick={EncryptExcelWorksheet} disabled={!wasmModule}>
        Encrypt and Download
      </button>
    </div>
  );
}

export default App;
Set Editable Ranges when Protect an Excel Worksheet
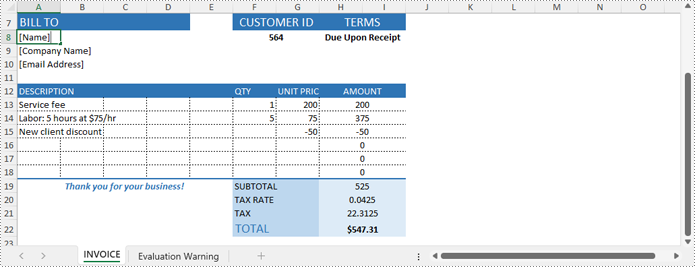
If certain cell ranges need to remain editable while protecting other areas, developers can use the Worksheet.AddAllowEditRange(name: string, range: CellRange) method to define editable ranges, and then protect the worksheet with specific permissions using the Worksheet.Protect({password: string, options: wasmModule.SheetProtectionType.All}) method.
The steps are as follows:
- Load the Spire.Xls.Base.js file to initialize the WebAssembly module.
- Load the Excel file into the virtual file system using the window.spire.FetchFileToVFS() method.
- Create a Workbook instance with the new wasmModule.Workbook() method.
- Load the Excel file into the Workbook using the Workbook.LoadFromFile() method.
- Obtain the desired worksheet using the Workbook.Worksheets.get(index) method.
- Get the cell ranges to allow editing using the Worksheet.Range.get() method.
- Add the cell ranges to editable ranges using the Worksheet.AddAllowEditRange() method.
- Protect the worksheet with the Worksheet.Protect({password: string, options: wasmModule.SheetProtectionType.All}) method.
- Save the workbook using the Workbook.SaveToFile() method.
- Create a download link for the protected file.
- JavaScript
import React, { useState, useEffect } from 'react';
function App() {
  const [wasmModule, setWasmModule] = useState(null);
  // Load Spire.XLS
  useEffect(() => {
    (async () => {
      try {
        const publicUrl = process.env.PUBLIC_URL || '';
        const spireModule = await import(/* webpackIgnore: true */ `${publicUrl}/spire.xls.js`);
        const rawModule = spireModule.default || spireModule;
        window.wasmModule = typeof rawModule === 'function'
          ? await rawModule({ locateFile: p => p.endsWith('.wasm') ? `${publicUrl}/${p}` : p })
          : rawModule;
        setWasmModule(window.wasmModule);
      } catch (error) {
        console.error('Failed to load spire.xls.js WASM module:', error);
      }
    })();
  }, []);

  //  Function to protect an Excel worksheet and add editable ranges
  const EncryptExcelWorksheetWithEditableRange = async () => {
    const wasmModule = window.wasmModule.spirexls;

    if (wasmModule) {
      // Load font into Virtual File System (VFS)
      await window.spire.FetchFileToVFS('Arial.ttf', '/Library/Fonts/', `${process.env.PUBLIC_URL}/static/font/`);


      // Load the Excel files into the virtual file system (VFS)
      let inputFileName = 'sample.xlsx';
      await window.spire.FetchFileToVFS(inputFileName, '', `${process.env.PUBLIC_URL}/static/data/`);


      // Create a new workbook
      let workbook = new wasmModule.Workbook();

      // Load an Excel document
      workbook.LoadFromFile({ fileName: inputFileName });

      // Get a worksheet
      const sheet = workbook.Worksheets.get(0);

      // Add editable ranges
      const range1 = sheet.Range.get('A8:A10');
      sheet.AddAllowEditRange({ title: "Editable Range 1", range: range1 });
      const range2 = sheet.Range.get('A13:G18');
      sheet.AddAllowEditRange({ title: "Editable Range 2", range: range2 });

      // Protect the worksheet
      sheet.Protect({ password: '123456', options: wasmModule.SheetProtectionType.All });

      //Save result file
      const outputFileName = 'EditableRanges.xlsx';
      workbook.SaveToFile({ fileName: outputFileName, version: wasmModule.ExcelVersion.Version2016 });

      // Read the saved file and convert to Blob object
      const modifiedFileArray = window.dotnetRuntime.Module.FS.readFile(outputFileName);
      const modifiedFile = new Blob([modifiedFileArray], { type: 'application/vnd.openxmlformats-officedocument.spreadsheetml.sheet' });

      // Create a URL for the Blob and initiate download
      const url = URL.createObjectURL(modifiedFile);
      const a = document.createElement('a');
      a.href = url;
      a.download = outputFileName;
      document.body.appendChild(a);
      a.click();
      document.body.removeChild(a);
      URL.revokeObjectURL(url);

      // Clean up resources used by the workbook
      workbook.Dispose();
    }
  };

  return (
    <div style={{ textAlign: 'center', height: '300px' }}>
      <h1>Protect Excel Worksheet with Editable Ranges Using JavaScript in React</h1>
      <button onClick={EncryptExcelWorksheetWithEditableRange} disabled={!wasmModule}>
        Encrypt and Download
      </button>
    </div>
  );
}

export default App;
Unprotect an Excel Worksheet with JavaScript
Developers can easily remove the password and unprotect an Excel worksheet by invoking the Worksheet.Unprotect(password: string) method, granting access and edit permissions to all users. The detailed steps are as follows:
- Load the Spire.Xls.Base.js file to initialize the WebAssembly module.
- Load the Excel file into the virtual file system using the window.spire.FetchFileToVFS() method.
- Create a Workbook instance with the new wasmModule.Workbook() method.
- Load the Excel file into the Workbook using the Workbook.LoadFromFile() method.
- Get the worksheet to unprotect using the Workbook.Worksheets.get() method.
- Remove the password protection using the Worksheet.Unprotect() method.
- Save the workbook using the Workbook.SaveToFile() method.
- Create a download link for the protected file.
- JavaScript
import React, { useState, useEffect } from 'react';
function App() {
  const [wasmModule, setWasmModule] = useState(null);
  // Load Spire.XLS
  useEffect(() => {
    (async () => {
      try {
        const publicUrl = process.env.PUBLIC_URL || '';
        const spireModule = await import(/* webpackIgnore: true */ `${publicUrl}/spire.xls.js`);
        const rawModule = spireModule.default || spireModule;
        window.wasmModule = typeof rawModule === 'function'
          ? await rawModule({ locateFile: p => p.endsWith('.wasm') ? `${publicUrl}/${p}` : p })
          : rawModule;
        setWasmModule(window.wasmModule);
      } catch (error) {
        console.error('Failed to load spire.xls.js WASM module:', error);
      }
    })();
  }, []);

  //  Function to unprotect an Excel worksheet
  const UnprotectExcelWorksheet = async () => {
    const wasmModule = window.wasmModule.spirexls;

    if (wasmModule) {
      // Load font into Virtual File System (VFS)
      await window.spire.FetchFileToVFS('Arial.ttf', '/Library/Fonts/', `${process.env.PUBLIC_URL}/static/font/`);


      // Load the Excel files into the virtual file system (VFS)
      let inputFileName = 'sample.xlsx';
      await window.spire.FetchFileToVFS(inputFileName, '', `${process.env.PUBLIC_URL}/static/data/`);


      // Create a new workbook
      let workbook = new wasmModule.Workbook();

      // Load an Excel document
      workbook.LoadFromFile({ fileName: inputFileName });

      // Get a worksheet
      const sheet = workbook.Worksheets.get(0);

      // Remove the password protection
      sheet.Unprotect('password');

      //Save result file
      const outputFileName = 'out.xlsx';
      workbook.SaveToFile({ fileName: outputFileName, version: wasmModule.ExcelVersion.Version2016 });

      // Read the saved file and convert to Blob object
      const modifiedFileArray = window.dotnetRuntime.Module.FS.readFile(outputFileName);
      const modifiedFile = new Blob([modifiedFileArray], { type: 'application/vnd.openxmlformats-officedocument.spreadsheetml.sheet' });

      // Create a URL for the Blob and initiate download
      const url = URL.createObjectURL(modifiedFile);
      const a = document.createElement('a');
      a.href = url;
      a.download = outputFileName;
      document.body.appendChild(a);
      a.click();
      document.body.removeChild(a);
      URL.revokeObjectURL(url);

      // Clean up resources used by the workbook
      workbook.Dispose();
    }
  };

  return (
    <div style={{ textAlign: 'center', height: '300px' }}>
      <h1>Unprotect Excel Worksheet Using JavaScript in React</h1>
      <button onClick={UnprotectExcelWorksheet} disabled={!wasmModule}>
        Unprotect and Download
      </button>
    </div>
  );
}

export default App;
Reset or Remove the Password of an Encrypted Excel Workbook
Spire.XLS for JavaScript provides the Workbook.OpenPassword property to specify the password for encrypted Excel workbooks, allowing developers to load and process them. After loading the encrypted workbook, developers can use the Workbook.Unprotect(password: string) method to remove the password or the Workbook.Protect(newPassword: string) method to set a new one. The steps are as follows:
- Load the Spire.Xls.Base.js file to initialize the WebAssembly module.
- Load the Excel file into the virtual file system using the window.spire.FetchFileToVFS() method.
- Create a Workbook instance with the new wasmModule.Workbook() method.
- Specify the password through the Workbook.OpenPassword property.
- Load the encrypted Excel file into the Workbook using the Workbook.LoadFromFile() method.
- Unprotect the workbook using the Workbook.Unprotect(password: string) method or set a new password using the Workbook.Protect(newPassword: string) method.
- Save the workbook using the Workbook.SaveToFile() method.
- Create a download link for the protected file.
- JavaScript
import React, { useState, useEffect } from 'react';
function App() {
  const [wasmModule, setWasmModule] = useState(null);
  // Load Spire.XLS
  useEffect(() => {
    (async () => {
      try {
        const publicUrl = process.env.PUBLIC_URL || '';
        const spireModule = await import(/* webpackIgnore: true */ `${publicUrl}/spire.xls.js`);
        const rawModule = spireModule.default || spireModule;
        window.wasmModule = typeof rawModule === 'function'
          ? await rawModule({ locateFile: p => p.endsWith('.wasm') ? `${publicUrl}/${p}` : p })
          : rawModule;
        setWasmModule(window.wasmModule);
      } catch (error) {
        console.error('Failed to load spire.xls.js WASM module:', error);
      }
    })();
  }, []);

  //  Function to unprotect an Excel workbook
  const RemoveResetExcelPassword = async () => {
    const wasmModule = window.wasmModule.spirexls;

    if (wasmModule) {
      // Load font into Virtual File System (VFS)
      await window.spire.FetchFileToVFS('Arial.ttf', '/Library/Fonts/', `${process.env.PUBLIC_URL}/static/font/`);


      // Load the Excel files into the virtual file system (VFS)
      let inputFileName = 'sample.xlsx';
      await window.spire.FetchFileToVFS(inputFileName, '', `${process.env.PUBLIC_URL}/static/data/`);


      // Create a new workbook
      let workbook = new wasmModule.Workbook();

      // Specify the password of the workbook
      workbook.OpenPassword = 'password';

      // Load an Excel document
      workbook.LoadFromFile({ fileName: inputFileName });

      // Get a worksheet
      const sheet = workbook.Worksheets.get(0);

      // Decrypt the workbook
      workbook.UnProtect('password')

      // Reset the password
      // workbook.Protect("NewPassword")

      //Save result file
      const outputFileName = 'DecryptedWorkbook.xlsx';
      workbook.SaveToFile({ fileName: outputFileName, version: wasmModule.ExcelVersion.Version2016 });

      // Read the saved file and convert to Blob object
      const modifiedFileArray = window.dotnetRuntime.Module.FS.readFile(outputFileName);
      const modifiedFile = new Blob([modifiedFileArray], { type: 'application/vnd.openxmlformats-officedocument.spreadsheetml.sheet' });

      // Create a URL for the Blob and initiate download
      const url = URL.createObjectURL(modifiedFile);
      const a = document.createElement('a');
      a.href = url;
      a.download = outputFileName;
      document.body.appendChild(a);
      a.click();
      document.body.removeChild(a);
      URL.revokeObjectURL(url);

      // Clean up resources used by the workbook
      workbook.Dispose();
    }
  };

  return (
    <div style={{ textAlign: 'center', height: '300px' }}>
      <h1>Remove the Password of Excel Workbook Using JavaScript in React</h1>
      <button onClick={RemoveResetExcelPassword} disabled={!wasmModule}>
        Decrypt and Download
      </button>
    </div>
  );
}

export default App;
Get a Free License
To fully experience the capabilities of Spire.XLS for JavaScript without any evaluation limitations, you can request a free 30-day trial license.
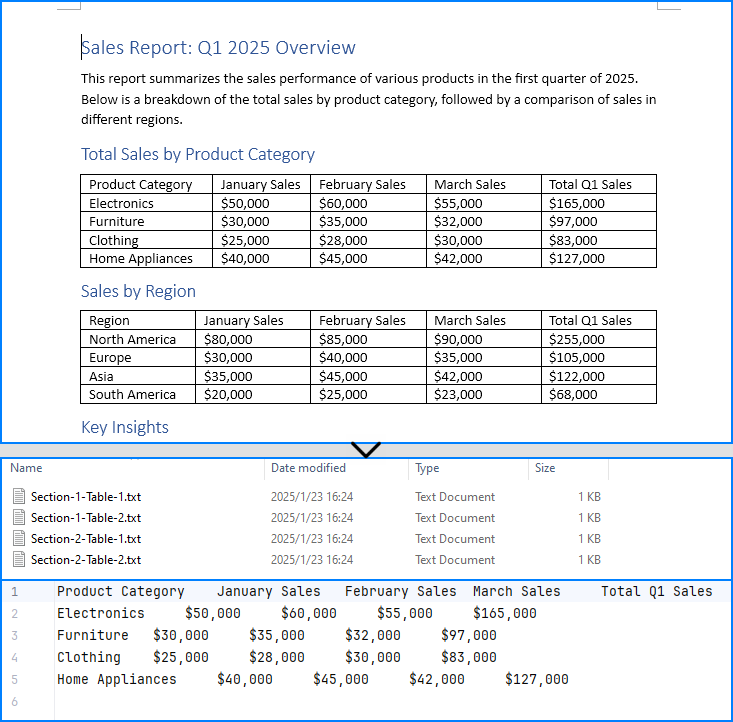
Extracting tables from Word documents is essential for many applications, as they often contain critical data for analysis, reporting, or system integration. By automating this process with Java, developers can create robust applications that seamlessly access this structured data, enabling efficient conversion into alternative formats suitable for databases, spreadsheets, or web-based visualizations. This article will demonstrate how to use Spire.Doc for Java to efficiently extract tables from Word documents in Java programs.
Install Spire.Doc for Java
First of all, you're required to add the Spire.Doc.jar file as a dependency in your Java program. The JAR file can be downloaded from this link. If you use Maven, you can easily import the JAR file in your application by adding the following code to your project's pom.xml file.
<repositories>
    <repository>
        <id>com.e-iceblue</id>
        <name>e-iceblue</name>
        <url>https://repo.e-iceblue.com/nexus/content/groups/public/</url>
    </repository>
</repositories>
<dependencies>
    <dependency>
        <groupId>e-iceblue</groupId>
        <artifactId>spire.doc</artifactId>
        <version>14.7.0</version>
    </dependency>
</dependencies>
Extract Tables from Word Documents with Java
With Spire.Doc for Java, developers can extract tables from Word documents using the Section.getTables() method. Table data can be accessed by iterating through rows and cells. The process for extracting tables is detailed below:
- Create a Document object.
- Load a Word document using the Document.loadFromFile() method.
- Access the sections in the document using the Document.getSections() method and iterate through them.
- Access the tables in each section using the Section.getTables() method and iterate through them.
- Access the rows in each table using the Table.getRows() method and iterate through them.
- Access the cells in each row using the TableRow.getCells() method and iterate through them.
- Retrieve text from each cell by iterating through its paragraphs using the TableCell.getParagraphs() and Paragraph.getText() methods.
- Add the extracted table data to a StringBuilder object.
- Write the StringBuilder object to a text file or use it as needed.
- Java
import com.spire.doc.*;
import com.spire.doc.documents.Paragraph;

import java.io.FileWriter;
import java.io.IOException;

public class ExtractWordTable {
    public static void main(String[] args) {
        // Create a Document object
        Document doc = new Document();

        try {
            // Load a Word document
            doc.loadFromFile("Sample.docx");

            // Iterate the sections in the document
            for (int i = 0; i < doc.getSections().getCount(); i++) {
                // Get a section
                Section section = doc.getSections().get(i);
                // Iterate the tables in the section
                for (int j = 0; j < section.getTables().getCount(); j++) {
                    // Get a table
                    Table table = section.getTables().get(j);
                    // Collect all table content
                    StringBuilder tableText = new StringBuilder();
                    for (int k = 0; k < table.getRows().getCount(); k++) {
                        // Get a row
                        TableRow row = table.getRows().get(k);
                        // Iterate the cells in the row
                        StringBuilder rowText = new StringBuilder();
                        for (int l = 0; l < row.getCells().getCount(); l++) {
                            // Get a cell
                            TableCell cell = row.getCells().get(l);
                            // Iterate the paragraphs to get the text in the cell
                            String cellText = "";
                            for (int m = 0; m < cell.getParagraphs().getCount(); m++) {
                                Paragraph paragraph = cell.getParagraphs().get(m);
                                cellText += paragraph.getText() + " ";
                            }
                            if (l < row.getCells().getCount() - 1) {
                                rowText.append(cellText).append("\t");
                            } else {
                                rowText.append(cellText).append("\n");
                            }
                        }
                        tableText.append(rowText);
                    }

                    // Write the table text to a file using try-with-resources
                    try (FileWriter writer = new FileWriter("output/Tables/Section-" + (i + 1) + "-Table-" + (j + 1) + ".txt")) {
                        writer.write(tableText.toString());
                    }
                }
            }
        } catch (IOException e) {
            e.printStackTrace();
        }
    }
}
Extract Tables from Word Documents to Excel Worksheets
Developers can use Spire.Doc for Java with Spire.XLS for Java to extract table data from Word documents and write it to Excel worksheets. To get started, download Spire.XLS for Java or add the following Maven configuration:
<repositories>
    <repository>
        <id>com.e-iceblue</id>
        <name>e-iceblue</name>
        <url>https://repo.e-iceblue.com/nexus/content/groups/public/</url>
    </repository>
</repositories>
<dependencies>
    <dependency>
        <groupId>e-iceblue</groupId>
        <artifactId>spire.xls</artifactId>
        <version>16.6.5</version>
    </dependency>
</dependencies>
The detailed steps for extracting tables from Word documents to Excel workbooks are as follows:
- Create a Document object.
- Create a Workbook object and remove the default worksheets using the Workbook.getWorksheets().clear() method.
- Load a Word document using the Document.loadFromFile() method.
- Access the sections in the document using the Document.getSections() method and iterate through them.
- Access the tables in each section using the Section.getTables() method and iterate through them.
- Create a worksheet for each table using the Workbook.getWorksheets().add() method.
- Access the rows in each table using the Table.getRows() method and iterate through them.
- Access the cells in each row using the TableRow.getCells() method and iterate through them.
- Retrieve text from each cell by iterating through its paragraphs using the TableCell.getParagraphs() and Paragraph.getText() methods.
- Write the extracted cell text to the corresponding cell in the worksheet using the Worksheet.getRange().get(row, column).setValue() method.
- Format the worksheet as needed.
- Save the workbook to an Excel file using the Workbook.saveToFile() method.
- Java
import com.spire.doc.*;
import com.spire.doc.documents.Paragraph;
import com.spire.xls.FileFormat;
import com.spire.xls.Workbook;
import com.spire.xls.Worksheet;

public class ExtractWordTableToExcel {
    public static void main(String[] args) {
        // Create a Document object
        Document doc = new Document();

        // Create a Workbook object
        Workbook workbook = new Workbook();
        // Remove the default worksheets
        workbook.getWorksheets().clear();

        try {
            // Load a Word document
            doc.loadFromFile("Sample.docx");

            // Iterate the sections in the document
            for (int i = 0; i < doc.getSections().getCount(); i++) {
                // Get a section
                Section section = doc.getSections().get(i);
                // Iterate the tables in the section
                for (int j = 0; j < section.getTables().getCount(); j++) {
                    // Get a table
                    Table table = section.getTables().get(j);
                    // Create a worksheet for each table
                    Worksheet sheet = workbook.getWorksheets().add("Section-" + (i + 1) + "-Table-" + (j + 1));
                    for (int k = 0; k < table.getRows().getCount(); k++) {
                        // Get a row
                        TableRow row = table.getRows().get(k);
                        for (int l = 0; l < row.getCells().getCount(); l++) {
                            // Get a cell
                            TableCell cell = row.getCells().get(l);
                            // Iterate the paragraphs to get the text in the cell
                            String cellText = "";
                            for (int m = 0; m < cell.getParagraphs().getCount(); m++) {
                                Paragraph paragraph = cell.getParagraphs().get(m);
                                if (m > 0 && m < cell.getParagraphs().getCount() - 1) {
                                    cellText += paragraph.getText() + "\n";
                                }
                                else {
                                    cellText += paragraph.getText();
                                }
                                // Write the cell text to the corresponding cell in the worksheet
                                sheet.getRange().get(k + 1, l + 1).setValue(cellText);
                            }
                            // Auto-fit columns
                            sheet.autoFitColumn(l + 1);
                        }
                    }
                }
            }
        } catch (Exception e) {
            throw new RuntimeException(e);
        }
        workbook.saveToFile("output/WordTableToExcel.xlsx", FileFormat.Version2016);
    }
}

Apply for a Temporary License
If you'd like to remove the evaluation message from the generated documents, or to get rid of the function limitations, please request a 30-day trial license for yourself.
