
Knowledgebase (2370)
Children categories
When working with Word documents, managing fonts can be a tedious task, especially when dealing with large files or multiple documents. Whether you're looking to standardize fonts across a document or fix inconsistencies, knowing how to retrieve and replace fonts efficiently is a valuable skill. In this guide, you will learn how to use Spire.Doc for Python to automate font retrieval and replacement processes.
Install Spire.Doc for Python
This scenario requires Spire.Doc for Python and plum-dispatch v1.7.4. They can be easily installed in your Windows through the following pip command.
pip install Spire.Doc
If you are unsure how to install, please refer to this tutorial: How to Install Spire.Doc for Python on Windows
Retrieve Fonts in a Word Document
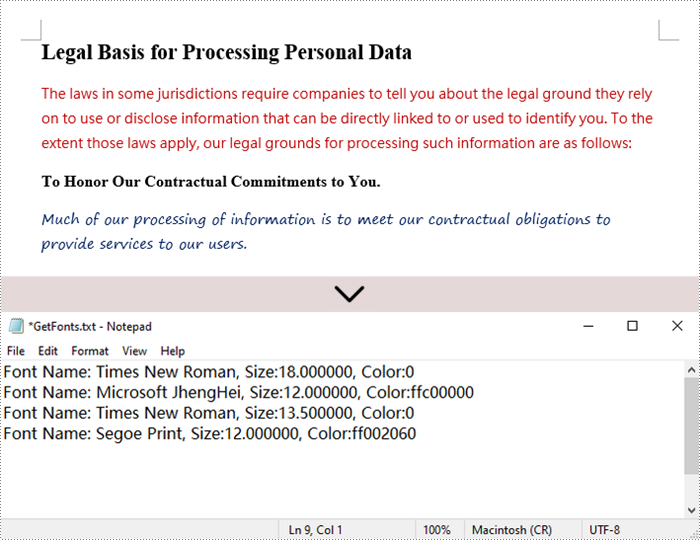
To retrieve font information from a Word document, you will need to iterate through the document's sections, paragraphs, and their child objects. As you check each child object, look for instances of TextRange. If a TextRange is found, you can extract the font details such as the font name and size from its CharacterFormat properties.
The following are the steps to retrieve font information from a Word document using Python:
- Create a Document object.
- Load a Word document using the Document.LoadFromFile() method.
- Iterate through each section and paragraph.
- For each child object, check if it’s an instance of TextRange.
- If it is, get the font name and size using the TextRange.CharacterFormat.FontName and TextRange.CharacterFormat.FontSize properties.
- Python
from spire.doc import *
from spire.doc.common import *

# Function to write string to a txt file
def WriteAllText(fname:str,text:List[str]):
    fp = open(fname,"w")
    for s in text:
        fp.write(s)

# Customize a FontInfo class
class FontInfo:
    def __init__(self):
        self._m_name = ''
        self._m_size = None

    def __eq__(self,other):
        if isinstance(other,FontInfo):
            return self._m_name == other.get_name() and self._m_size == other.get_size()
        return False

    def get_name(self):
        return self._m_name

    def set_name(self, value):
        self._m_name = value

    def get_size(self):
        return self._m_size

    def set_size(self, value):
        self._m_size = value

# Declare variables
fontImformations = ""
font_infos = []

# Create a Document instance
document = Document()

# Load a Word document
document.LoadFromFile("C:\\Users\\Administrator\\Desktop\\input.docx")

# Iterate through the sections
for i in range(document.Sections.Count):

    # Get a specific section
    section = document.Sections.get_Item(i)

    # Iterate through the paragraphs
    for j in range(section.Body.Paragraphs.Count):

        # Get a specific paragraph
        paragraph = section.Body.Paragraphs.get_Item(j)

        # Iterate through the child objects
        for k in range(paragraph.ChildObjects.Count):

            # Get a specific paragraph
            obj = paragraph.ChildObjects.get_Item(k)

            # Determine if a child object is a text range
            if isinstance(obj, TextRange):

                # Get a specific text range
                txtRange = obj if isinstance(obj, TextRange) else None

                # Get the font name and size
                fontName = txtRange.CharacterFormat.FontName
                fontSize = txtRange.CharacterFormat.FontSize

                # Get text color
                textColor = txtRange.CharacterFormat.TextColor.Name

                # Store the font information in the fontInformations variable
                fontInfo = FontInfo()
                fontInfo.set_name(fontName)
                fontInfo.set_size(fontSize)
                if  fontInfo not in font_infos:
                    font_infos.append(fontInfo)
                    str = "Font Name: {0:s}, Size:{1:f}, Color:{2:s}".format(fontInfo.get_name(), fontInfo.get_size(), textColor)
                    fontInformations += str
                    fontInformations += '\r'

# Write font information to a txt file
WriteAllText("output/GetFonts.txt", fontInformations)

# Dispose resources
document.Dispose()
Replace Fonts in a Word Document
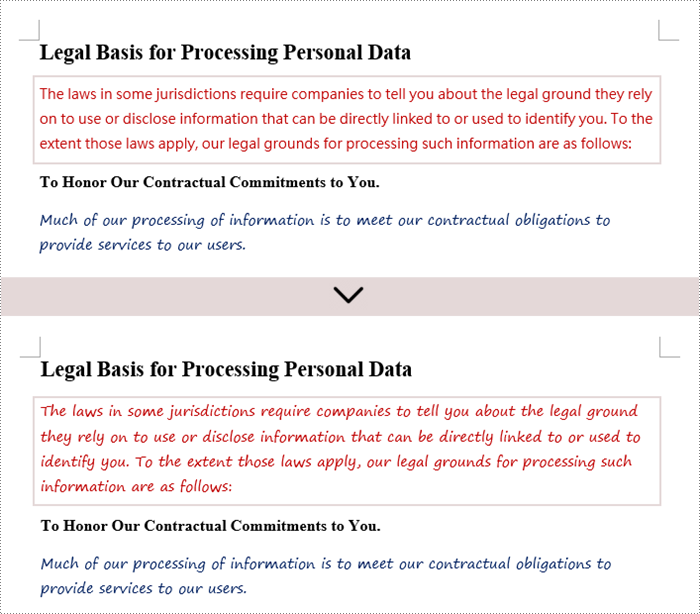
Once you retrieve the font name of a specific text range, you can easily replace it with a different font. To do this, utilize the TextRange.CharacterFormat.FontName property to assign a new font. Additionally, you can modify the font size and text color using the corresponding properties in the TextRange class.
The following are the steps to replace a specific font in a Word document using Python:
- Create a Document object.
- Load a Word document using the Document.LoadFromFile() method.
- Iterate through each section and paragraph.
- For each child object, check if it’s an instance of TextRange.
- If it is, get the font name using the TextRange.CharacterFormat.FontName property.
- Check if the font name is the specified font.
- If it is, set a new font name for the text range using the TextRange.CharacterFormat.FontName property.
- Save the changes to a different Word file using the Document.SaveToFile() method.
- Python
from spire.doc import *
from spire.doc.common import *

# Create a Document instance
document = Document()

# Load a Word document
document.LoadFromFile("C:\\Users\\Administrator\\Desktop\\input.docx")

# Iterate through the sections
for i in range(document.Sections.Count):

    # Get a specific section
    section = document.Sections.get_Item(i)

    # Iterate through the paragraphs
    for j in range(section.Body.Paragraphs.Count):

        # Get a specific paragraph
        paragraph = section.Body.Paragraphs.get_Item(j)

        # Iterate through the child objects
        for k in range(paragraph.ChildObjects.Count):

            # Get a specific paragraph
            obj = paragraph.ChildObjects.get_Item(k)

            # Determine if a child object is a text range
            if isinstance(obj, TextRange):

                # Get a specific text range
                txtRange = obj if isinstance(obj, TextRange) else None

                # Get the font name
                fontName = txtRange.CharacterFormat.FontName

                # Determine if the font name is Microsoft JhengHei
                if (fontName == "Microsoft JhengHei"):

                    # Replace the font with another font
                    txtRange.CharacterFormat.FontName = "Segoe Print"

# Save the document to a different file
document.SaveToFile("output/ReplaceFonts.docx", FileFormat.Docx)

# Dispose resources
document.Dispose()
Apply for a Temporary License
If you'd like to remove the evaluation message from the generated documents, or to get rid of the function limitations, please request a 30-day trial license for yourself.
Set Row Height and Column Width in Excel with JavaScript in React
2025-02-17 01:01:16 Written by AdministratorWhen working with Excel files, setting the proper row height and column width is crucial for data presentation and readability. For example, if there are long text entries in a column, increasing the column width ensures that the entire text is clearly visible without truncation. Similarly, for rows that contain large fonts or multiple lines of text, adjusting the row height is necessary. In this article, you will learn how to set row height and column width in Excel in React using Spire.XLS for JavaScript.
Install Spire.XLS for JavaScript
To get started with setting row height or column width in a React application, you can either download Spire.XLS for JavaScript from our website or install it via npm with the following command:
npm i spire.office
The downloaded product package has been integrated Spire.Doc for JavaScript,Spire.XLS for JavaScript,Spire.PDF for JavaScript,Spire.Presentation for JavaScript. To use the functionality of Spire.XLS for JavaScript, you need to copy the corresponding files (spire.xls.js, Spire.Xls.Wasm.zip, spire.common.js, Spire.Common.Wasm.zip, and _framework) to the project's "public" folder. At the same time, in order to ensure text rendering, the related font files can be added with custom paths. In the following example, the font addition path is: public\static\font.
For more details, refer to the documentation: How to Integrate Spire.XLS for JavaScript in a React Project
Set Row Height in Excel with JavaScript
Spire.XLS for JavaScript provides the Worksheet.SetRowHeight() method to set the height of a specified row in an Excel worksheet. The following are the main steps.
- Create a Workbook object using the new wasmModule.Workbook() method.
- Load an Excel file using the Workbook.LoadFromFile() method.
- Get a specific worksheet using the Workbook.Worksheets.get() method.
- Set the height of a specified row using the Worksheet. SetRowHeight() method.
- Save the result file using the Workbook.SaveToFile() method.
- JavaScript
import React, { useState, useEffect } from 'react';
function App() {
  const [wasmModule, setWasmModule] = useState(null);
  // Load Spire.XLS
  useEffect(() => {
    (async () => {
      try {
        const publicUrl = process.env.PUBLIC_URL || '';
        const spireModule = await import(/* webpackIgnore: true */ `${publicUrl}/spire.xls.js`);
        const rawModule = spireModule.default || spireModule;
        window.wasmModule = typeof rawModule === 'function'
          ? await rawModule({ locateFile: p => p.endsWith('.wasm') ? `${publicUrl}/${p}` : p })
          : rawModule;
        setWasmModule(window.wasmModule);
      } catch (error) {
        console.error('Failed to load spire.xls.js WASM module:', error);
      }
    })();
  }, []);

  // Function to delete a specified row and column
  const SetRowHeight  = async () => {
    const wasmModule = window.wasmModule.spirexls;

    if (wasmModule) {
      // Load font into Virtual File System (VFS)
      await window.spire.FetchFileToVFS('Arial.ttf', '/Library/Fonts/', `${process.env.PUBLIC_URL}/static/font/`);


      // Load the Excel files into the virtual file system (VFS)
      let inputFileName = 'merged.xlsx';
      await window.spire.FetchFileToVFS(inputFileName, '', `${process.env.PUBLIC_URL}/static/data/`);


      // Create a new workbook
      let workbook = new wasmModule.Workbook();


      // Load an Excel document
      workbook.LoadFromFile({ fileName: inputFileName });

      // Get the first worksheet
      let sheet = workbook.Worksheets.get(0);

      // Set the height of the first row to 30
      sheet.SetRowHeight(1, 30)

      //Save result file
      const outputFileName = 'SetRowHeight.xlsx';
      workbook.SaveToFile({fileName: outputFileName, version:wasmModule.ExcelVersion.Version2016});

      // Read the saved file and convert to Blob object
      const modifiedFileArray = window.dotnetRuntime.Module.FS.readFile(outputFileName);
      const modifiedFile = new Blob([modifiedFileArray], { type: 'application/vnd.openxmlformats-officedocument.spreadsheetml.sheet' });

      // Create a URL for the Blob and initiate download
      const url = URL.createObjectURL(modifiedFile);
      const a = document.createElement('a');
      a.href = url;
      a.download = outputFileName;
      document.body.appendChild(a);
      a.click();
      document.body.removeChild(a);
      URL.revokeObjectURL(url);

      // Clean up resources used by the workbook
      workbook.Dispose();
    }
  };

  return (
    <div style={{ textAlign: 'center', height: '300px' }}>
      <h1>Set Row Height in Excel Using JavaScript in React</h1>
      <button onClick={SetRowHeight} disabled={!wasmModule}>
        Process
      </button>
    </div>
  );
}

export default App;
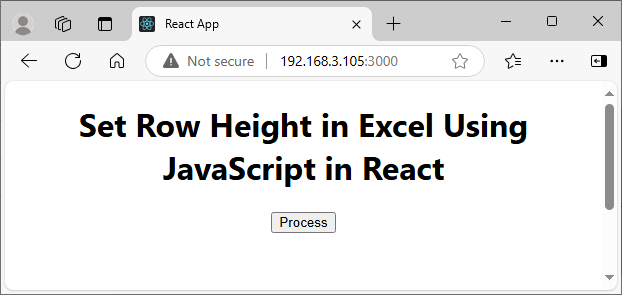
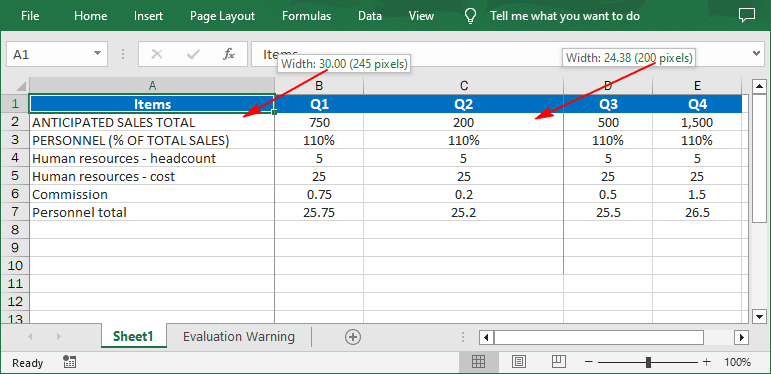
Run the code to launch the React app at localhost:3000. Once it's running, click the "Process" button to set the row height in Excel:
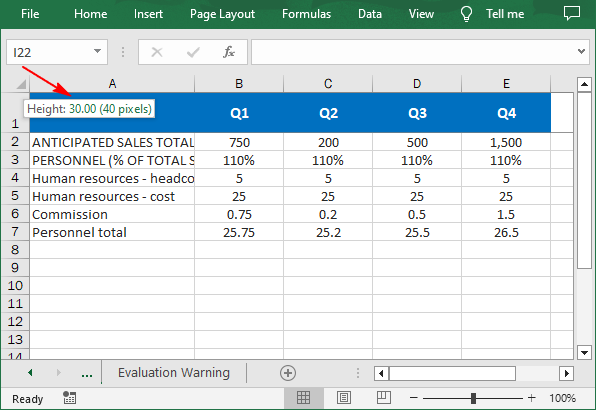
Below is the result file:
Set Column Width in Excel with JavaScript
Worksheet.SetColumnWidth() method can be used to set the width of a specified column. The default unit of measure is points, and if you want to set column width in pixels, you can use the Worksheet.SetColumnWidthInPixels() method. The following are the main steps.
- Create a Workbook object using the new wasmModule.Workbook() method.
- Load an Excel file using the Workbook.LoadFromFile() method.
- Get a specific worksheet using the Workbook.Worksheets.get() method.
- Set the width of a specified column in points using the Worksheet.SetColumnWidth() method.
- Set the width of a specified column in pixels using the Worksheet.SetColumnWidthInPixels() method.
- Save the result file using the Workbook.SaveToFile() method.
- JavaScript
import React, { useState, useEffect } from 'react';
function App() {
  const [wasmModule, setWasmModule] = useState(null);
  // Load Spire.XLS
  useEffect(() => {
    (async () => {
      try {
        const publicUrl = process.env.PUBLIC_URL || '';
        const spireModule = await import(/* webpackIgnore: true */ `${publicUrl}/spire.xls.js`);
        const rawModule = spireModule.default || spireModule;
        window.wasmModule = typeof rawModule === 'function'
          ? await rawModule({ locateFile: p => p.endsWith('.wasm') ? `${publicUrl}/${p}` : p })
          : rawModule;
        setWasmModule(window.wasmModule);
      } catch (error) {
        console.error('Failed to load spire.xls.js WASM module:', error);
      }
    })();
  }, []);

  //  Function to delete a specified row and column
  const SetColumnWidth = async () => {
    const wasmModule = window.wasmModule.spirexls;

    if (wasmModule) {
      // Load font into Virtual File System (VFS)
      await window.spire.FetchFileToVFS('Arial.ttf', '/Library/Fonts/', `${process.env.PUBLIC_URL}/static/font/`);


      // Load the Excel files into the virtual file system (VFS)
      let inputFileName = 'merged.xlsx';
      await window.spire.FetchFileToVFS(inputFileName, '', `${process.env.PUBLIC_URL}/static/data/`);


      // Create a new workbook
      let workbook = new wasmModule.Workbook();


      // Load an Excel document
      workbook.LoadFromFile({ fileName: inputFileName });

      // Get the first worksheet
      let sheet = workbook.Worksheets.get(0);

      // Set the width of the first colum to 30 points
      sheet.SetColumnWidth(1, 30);

      // Set the width of the third column to 200 pixels
      sheet.SetColumnWidthInPixels(3, 200);

      //Save result file
      const outputFileName = 'SetColumnWidth.xlsx';
      workbook.SaveToFile({ fileName: outputFileName, version: wasmModule.ExcelVersion.Version2016 });

      // Read the saved file and convert to Blob object
      const modifiedFileArray = window.dotnetRuntime.Module.FS.readFile(outputFileName);
      const modifiedFile = new Blob([modifiedFileArray], { type: 'application/vnd.openxmlformats-officedocument.spreadsheetml.sheet' });

      // Create a URL for the Blob and initiate download
      const url = URL.createObjectURL(modifiedFile);
      const a = document.createElement('a');
      a.href = url;
      a.download = outputFileName;
      document.body.appendChild(a);
      a.click();
      document.body.removeChild(a);
      URL.revokeObjectURL(url);

      // Clean up resources used by the workbook
      workbook.Dispose();
    }
  };

  return (
    <div style={{ textAlign: 'center', height: '300px' }}>
      <h1>Set Column Width in Excel Using JavaScript in React</h1>
      <button onClick={SetColumnWidth} disabled={!wasmModule}>
        Process
      </button>
    </div>
  );
}

export default App;
Get a Free License
To fully experience the capabilities of Spire.XLS for JavaScript without any evaluation limitations, you can request a free 30-day trial license.
A line chart is a type of chart that displays information as a series of data points connected by straight line segments. It's particularly useful for showing changes over time. For example, if you're tracking monthly sales figures, a line chart can help you identify trends, peaks, and troughs. In this article, you will learn how to create a line chart in Excel in Python using Spire.XLS for Python.
Install Spire.XLS for Python
This scenario requires Spire.XLS for Python and plum-dispatch v1.7.4. They can be easily installed in your Windows through the following pip command.
pip install Spire.XLS
If you are unsure how to install, please refer to this tutorial: How to Install Spire.XLS for Python on Windows
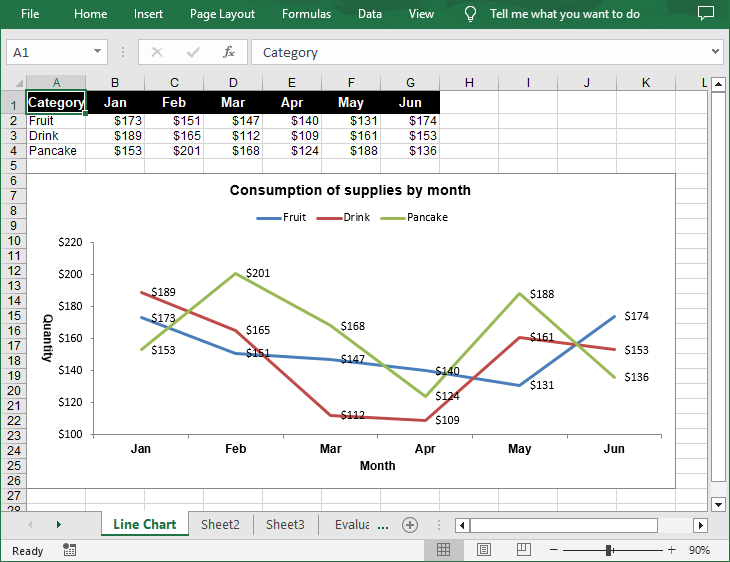
Create a Simple Line Chart in Excel in Python
Spire.XLS for Python provides the Worksheet.Charts.Add(ExcelChartType.Line) method to add a simple line chart to an Excel worksheet. The following are the detailed steps:
- Create a Workbook instance.
- Get a specified worksheet using Workbook.Worksheets[] property.
- Add the chart data to specified cells and set the cell styles.
- Add a simple line chart to the worksheet using Worksheet.Charts.Add(ExcelChartType.Line) method.
- Set data range for the chart using Chart.DataRange property.
- Set the position, title, axis and other attributes of the chart.
- Save the result file using Workbook.SaveToFile() method.
- Python
from spire.xls import *
from spire.xls.common import *

# Create a Workbook instance
workbook = Workbook()

# Get the first sheet and set its name
sheet = workbook.Worksheets[0]
sheet.Name = "Line Chart"

# Add chart data to specified cells
sheet.Range["A1"].Value = "Category"
sheet.Range["A2"].Value = "Fruit"
sheet.Range["A3"].Value = "Drink"
sheet.Range["A4"].Value = "Pancake"

sheet.Range["B1"].Value = "Jan"
sheet.Range["B2"].NumberValue = 173
sheet.Range["B3"].NumberValue = 189
sheet.Range["B4"].NumberValue = 153

sheet.Range["C1"].Value = "Feb"
sheet.Range["C2"].NumberValue = 151
sheet.Range["C3"].NumberValue = 165
sheet.Range["C4"].NumberValue = 201

sheet.Range["D1"].Value = "Mar"
sheet.Range["D2"].NumberValue = 147
sheet.Range["D3"].NumberValue = 112
sheet.Range["D4"].NumberValue = 168

sheet.Range["E1"].Value = "Apr"
sheet.Range["E2"].NumberValue = 140
sheet.Range["E3"].NumberValue = 109
sheet.Range["E4"].NumberValue = 124

sheet.Range["F1"].Value = "May"
sheet.Range["F2"].NumberValue = 131
sheet.Range["F3"].NumberValue = 161
sheet.Range["F4"].NumberValue = 188

sheet.Range["G1"].Value = "Jun"
sheet.Range["G2"].NumberValue = 174
sheet.Range["G3"].NumberValue = 153
sheet.Range["G4"].NumberValue = 136

# Set cell styles
sheet.Range["A1:G1"].RowHeight = 20
sheet.Range["A1:G1"].Style.Color = Color.get_Black()
sheet.Range["A1:G1"].Style.Font.Color = Color.get_White()
sheet.Range["A1:G1"].Style.Font.IsBold = True
sheet.Range["A1:G1"].Style.Font.Size = 11
sheet.Range["A1:G1"].Style.VerticalAlignment = VerticalAlignType.Center
sheet.Range["A1:G1"].Style.HorizontalAlignment = HorizontalAlignType.Center
sheet.Range["B2:G4"].Style.NumberFormat = "\"$\"#,##0"

# Add a line chart to the worksheet
chart = sheet.Charts.Add(ExcelChartType.Line)

# Set data range for the chart
chart.DataRange = sheet.Range["A1:G4"]

# Set position of chart
chart.LeftColumn = 1
chart.TopRow = 6
chart.RightColumn = 12
chart.BottomRow = 27

# Set and format chart title
chart.ChartTitle = "Consumption of supplies by month"
chart.ChartTitleArea.IsBold = True
chart.ChartTitleArea.Size = 12

# Set the category axis of the chart
chart.PrimaryCategoryAxis.Title = "Month"
chart.PrimaryCategoryAxis.Font.IsBold = True
chart.PrimaryCategoryAxis.TitleArea.IsBold = True

# Set the value axis of the chart
chart.PrimaryValueAxis.Title = "Quantity"
chart.PrimaryValueAxis.HasMajorGridLines = False
chart.PrimaryValueAxis.TitleArea.TextRotationAngle = 90
chart.PrimaryValueAxis.MinValue = 100
chart.PrimaryValueAxis.TitleArea.IsBold = True

# Set series colors and data labels
for cs in chart.Series:
    cs.Format.Options.IsVaryColor = True
    cs.DataPoints.DefaultDataPoint.DataLabels.HasValue = True

# Set legend position
chart.Legend.Position = LegendPositionType.Top

# Save the document
workbook.SaveToFile("LineChart.xlsx", ExcelVersion.Version2016)
workbook.Dispose()
Create a Stacked Line Chart in Excel in Python
A stacked line chart stacks the values of each category on top of each other. This makes it easier to visualize how each data series contributes to the overall trend. The following are the steps to create a stacked line chart using Python:
- Create a Workbook instance.
- Get a specified worksheet using Workbook.Worksheets[] property.
- Add the chart data to specified cells and set the cell styles.
- Add a stacked line chart to the worksheet using Worksheet.Charts.Add(ExcelChartType.LineStacked) method.
- Set data range for the chart using Chart.DataRange property.
- Set the position, title, axis and other attributes of the chart.
- Save the result file using Workbook.SaveToFile() method.
- Python
from spire.xls import *
from spire.xls.common import *

# Create a Workbook instance
workbook = Workbook()

# Get the first sheet and set its name
sheet = workbook.Worksheets[0]
sheet.Name = "Line Chart"

# Add chart data to specified cells
sheet.Range["A1"].Value = "Category"
sheet.Range["A2"].Value = "Fruit"
sheet.Range["A3"].Value = "Drink"
sheet.Range["A4"].Value = "Pancake"

sheet.Range["B1"].Value = "Jan"
sheet.Range["B2"].NumberValue = 173
sheet.Range["B3"].NumberValue = 189
sheet.Range["B4"].NumberValue = 153

sheet.Range["C1"].Value = "Feb"
sheet.Range["C2"].NumberValue = 151
sheet.Range["C3"].NumberValue = 165
sheet.Range["C4"].NumberValue = 201

sheet.Range["D1"].Value = "Mar"
sheet.Range["D2"].NumberValue = 147
sheet.Range["D3"].NumberValue = 112
sheet.Range["D4"].NumberValue = 168

sheet.Range["E1"].Value = "Apr"
sheet.Range["E2"].NumberValue = 140
sheet.Range["E3"].NumberValue = 109
sheet.Range["E4"].NumberValue = 124

sheet.Range["F1"].Value = "May"
sheet.Range["F2"].NumberValue = 131
sheet.Range["F3"].NumberValue = 161
sheet.Range["F4"].NumberValue = 188

sheet.Range["G1"].Value = "Jun"
sheet.Range["G2"].NumberValue = 174
sheet.Range["G3"].NumberValue = 153
sheet.Range["G4"].NumberValue = 136

# Set cell styles
sheet.Range["A1:G1"].RowHeight = 20
sheet.Range["A1:G1"].Style.Color = Color.get_Black()
sheet.Range["A1:G1"].Style.Font.Color = Color.get_White()
sheet.Range["A1:G1"].Style.Font.IsBold = True
sheet.Range["A1:G1"].Style.Font.Size = 11
sheet.Range["A1:G1"].Style.VerticalAlignment = VerticalAlignType.Center
sheet.Range["A1:G1"].Style.HorizontalAlignment = HorizontalAlignType.Center
sheet.Range["B2:G4"].Style.NumberFormat = "\"$\"#,##0"

# Add a stacked line chart to the worksheet
chart = sheet.Charts.Add(ExcelChartType.LineStacked)

# Set data range for the chart
chart.DataRange = sheet.Range["A1:G4"]

# Set position of chart
chart.LeftColumn = 1
chart.TopRow = 6
chart.RightColumn = 12
chart.BottomRow = 27

# Set and format chart title
chart.ChartTitle = "Consumption of supplies by month"
chart.ChartTitleArea.IsBold = True
chart.ChartTitleArea.Size = 12

# Set the category axis of the chart
chart.PrimaryCategoryAxis.Title = "Month"
chart.PrimaryCategoryAxis.Font.IsBold = True
chart.PrimaryCategoryAxis.TitleArea.IsBold = True

# Set the value axis of the chart
chart.PrimaryValueAxis.Title = "Quantity"
chart.PrimaryValueAxis.HasMajorGridLines = False
chart.PrimaryValueAxis.TitleArea.TextRotationAngle = 90
chart.PrimaryValueAxis.TitleArea.IsBold = True

# Set series colors and data labels
for cs in chart.Series:
    cs.Format.Options.IsVaryColor = True
    cs.DataPoints.DefaultDataPoint.DataLabels.HasValue = True

# Set legend position
chart.Legend.Position = LegendPositionType.Top

# Save the document
workbook.SaveToFile("StackedLineChart.xlsx", ExcelVersion.Version2016)
workbook.Dispose()
Apply for a Temporary License
If you'd like to remove the evaluation message from the generated documents, or to get rid of the function limitations, please request a 30-day trial license for yourself.
