Knowledgebase (2370)
Children categories
This article has demonstrated how to create a Windows Forms Application to open and close Word file using Spire.DocViewer. Now, we are adding a print button to Form1 to fulfill the print feature for this Word document viewer.
Detailed Steps
Step 1: Add another button to Form1, and set the following properties for it in the Properties Window:
- Name: btnPrint
- DisplayStyle: Image
- Image: Print.Properties.Resources.Print
Step 2: Double click the button to write code. In this button code, we firstly instantiate an object of System.Windows.Forms.PrintDialog and set some of its relative properties. Call ShowDialog method to make the print dialog visible.
    private void btnPrint_Click(object sender, EventArgs e)
        {
            //Show a Print Dialog
            PrintDialog dialog = new PrintDialog();
            dialog.AllowCurrentPage = true;
            dialog.AllowSomePages = true;
            dialog.UseEXDialog = true;
            DialogResult result = dialog.ShowDialog();
            //...
         }
Step 3: Set print parameters of DocDocumentViewer.PrintDialog and print the document.
            //...
                 if (result == DialogResult.OK)
            {
                try
                {
                    //Set print parameters.
                    this.docDocumentViewer1.PrintDialog = dialog;
                    //Gets the PrintDocument.
                    dialog.Document = docDocumentViewer1.PrintDocument;
                    dialog.Document.Print();
                }
                catch (Exception ex)
                {
                    MessageBox.Show(ex.Message, "Error", MessageBoxButtons.OK, MessageBoxIcon.Error);
                }
            }
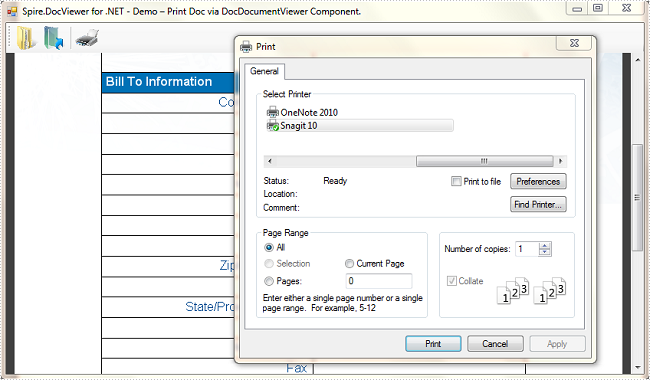
Run the program, open an existing Word file and click 'Print' button, you'll get a dialog as below:
Auto Filter is the most convenient way to select the data we want from a large amount of the data in an excel data table. With the help of Spire.XLS for .NET, developers can use the method ListObjects to filter the data and format it as a table. This article will focus on show you how to add table with filter in Excel.
Step 1: Create an excel document and load the Excel from file:
Workbook workbook = new Workbook();
workbook.LoadFromFile("DataTable.xlsx");
Step 2: Gets the first worksheet in the Excel file
Worksheet sheet = workbook.Worksheets[0];
Step 3: Create a List Object named in Table
sheet.ListObjects.Create("Table", sheet.Range[1, 1, sheet.LastRow, sheet.LastColumn]);
Step 4: Set the BuiltInTableStyle for List object.
sheet.ListObjects[0].BuiltInTableStyle = TableBuiltInStyles.TableStyleLight9;
Step 5: Save the document to file.
workbook.SaveToFile("Filter.xlsx", ExcelVersion.Version2010);
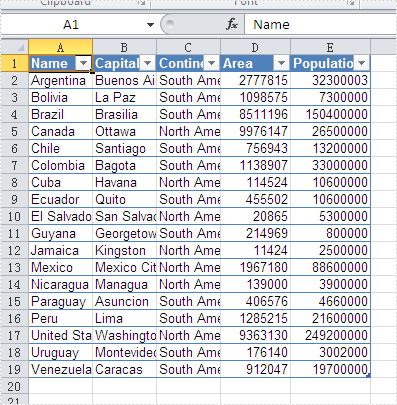
Effective screenshot after the date has been auto filtered:
Full codes:
namespace Excelfilter
{
    class Program
    {
        static void Main(string[] args)
        {
            Workbook workbook = new Workbook();
            workbook.LoadFromFile("DataTable.xlsx");

            Worksheet sheet = workbook.Worksheets[0];

            sheet.ListObjects.Create("Table", sheet.Range[1, 1, sheet.LastRow, sheet.LastColumn]);

            sheet.ListObjects[0].BuiltInTableStyle = TableBuiltInStyles.TableStyleLight9;

            workbook.SaveToFile("Filter.xlsx", ExcelVersion.Version2010);
        }
    }
}
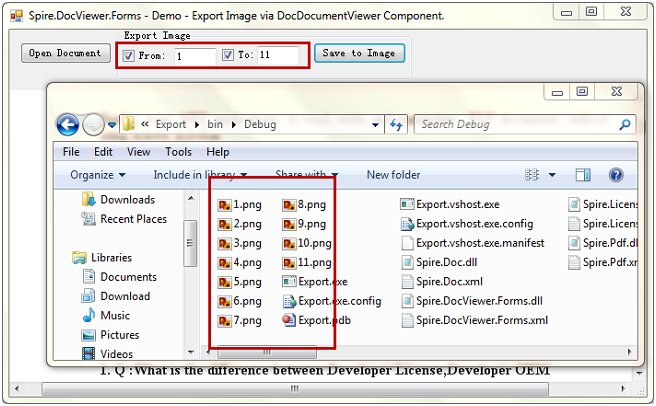
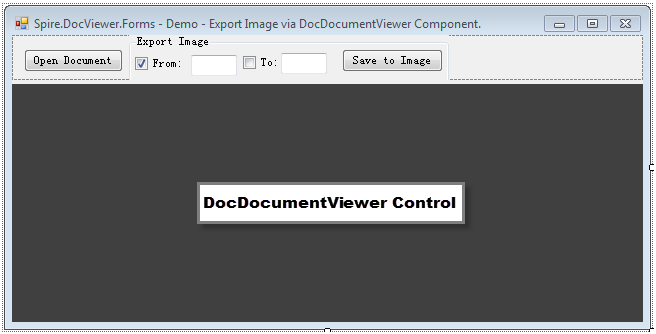
This article introduces how to export Word file pages as png images in Windows Forms Application using Spire.DocViewer. Let’s see detailed steps.
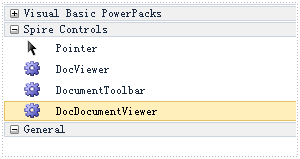
First, download Spire.DocViewer, add DocViewer Control to VS Toolbox.
Then create a Windows Forms Application, design your Form1 as below.
- Add 'Open Document' button to open an existing Word file.
- Add two check boxes and two text boxes, which are designed for choosing a range of pages to do the conversion.
- Add 'Save to Image' button to save selected pages as images.
- Drag 'DocDocumentViewer Control' into Form1, which is used to display Word document.
Code Snippet:
Step 1: Create an OpenFileDialog to select the correct file type that you want to load. If you try to open with another file type except .doc and .docx, error message 'Cannot detect current file type' will appear.
       private void btnOpen_Click(object sender, EventArgs e)
        {
            //Open a Doc Document
            OpenFileDialog dialog = new OpenFileDialog();
            dialog.Filter="Word97-2003 files(*.doc)|*.doc|Word2007-2010 files (*.docx)|*.docx|All files (*.*)|*.*";
            dialog.Title="Select a DOC file";
            dialog.Multiselect=false;
            dialog.InitialDirectory=System.IO.Path.GetFullPath(@"..\..\..\..\..\..\Data");

            DialogResult result = dialog.ShowDialog();
            if (result==DialogResult.OK)
            {
                try
                {
                    // Load doc document from file.
                    this.docDocumentViewer1.LoadFromFile(dialog.FileName);
                    this.textBox2.Text = this.docDocumentViewer1.PageCount.ToString();
                }
                catch (Exception ex)
                {
                    MessageBox.Show(ex.Message, "Error", MessageBoxButtons.OK, MessageBoxIcon.Error);
                }
            }
        }
Step 2: The code behind 'Save to Image' button enables users to export the specified pages (from textbox1 to textBox2) as Bitmapsource, then convert Bitmapsource to images.
        private void btnSaveImage_Click(object sender, EventArgs e)
        {
            this.Enabled = false;
            bitMap.Clear();
            try
            {
                if (ckbFrom.Checked && ckbTo.Checked)
                {
                    try
                    {
                        int startIndex = 0;
                        int.TryParse(textBox1.Text, out startIndex);
                        m_CurrentPageNum = startIndex;
                        int endIndex = 0;
                        int.TryParse(textBox2.Text, out endIndex);

                        // Exports the specified pages as Images
                        Image[] bitmapsource = this.docDocumentViewer1.SaveImage((ushort)(startIndex), (ushort)(endIndex));
                        SaveImageToFile(bitmapsource);
                    }
                    catch (Exception ex)
                    {
                        MessageBox.Show(ex.Message, "Error", MessageBoxButtons.OK, MessageBoxIcon.Error);
                    }
                }
                else if (ckbFrom.Checked && !ckbTo.Checked)
                {
                    try
                    {
                        int currepageIndex = 0;
                        int.TryParse(textBox1.Text, out currepageIndex);
                        m_CurrentPageNum = currepageIndex;
                        //Saves the specified page as Image
                        Image bitmapsource = this.docDocumentViewer1.SaveImage((ushort)(currepageIndex));
                        SaveImageToFile(new Image[] { bitmapsource });
                    }
                    catch (Exception ex)
                    {
                        MessageBox.Show(ex.Message, "Error", MessageBoxButtons.OK, MessageBoxIcon.Error);
                    }
                }
            }
            catch { };
            this.Enabled = true;
        }
Step 3: In step 2, SaveImageToFile() has been invoked. This part creates two customized methods SaveImageToFile() and WriteImageFile(), which is meant to save Bitmapsource as png images with the page index as its file name.
       private void SaveImageToFile(Image[] bitmpaSource)
        {
            int startIndex = 1;
            int.TryParse(textBox1.Text, out startIndex);
            foreach (Image bitmap in bitmpaSource)
            {
                WriteImageFile(bitmap, startIndex);
                startIndex++;
            }
        }

        // BitmapSource Write to File
        private void WriteImageFile(Image bitMapImg, int currentPageIndex)
        {
            try
            {
                if (bitMapImg != null)
                {
                    string FullfileName = currentPageIndex.ToString() + ".png";

                    bitMapImg.Save(FullfileName, System.Drawing.Imaging.ImageFormat.Png);
                    bitMap.Add(FullfileName, bitMapImg);
                }
            }
            catch (Exception ex)
            {
#if DEBUG
                System.Diagnostics.Debug.WriteLine(ex.Message + ex.Source);
#endif
            }
        }
Debug the code, you'll get a Windows application as designed. Here, I open a sample Word file and select page 1 to page 11, selected pages will be saved as images in bin folder by clicking 'Save to Image'.