
Knowledgebase (2370)
Children categories
Setting up the page layout in Excel is an important step to make your worksheets look polished and professional. Whether you’re printing a report or sharing it digitally, customizing options like margins, orientation, paper size, and scaling helps ensure your data is presented clearly and effectively. In this article, you will learn how to programmatically set page setup options in Excel in Java using Spire.XLS for Java.
- Set Page Margins in Excel in Java
- Set Page Orientation in Excel in Java
- Set Paper Size in Excel in Java
- Set Print Area in Excel in Java
- Set Scaling Factor in Excel in Java
- Set FitToPages Options in Excel in Java
- Set Headers and Footers in Excel in Java
Install Spire.XLS for Java
First of all, you're required to add the Spire.Xls.jar file as a dependency in your Java program. The JAR file can be downloaded from this link. If you use Maven, you can easily import the JAR file in your application by adding the following code to your project's pom.xml file.
<repositories>
    <repository>
        <id>com.e-iceblue</id>
        <name>e-iceblue</name>
        <url>https://repo.e-iceblue.com/nexus/content/groups/public/</url>
    </repository>
</repositories>
<dependencies>
    <dependency>
        <groupId>e-iceblue</groupId>
        <artifactId>spire.xls</artifactId>
        <version>16.6.5</version>
    </dependency>
</dependencies>
Set Page Margins in Excel in Java
The PageSetup class in Spire.XLS for Java allows you to customize page setup options for Excel worksheets. It provides methods like setTopMargin(), setBottomMargin(), setLeftMargin(), setRightMargin(), setHeaderMarginInch(), and setFooterMarginInch(), enabling you to adjust the top, bottom, left, right, header, and footer margins of a worksheet. The detailed steps are as follows.
- Create an object of the Workbook class.
- Load an Excel file using the Workbook.loadFromFile() method.
- Get a specific worksheet using the Workbook.getWorksheets().get(index) method.
- Access the PageSetup object of the worksheet using the Worksheet.getPageSetup() method.
- Set the top, bottom, left, right, header, and footer margins using the PageSetup.setTopMargin(), PageSetup.setBottomMargin(), PageSetup.setLeftMargin(), PageSetup.setRightMargin(), PageSetup.setHeaderMarginInch(), and PageSetup.setFooterMarginInch() methods.
- Save the modified workbook to a new file using the Workbook.saveToFile() method.
- Java
import com.spire.xls.ExcelVersion;
import com.spire.xls.PageSetup;
import com.spire.xls.Workbook;
import com.spire.xls.Worksheet;

public class PageMargins {
    public static void main(String[] args) {
        // Create a Workbook object
        Workbook workbook = new Workbook();
        // Load an Excel file
        workbook.loadFromFile("Sample.xlsx");

        // Get the first worksheet
        Worksheet sheet = workbook.getWorksheets().get(0);

        // Get the PageSetup object of the worksheet
        PageSetup pageSetup = sheet.getPageSetup();

        // Set top, bottom, left, and right margins for the worksheet
        // The measure of the unit is Inch (1 inch = 2.54 cm)
        pageSetup.setTopMargin(1);
        pageSetup.setBottomMargin(1);
        pageSetup.setLeftMargin(1);
        pageSetup.setRightMargin(1);
        pageSetup.setHeaderMarginInch(1);
        pageSetup.setFooterMarginInch(1);

        // Save the modified workbook to a new file
        workbook.saveToFile("SetPageMargins.xlsx", ExcelVersion.Version2016);
        workbook.dispose();
    }
}

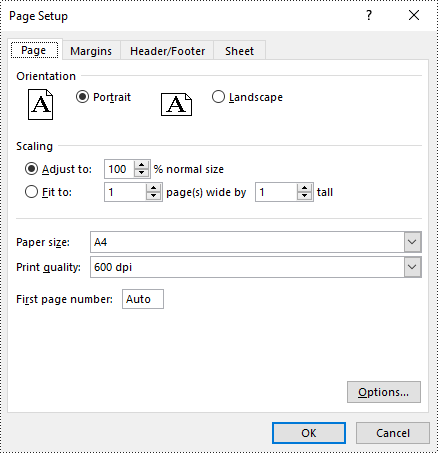
Set Page Orientation in Excel in Java
The PageSetup.setOrientation() method allows you to specify the page orientation for printing. You can choose between two options: portrait mode or landscape mode. The detailed steps are as follows.
- Create an object of the Workbook class.
- Load an Excel file using the Workbook.loadFromFile() method.
- Get a specific worksheet using the Workbook.getWorksheets().get(index) method.
- Access the PageSetup object of the worksheet using the Worksheet.getPageSetup() method.
- Set the page orientation using the PageSetup.setOrientation() method.
- Save the modified workbook to a new file using the Workbook.saveToFile() method.
- Java
import com.spire.xls.*;

public class PageOrientation {
    public static void main(String[] args) {
        // Create a Workbook object
        Workbook workbook = new Workbook();
        // Load an Excel file
        workbook.loadFromFile("Sample.xlsx");

        // Get the first worksheet
        Worksheet sheet = workbook.getWorksheets().get(0);

        // Get the PageSetup object of the worksheet
        PageSetup pageSetup = sheet.getPageSetup();

        pageSetup.setOrientation(PageOrientationType.Landscape);

        // Save the modified workbook to a new file
        workbook.saveToFile("SetPageOrientation.xlsx", ExcelVersion.Version2016);
        workbook.dispose();
    }
}

Set Paper Size in Excel in Java
The PageSetup.setPaperSize() method enables you to select from a variety of paper sizes for printing your worksheet. These options include A3, A4, A5, B4, B5, letter, legal, tabloid, and more. The detailed steps are as follows.
- Create an object of the Workbook class.
- Load an Excel file using the Workbook.loadFromFile() method.
- Get a specific worksheet using the Workbook.getWorksheets().get(index) method.
- Access the PageSetup object of the worksheet using the Worksheet.getPageSetup() method.
- Set the paper size using the PageSetup.setPaperSize() method.
- Save the modified workbook to a new file using the Workbook.saveToFile() method.
- Java
import com.spire.xls.*;

public class PaperSize {
    public static void main(String[] args) {
        // Create a Workbook object
        Workbook workbook = new Workbook();
        // Load an Excel file
        workbook.loadFromFile("Sample.xlsx");

        // Get the first worksheet
        Worksheet sheet = workbook.getWorksheets().get(0);

        // Get the PageSetup object of the worksheet
        PageSetup pageSetup = sheet.getPageSetup();

        // Set the paper size to A4
        pageSetup.setPaperSize(PaperSizeType.PaperA4);

        // Save the modified workbook to a new file
        workbook.saveToFile("SetPaperSize.xlsx", ExcelVersion.Version2016);
        workbook.dispose();
    }
}
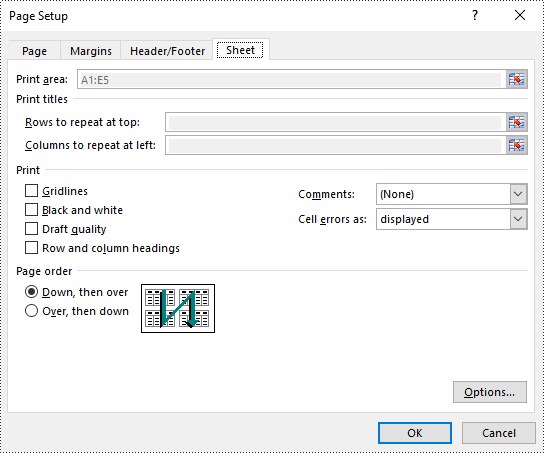
Set Print Area in Excel in Java
You can define the specific area to be printed by using the PageSetup.setPrintArea() method. The detailed steps are as follows.
- Create an object of the Workbook class.
- Load an Excel file using the Workbook.loadFromFile() method.
- Get a specific worksheet using the Workbook.getWorksheets().get(index) method.
- Access the PageSetup object of the worksheet using the Worksheet.getPageSetup() method.
- Set the print area using the PageSetup.setPringArea() method.
- Save the modified workbook to a new file using the Workbook.saveToFile() method.
- Java
import com.spire.xls.ExcelVersion;
import com.spire.xls.PageSetup;
import com.spire.xls.Workbook;
import com.spire.xls.Worksheet;

public class PrintArea {
    public static void main(String[] args) {
        // Create a Workbook object
        Workbook workbook = new Workbook();
        // Load an Excel file
        workbook.loadFromFile("Sample.xlsx");

        // Get the first worksheet
        Worksheet sheet = workbook.getWorksheets().get(0);

        // Get the PageSetup object of the worksheet
        PageSetup pageSetup = sheet.getPageSetup();

        // Set the print area of the worksheet to "A1:E5"
        pageSetup.setPrintArea("A1:E5");

        // Save the modified workbook to a new file
        workbook.saveToFile("SetPrintArea.xlsx", ExcelVersion.Version2016);
        workbook.dispose();
    }
}
Set Scaling Factor in Excel in Java
To scale the content of your worksheet to a specific percentage of its original size, you can use the PageSetup.setZoom() method. The detailed steps are as follows.
- Create an object of the Workbook class.
- Load an Excel file using the Workbook.loadFromFile() method.
- Get a specific worksheet using the Workbook.getWorksheets().get(index) method.
- Access the PageSetup object of the worksheet using the Worksheet.getPageSetup() method.
- Set the scaling factor using the PageSetup.setZoom() method.
- Save the modified workbook to a new file using the Workbook.saveToFile() method.
- Java
import com.spire.xls.ExcelVersion;
import com.spire.xls.PageSetup;
import com.spire.xls.Workbook;
import com.spire.xls.Worksheet;

public class ScalingFactor {
    public static void main(String[] args) {
        // Create a Workbook object
        Workbook workbook = new Workbook();
        // Load an Excel file
        workbook.loadFromFile("Sample.xlsx");

        // Get the first worksheet
        Worksheet sheet = workbook.getWorksheets().get(0);

        // Get the PageSetup object of the worksheet
        PageSetup pageSetup = sheet.getPageSetup();

        // Set the scaling factor of the worksheet to 90%
        pageSetup.setZoom(90);

        // Save the modified workbook to a new file
        workbook.saveToFile("SetScalingFactor.xlsx", ExcelVersion.Version2016);
        workbook.dispose();
    }
}

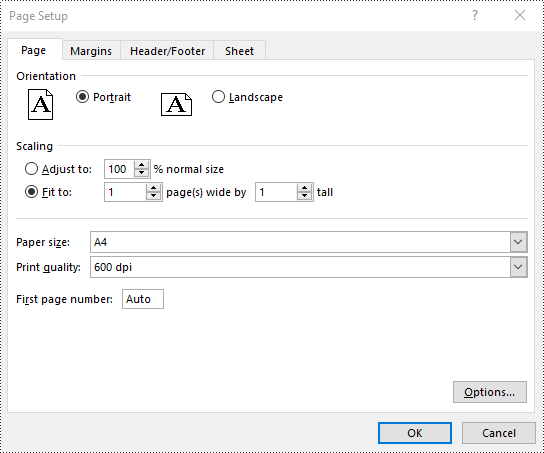
Set FitToPages Options in Excel in Java
Spire.XLS also provides the ability to adjust your worksheet content to fit a specific number of pages by using the PageSetup.setFitToPagesTall() and PageSetup.setFitToPagesWide() methods. The detailed steps are as follows.
- Create an object of the Workbook class.
- Load an Excel file using the Workbook.loadFromFile() method.
- Get a specific worksheet using the Workbook.getWorksheets().get(index) method.
- Access the PageSetup object of the worksheet using the Worksheet.getPageSetup() method.
- Fit the content of the worksheet to one page using the PageSetup.setFitToPagesTall() and PageSetup.setFitToPagesWide() methods.
- Save the modified workbook to a new file using the Workbook.saveToFile() method.
- Java
import com.spire.xls.ExcelVersion;
import com.spire.xls.PageSetup;
import com.spire.xls.Workbook;
import com.spire.xls.Worksheet;

public class FitToPages {
    public static void main(String[] args) {
        // Create a Workbook object
        Workbook workbook = new Workbook();
        // Load an Excel file
        workbook.loadFromFile("Sample.xlsx");

        // Get the first worksheet
        Worksheet sheet = workbook.getWorksheets().get(0);

        // Get the PageSetup object of the worksheet
        PageSetup pageSetup = sheet.getPageSetup();

        // Fit the content of the worksheet within one page vertically (i.e., all rows will fit on a single page)
        pageSetup.setFitToPagesTall(1);
        // Fit the content of the worksheet within one page horizontally (i.e., all columns will fit on a single page)
        pageSetup.setFitToPagesWide(1);

        // Save the modified workbook to a new file
        workbook.saveToFile("FitToPages.xlsx", ExcelVersion.Version2016);
        workbook.dispose();
    }
}
Set Headers and Footers in Excel in Java
For instructions on setting headers and footers in Excel, please refer to this article: Java: Add Headers and Footers to Excel.
Apply for a Temporary License
If you'd like to remove the evaluation message from the generated documents, or to get rid of the function limitations, please request a 30-day trial license for yourself.
Python: Insert, Extract, or Remove OLE Objects in PowerPoint Presentations
2024-12-06 01:03:43 Written by KoohjiIncorporating external content into PowerPoint presentations can significantly enhance their impact and relevance. OLE (Object Linking and Embedding) objects provide an efficient way to embed or link various types of external files, such as Excel spreadsheets, Word documents, and PDF files, directly into PowerPoint slides. This functionality not only allows for seamless integration of dynamic data but also enables users to maintain a live connection to the original files. In this article, we will introduce how to insert, extract, or remove OLE objects in PowerPoint presentations in Python using Spire.Presentation for Python.
- Insert OLE Objects into a PowerPoint Presentation
- Extract OLE Objects from a PowerPoint Presentation
- Remove OLE Objects from a PowerPoint Presentation
Install Spire.Presentation for Python
This scenario requires Spire.Presentation for Python and plum-dispatch v1.7.4. They can be easily installed in your Windows through the following pip command.
pip install Spire.Presentation
If you are unsure how to install, please refer to this tutorial: How to Install Spire.Presentation for Python on Windows
Insert OLE Objects into a PowerPoint Presentation in Python
Spire.Presentation for Python provides the ISlide.Shapes.AppendOleObject() method, which allows you to insert various external files (such as Word documents, Excel spreadsheets, PDF files, PowerPoint presentations, and ZIP archives) as OLE objects into PowerPoint slides. The detailed steps are as follows.
- Create an object of the Presentation class.
- Access the desired slide using the Presentation.Slides[index] property.
- Add an OLE object to the slide using the ISlide.Shapes.AppendOleObject() method.
- Set the icon for the OLE object using the IOleObject.SubstituteImagePictureFillFormat.Picture.EmbedImage property.
- Specify the object type using the IOleObject.ProgId property.
- Save the presentation using the Presentation.SaveToFile() method.
- Python
from spire.presentation.common import *
from spire.presentation import *

# Create an object of the Presentation class
ppt = Presentation()

try:
    # Get the first slide
    slide = ppt.Slides[0]

    # Initialize the top position for the first object
    currentTop = 60
    # Spacing between OLE objects
    verticalSpacing = 20

    # Add an Excel icon to the presentation
    excelImageStream = Stream("icons/excel-icon.png")
    oleImage = ppt.Images.AppendStream(excelImageStream)
    # Define the position of the Excel OLE object
    excelRec = RectangleF.FromLTRB(100, currentTop, oleImage.Width + 100, currentTop + oleImage.Height)
    # Add an Excel file to the slide as an OLE object
    oleStream = Stream("Budget.xlsx")
    oleObject = slide.Shapes.AppendOleObject("excel", oleStream, excelRec)
    oleObject.SubstituteImagePictureFillFormat.Picture.EmbedImage = oleImage
    oleObject.ProgId = "Excel.Sheet.12"

    # Update the top position for the next object
    currentTop += oleImage.Height + verticalSpacing

    # Add a Word icon to the presentation
    wordImageStream = Stream("icons/word-icon.png")
    wordOleImage = ppt.Images.AppendStream(wordImageStream)
    # Define the position of the Word OLE object
    wordRec = RectangleF.FromLTRB(100, currentTop, wordOleImage.Width + 100, currentTop + wordOleImage.Height)
    # Add a Word file to the slide as an OLE object
    wordStream = Stream("Document.docx")
    wordOleObject = slide.Shapes.AppendOleObject("word", wordStream, wordRec)
    wordOleObject.SubstituteImagePictureFillFormat.Picture.EmbedImage = wordOleImage
    wordOleObject.ProgId = "Word.Document.12"

    # Update the top position for the next object
    currentTop += wordOleImage.Height + verticalSpacing

    # Add a PDF icon to the presentation
    pdfImageStream = Stream("icons/pdf-icon.png")
    pdfOleImage = ppt.Images.AppendStream(pdfImageStream)
    # Define the position of the PDF OLE object
    pdfRec = RectangleF.FromLTRB(100, currentTop, pdfOleImage.Width + 100, currentTop + pdfOleImage.Height)
    # Add a PDF file to the slide as an OLE object
    pdfStream = Stream("Report.pdf")
    pdfOleObject = slide.Shapes.AppendOleObject("pdf", pdfStream, pdfRec)
    pdfOleObject.SubstituteImagePictureFillFormat.Picture.EmbedImage = pdfOleImage
    pdfOleObject.ProgId = "Acrobat.Document"

    # Update the top position for the next object
    currentTop += pdfOleImage.Height + verticalSpacing

    # Add a zip package icon to the presentation
    zipImageStream = Stream("icons/zip-icon.png")
    zipOleImage = ppt.Images.AppendStream(zipImageStream)
    # Define the position of the zip package OLE object
    zipRec = RectangleF.FromLTRB(100, currentTop, zipOleImage.Width + 100, currentTop + zipOleImage.Height)
    # Add a zip file to the slide as an OLE object
    zipOleStream = Stream("Example.zip")
    zipOleObject = slide.Shapes.AppendOleObject("zip", zipOleStream, zipRec)
    zipOleObject.ProgId = "Package"
    zipOleObject.SubstituteImagePictureFillFormat.Picture.EmbedImage = zipOleImage

    # Save the PowerPoint presentation
    ppt.SaveToFile("AddOLEObjects.pptx", FileFormat.Pptx2010)

finally:
    excelImageStream.Close()
    oleStream.Close()
    wordImageStream.Close()
    wordStream.Close()
    pdfImageStream.Close()
    pdfStream.Close()
    zipImageStream.Close()
    zipOleStream.Close()
    ppt.Dispose()

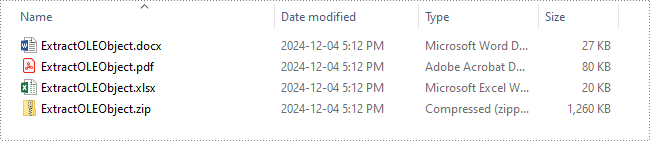
Extract OLE Objects from a PowerPoint Presentation in Python
Spire.Presentation for Python enables you to extract the embedded OLE objects from a PowerPoint presentation and save them for further use. The detailed steps are as follows.
- Create an object of the Presentation class.
- Load a PowerPoint presentation using the Presentation.LoadFromFile() method.
- Iterate through all slides in the presentation and all shapes on each slide.
- Check if the shape is an OLE object.
- Get the data of the OLE object using the IOleObject.Data property.
- Identify the type of the OLE object using the IOleObject.ProgId property and save the OLE object data to its original format.
- Python
from spire.presentation.common import *
from spire.presentation import *

# Create an object of the Presentation class
presentation = Presentation()

try:
    # Load the PowerPoint presentation
    presentation.LoadFromFile("AddOLEObjects.pptx")

    # Define output file paths for different types of OLE objects
    output_files = {
        "Acrobat.Document": "ExtractedOLEs/ExtractOLEObject.pdf",
        "Excel.Sheet.12": "ExtractedOLEs/ExtractOLEObject.xlsx",
        "Word.Document.12": "ExtractedOLEs/ExtractOLEObject.docx",
        "Package": "ExtractedOLEs/ExtractOLEObject.zip"
    }

    # Iterate through each slide in the presentation
    for slide in presentation.Slides:
        # Iterate through each shape in the slide
        for shape in slide.Shapes:
            # Check if the shape is an OLE object
            if isinstance(shape, IOleObject):
                ole_object = shape
                # Retrieve the data of the OLE object
                ole_data_stream = ole_object.Data

                # Determine the appropriate output file based on the OLE object's ProgId
                output_file = output_files.get(ole_object.ProgId)
                if output_file:
                    # Save the OLE object data to the corresponding output file
                    ole_data_stream.Save(output_file)
                    # Close stream
                    ole_data_stream.Close()

finally:
    presentation.Dispose()
Remove OLE Objects from a PowerPoint Presentation in Python
If you need to remove unwanted OLE objects from a PowerPoint presentation to streamline your slides, you can use the ISlide.Shapes.Remove() method. The detailed steps are as follows.
- Create an object of the Presentation class.
- Load a PowerPoint presentation using the Presentation.LoadFromFile() method.
- Iterate through all slides in the presentation and all shapes on each slide.
- Check if the shape is an OLE object.
- Store the OLE objects in a list and then remove them from the slide using the ISlide.Shapes.Remove() method.
- Save the presentation using the Presentation.SaveToFile() method.
- Python
from spire.presentation.common import *
from spire.presentation import *

# Create an object of the Presentation class
presentation = Presentation()

try:
    # Load the PowerPoint presentation
    presentation.LoadFromFile("AddOLEObjects.pptx")

    # Iterate through each slide in the presentation
    for slide in presentation.Slides:
        # Create a list to store shapes that are OLE objects
        ole_shapes = []

        # Iterate through each shape in the slide
        for shape in slide.Shapes:
            # Check if the shape is an OLE object
            if isinstance(shape, IOleObject):
                ole_shapes.append(shape)

        # Remove all OLE objects from the slide
        for ole_object in ole_shapes:
            slide.Shapes.Remove(ole_object)

    # Save the modified PowerPoint presentation
    presentation.SaveToFile("RemoveOLEObjects.pptx", FileFormat.Pptx2010)

finally:
    presentation.Dispose()
Apply for a Temporary License
If you'd like to remove the evaluation message from the generated documents, or to get rid of the function limitations, please request a 30-day trial license for yourself.
Charts in Excel are powerful tools that transform raw data into visual insights, making it easier to identify trends and patterns. Often, you may need to manage or adjust these charts to better suit your needs. For instance, you might need to extract the data behind a chart for further analysis, resize a chart to fit your layout, move a chart to a more strategic location, or remove outdated charts to keep your workbook organized and clutter-free. In this article, you will learn how to extract, resize, move, and remove charts in Excel in Python using Spire.XLS for Python.
- Extract the Data Source of a Chart in Excel
- Resize a Chart in Excel
- Move a Chart in Excel
- Remove a Chart from Excel
Install Spire.XLS for Python
This scenario requires Spire.XLS for Python and plum-dispatch v1.7.4. They can be easily installed in your Windows through the following pip command.
pip install Spire.XLS
If you are unsure how to install, please refer to this tutorial: How to Install Spire.XLS for Python on Windows
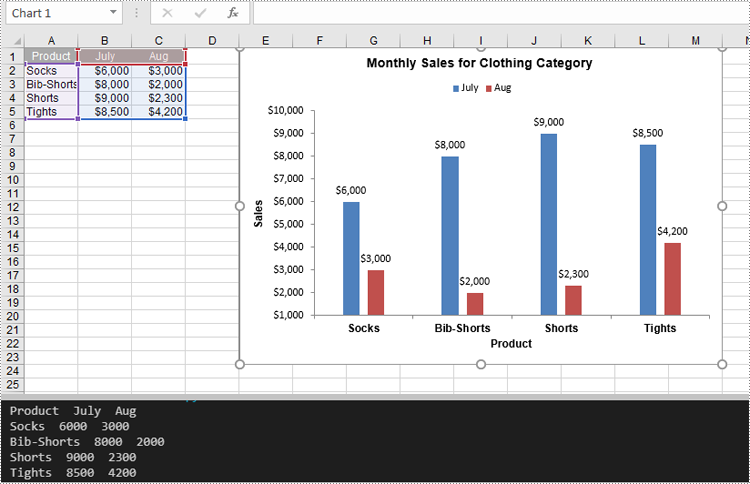
Extract the Data Source of a Chart in Excel in Python
Spire.XLS for Python provides the Chart.DataRange property, which allows you to define or retrieve the cell range used as the data source for a chart. After retrieving this range, you can access the data it contains for further processing or analysis. The detailed steps are as follows.
- Create an object of the Workbook class.
- Load an Excel file using the Workbook.LoadFromFile() method.
- Access the worksheet containing the chart using the Workbook.Worksheets[index] property.
- Get the chart using the Worksheet.Charts[index] property.
- Get the cell range that is used as the data source of the chart using the Chart.DataRange property.
- Loop through the rows and columns in the cell range and get the data of each cell.
- Python
from spire.xls import *
from spire.xls.common import *

# Create a Workbook object
workbook = Workbook()
# Load an Excel file
workbook.LoadFromFile("ChartSample.xlsx")

# Get the worksheet containing the chart
sheet = workbook.Worksheets[0]

# Get the chart
chart = sheet.Charts[0]

# Get the cell range that the chart uses
cellRange = chart.DataRange

# Iterate through the rows and columns in the cell range
for i in range(len(cellRange.Rows)):
    for j in range(len(cellRange.Rows[i].Columns)):
        # Get the data of each cell
        print(cellRange[i + 1, j + 1].Value + "  ", end='')

    print("")

workbook.Dispose()
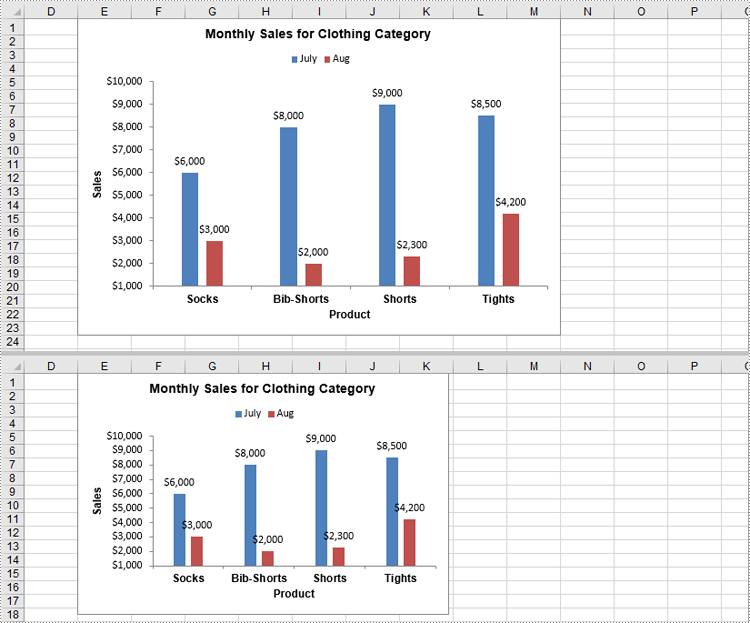
Resize a Chart in Excel in Python
Resizing a chart allows you to adjust its dimensions to fit specific areas of your worksheet or enhance its readability. With Spire.XLS for Python, you can adjust the chart's dimensions using the Chart.Width and Chart.Height properties. The detailed steps are as follows.
- Create an object of the Workbook class.
- Load an Excel file using the Workbook.LoadFromFile() method.
- Access the worksheet containing the chart using the Workbook.Worksheets[index] property.
- Get the chart using the Worksheet.Charts[index] property.
- Adjust the chart’s dimensions using the Chart.Width and Chart.Height properties.
- Save the result file using the Workbook.SaveToFile() method.
- Python
from spire.xls import *
from spire.xls.common import *

# Create a Workbook object
workbook = Workbook()
# Load an Excel file
workbook.LoadFromFile("ChartSample.xlsx")

# Get the worksheet containing the chart
sheet = workbook.Worksheets[0]

# Get the chart
chart = sheet.Charts[0]

# Resize the chart
chart.Width = 450
chart.Height = 300

# Save the result file
workbook.SaveToFile("ResizeChart.xlsx", ExcelVersion.Version2013)
workbook.Dispose()
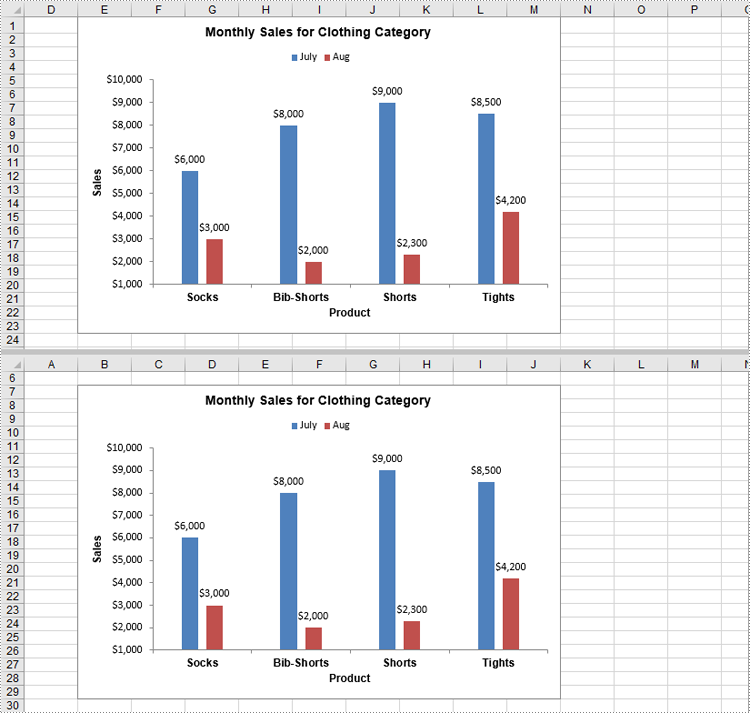
Move a Chart in Excel in Python
Moving a chart lets you reposition it for better alignment or to relocate it to another sheet. You can use the Chart.LeftColumn, Chart.TopRow, Chart.RightColumn, and Chart.BottomRow properties to specify the new position of the chart. The detailed steps are as follows.
- Create an object of the Workbook class.
- Load an Excel file using the Workbook.LoadFromFile() method.
- Access the worksheet containing the chart using the Workbook.Worksheets[index] property.
- Get the chart using the Worksheet.Charts[index] property.
- Set the new position of the chart using the Chart.LeftColumn, Chart.TopRow, Chart.RightColumn, and Chart.BottomRow properties.
- Save the result file using the Workbook.SaveToFile() method.
- Python
from spire.xls import *
from spire.xls.common import *

# Create a Workbook object
workbook = Workbook()
# Load an Excel file
workbook.LoadFromFile("ChartSample.xlsx")

# Get the worksheet containing the chart
sheet = workbook.Worksheets[0]

# Get the chart
chart = sheet.Charts[0]

# Set the new position of the chart
chart.LeftColumn = 1
chart.TopRow = 7
chart.RightColumn = 9
chart.BottomRow = 30

# Save the result file
workbook.SaveToFile("MoveChart.xlsx", ExcelVersion.Version2013)
workbook.Dispose()
Remove a Chart from Excel in Python
Removing unnecessary or outdated charts from your worksheet helps keep your document clean and organized. In Spire.XLS for Python, you can use the Chart.Remove() method to delete a chart from an Excel worksheet. The detailed steps are as follows.
- Create an object of the Workbook class.
- Load an Excel file using the Workbook.LoadFromFile() method.
- Access the worksheet containing the chart using the Workbook.Worksheets[index] property.
- Get the chart using the Worksheet.Charts[index] property.
- Remove the chart using the Chart.Remove() method.
- Save the result file using the Workbook.SaveToFile() method.
- Python
from spire.xls import *
from spire.xls.common import *

# Create a Workbook object
workbook = Workbook()
# Load an Excel file
workbook.LoadFromFile("ChartSample.xlsx")

# Get the worksheet containing the chart
sheet = workbook.Worksheets[0]

# Get the chart
chart = sheet.Charts[0]

# Remove the chart
chart.Remove()

# Save the result file
workbook.SaveToFile("RemoveChart.xlsx", ExcelVersion.Version2013)
workbook.Dispose()
Apply for a Temporary License
If you'd like to remove the evaluation message from the generated documents, or to get rid of the function limitations, please request a 30-day trial license for yourself.
