HTML, the backbone of web development, is widely used to build and present content on the web. While HTML is great for creating dynamic and interactive web pages, it is not well suited for creating professional-looking documents. When faced with such requirements, converting HTML to Word format is an ideal solution.
By implementing the Html to Word conversion, you can preserve the structure and content of the HTML while applying appropriate formatting and styles in Word to ensure the document look more professional. In this article, you will learn how to convert HTML to Word in React using Spire.Doc for JavaScript.
Install Spire.Doc for JavaScript
To get started with converting Word documents to PDF in a React application, you can either download Spire.Doc for JavaScript from our website or install it via npm with the following command:
npm i spire.officeThe downloaded product package integrates Spire.Doc for JavaScript, Spire.XLS for JavaScript, Spire.PDF for JavaScript, and Spire.Presentation for JavaScript. To use the features of Spire.Doc for JavaScript, you need to copy the corresponding files (spire.doc.js, Spire.Doc.Wasm.zip, spire.common.js, Spire.Common.Wasm.zip, and the _framework folder) to the public folder of your project. To ensure proper text rendering, you can add relevant font files with a custom path. In the following example, the font is added to the path: public\static\font.
For more details, refer to the documentation: How to Integrate Spire.Doc for JavaScript in a React Project
Convert an HTML File to Word with JavaScript in React
With Spire.Doc for JavaScript, you can simply load an HTML file and then save it as a Word Doc or Docx format through the Document.SaveToFile() function. The following are the main steps to convert an HTML file to Word in JavaScript.
- Load the font file to ensure correct text rendering.
- Create a new document using the new wasmModule.Document() function.
- Load the HTML file using the Document.LoadFromFile() function.
- Save the HTML file to a Word file using the Document.SaveToFile() function.
- JavaScript
import React, { useState, useEffect } from 'react';
function App() {
const [wasmModule, setWasmModule] = useState(null);
// Load Spire.Doc
useEffect(() => {
(async () => {
try {
const publicUrl = process.env.PUBLIC_URL || '';
const spireModule = await import(/* webpackIgnore: true */ `${publicUrl}/spire.doc.js`);
const rawModule = spireModule.default || spireModule;
window.wasmModule = typeof rawModule === 'function'
? await rawModule({ locateFile: p => p.endsWith('.wasm') ? `${publicUrl}/${p}` : p })
: rawModule;
setWasmModule(window.wasmModule);
} catch (error) {
console.error('Failed to load spire.doc.js WASM module:', error);
}
})();
}, []);
// Function to convert HTML file to Word
const HtmlToWord = async () => {
const wasmModule = window.wasmModule.spiredoc;
if (wasmModule) {
// Load the font files into the virtual file system (VFS)
await window.spire.FetchFileToVFS('CALIBRI.ttf', '/Library/Fonts/', `${process.env.PUBLIC_URL}/static/font/`);
// Fetch the input file and add it to the VFS
const inputFileName = 'sample1.html';
await window.spire.FetchFileToVFS(inputFileName, '', `${process.env.PUBLIC_URL}/static/data/`);
// Create a new document
const doc = new wasmModule.Document();
// Load the word file
doc.LoadFromFile({ fileName: inputFileName, fileFormat: wasmModule.FileFormat.Html, validationType: wasmModule.XHTMLValidationType.None });
// Save the HTML file to a Word file
const outputFileName = 'HtmlToWord.docx';
doc.SaveToFile({ fileName: outputFileName, fileFormat: wasmModule.FileFormat.Docx });
const modifiedFileArray = window.dotnetRuntime.Module.FS.readFile(outputFileName);
const modifiedFile = new Blob([modifiedFileArray], { type: "application/vnd.openxmlformats-officedocument.wordprocessingml.document" });
// Create download link
const url = URL.createObjectURL(modifiedFile);
const a = document.createElement('a');
a.href = url;
a.download = outputFileName;
document.body.appendChild(a);
a.click();
document.body.removeChild(a);
URL.revokeObjectURL(url);
// dispose
doc.Dispose();
}
};
return (
<div style={{ textAlign: 'center', height: '300px' }}>
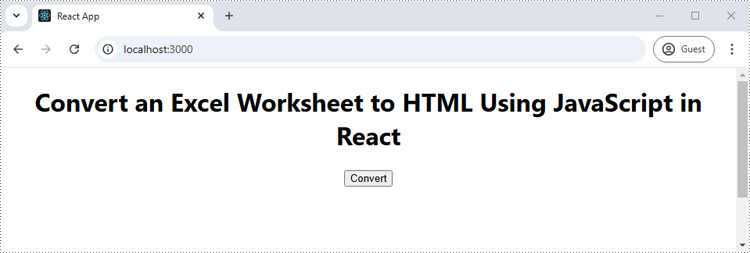
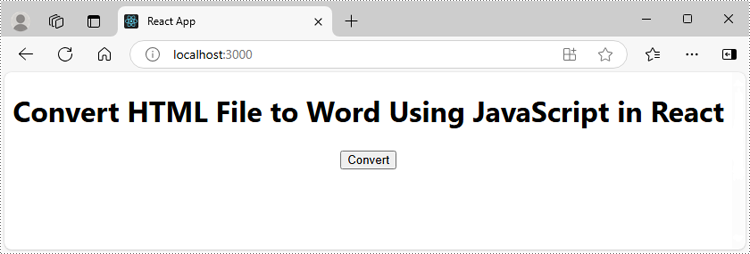
<h1>Convert HTML File to Word Using JavaScript in React</h1>
<button onClick={HtmlToWord} disabled={!wasmModule}>
Convert
</button>
</div>
);
}
export default App;Run the code to launch the React app at localhost:3000. Once it's running, click on the "Convert" button to download the Word file generated from an HTML file:
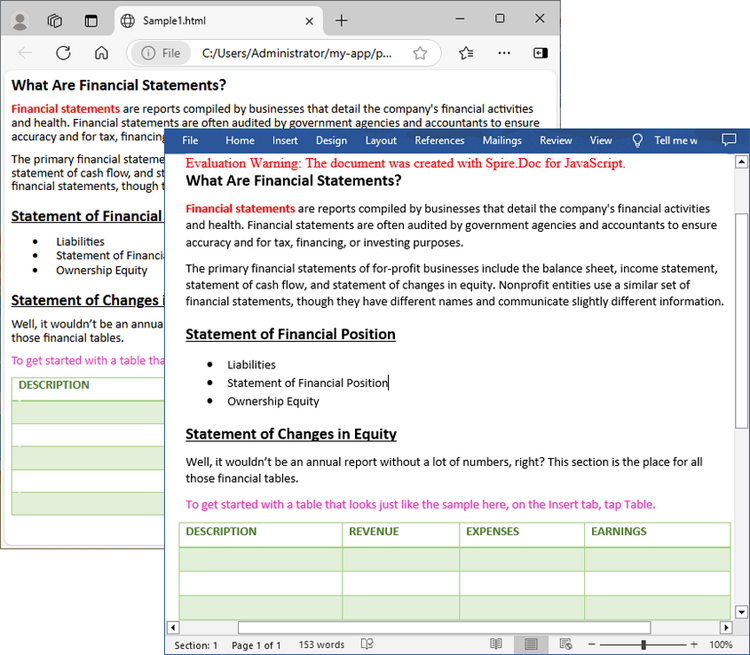
Below is the input HTML file and the converted Word file:
Convert an HTML String to Word with JavaScript in React
You can also convert an HTML string to Word by calling the Paragraph.AppendHTML() function to add the HTML string to a paragraph in Word and then save the Word document. The following are the main steps to convert an HTML string to a Word file in JavaScript.
- Load the font file to ensure correct text rendering.
- Specify the HTML string
- Create a new document using the new wasmModule.Document() function.
- Add a new section using the Document.AddSection() function.
- Add a paragraph to the section using the Section.AddParagraph() function.
- Append the HTML string to the paragraph using the Paragraph.AppendHTML() function.
- Save the Word document using the Document.SaveToFile() function.
- JavaScript
import React, { useState, useEffect } from 'react';

function App() {
  const [wasmModule, setWasmModule] = useState(null);
  // Load Spire.Doc
  useEffect(() => {
    (async () => {
      try {
        const publicUrl = process.env.PUBLIC_URL || '';
        const spireModule = await import(/* webpackIgnore: true */ `${publicUrl}/spire.doc.js`);
        const rawModule = spireModule.default || spireModule;
        window.wasmModule = typeof rawModule === 'function'
          ? await rawModule({ locateFile: p => p.endsWith('.wasm') ? `${publicUrl}/${p}` : p })
          : rawModule;
        setWasmModule(window.wasmModule);
      } catch (error) {
        console.error('Failed to load spire.doc.js WASM module:', error);
      }
    })();
  }, []);

  // Function to convert HTML string to Word
  const HtmlStringToWord = async () => {
    const wasmModule = window.wasmModule.spiredoc;
    if (wasmModule) {
      // Load the font files into the virtual file system (VFS)
      await window.spire.FetchFileToVFS('CALIBRI.ttf', '/Library/Fonts/', `${process.env.PUBLIC_URL}/static/font/`);

      // Specify the HTML string
      let HTML = "<html><head><title>HTML to Word Example</title><style>, body {font-family: 'Calibri';}, h1 {color: #FF5733; font-size: 24px; margin-bottom: 20px;}, p {color: #333333; font-size: 16px; margin-bottom: 10px;}";
      HTML += "ul {list-style-type: disc; margin-left: 20px; margin-bottom: 15px;}, li {font-size: 14px; margin-bottom: 5px;}, table {border-collapse: collapse; width: 100%; margin-bottom: 20px;}";
      HTML += "th, td {border: 1px solid #CCCCCC; padding: 8px; text-align: left;}, th {background-color: #F2F2F2; font-weight: bold;}, td {color: #0000FF;}</style></head>";
      HTML += "<body><h1>This is a Heading</h1><p>This is a paragraph demonstrating the conversion of HTML to Word document.</p><p>Here's an example of an unordered list:</p><ul><li>Item 1</li><li>Item 2</li><li>Item 3</li></ul>";
      HTML += "<p>Here's a table:</p><table><tr><th>Product</th><th>Quantity</th><th>Price</th></tr><tr><td>Jacket</td><td>30</td><td>$150</td></tr><tr><td>Sweater</td><td>25</td><td>$99</td></tr></table></body></html>";

      // Create a new document
      const doc = new wasmModule.Document();

      // Add a section to the document
      let section = doc.AddSection();

      // Add a paragraph to the section
      let paragraph = section.AddParagraph();

      // Append the HTML string to the paragraph
      paragraph.AppendHTML(HTML.toString('utf8', 0, HTML.length));

      // Specify the output file path
      const outputFileName = 'HtmlStringToWord.docx';

      // Save the Word file
      doc.SaveToFile({ fileName: outputFileName, fileFormat: wasmModule.FileFormat.Docx2016 });

      const modifiedFileArray = window.dotnetRuntime.Module.FS.readFile(outputFileName);
      const modifiedFile = new Blob([modifiedFileArray], { type: "application/vnd.openxmlformats-officedocument.wordprocessingml.document" });

      // Create download link
      const url = URL.createObjectURL(modifiedFile);
      const a = document.createElement('a');
      a.href = url;
      a.download = outputFileName;
      document.body.appendChild(a);
      a.click();
      document.body.removeChild(a);
      URL.revokeObjectURL(url);

      // dispose
      doc.Dispose();

    }

  };

  return (
    <div style={{ textAlign: 'center', height: '300px' }}>
      <h1>Convert HTML String to Word Using JavaScript in React</h1>
      <button onClick={HtmlStringToWord} disabled={!wasmModule}>
        Convert
      </button>
    </div>
  );
}

export default App;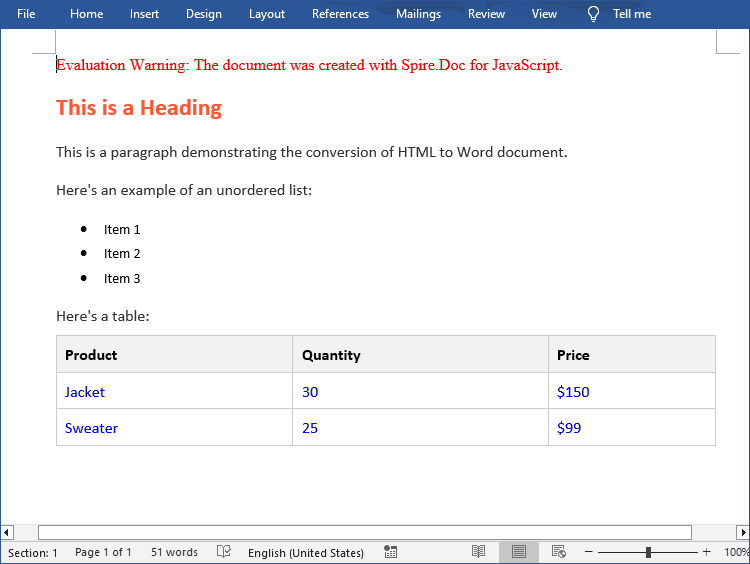
Get a Free License
To fully experience the capabilities of Spire.Doc for JavaScript without any evaluation limitations, you can request a free 30-day trial license.