
Python (365)
Textboxes in a Word document serve as versatile containers for text, enabling users to enhance layout and design. They allow for the separation of content from the main body, making documents more visually appealing and organized. Extracting or updating textboxes can be essential for improving document efficiency, ensuring information is current, and facilitating data analysis.
In this article, you will learn how to extract or update textboxes in a Word document using Python and Spire.Doc for Python.
Install Spire.Doc for Python
This scenario requires Spire.Doc for Python and plum-dispatch v1.7.4. They can be easily installed in your Windows through the following pip command.
pip install Spire.Doc
If you are unsure how to install, please refer to this tutorial: How to Install Spire.Doc for Python on Windows
Extract Text from a Textbox in Word
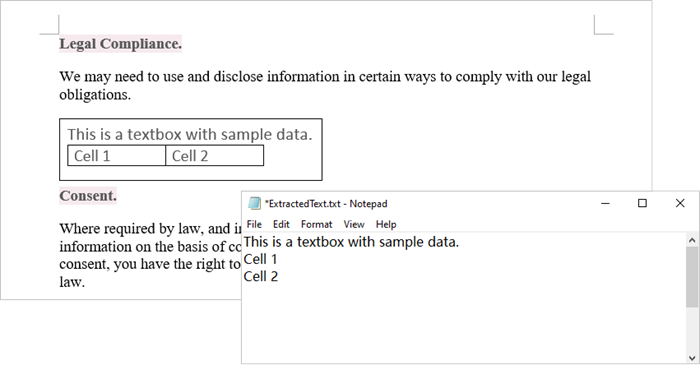
Using Spire.Doc for Python, you can access a specific text box in a document by utilizing the Document.TextBoxes[index] property. After retrieving the text box, you can iterate through its child objects to identify whether each one is a paragraph or a table. If the object is a paragraph, you can retrieve its text using the Paragraph.Text property. In cases where the object is a table, you will need to loop through each cell to extract text from every individual cell within that table.
The steps to extract text from a text box in a Word document are as follows:
- Create a Document object.
- load a Word file by using Document.LoadFromFile() method.
- Access a specific text box using Document.TextBoxes[index] property.
- Iterate through the child objects within the text box.
- Determine if a child object is a paragraph. If it is, retrieve the text from the paragraph using Paragraph.Text property.
- Check if a child object is a table. If so, iterate through the cells in the table to extract text from each cell.
- Python
from spire.doc import *
from spire.doc.common import *

# Create a Document object
document = Document()

# Load a Word file
document.LoadFromFile("C:\\Users\\Administrator\\Desktop\\input.docx")

# Get a specific textbox
textBox = document.TextBoxes.get_Item(0)

with open('ExtractedText.txt','w') as sw:

    # Iterate through the child objects in the textbox
    for i in range(textBox.ChildObjects.Count):

        # Get a specific child object
        object = textBox.ChildObjects.get_Item(i)

        # Determine if the child object is paragraph
        if object.DocumentObjectType == DocumentObjectType.Paragraph:

            # Write paragraph text to txt file
            sw.write((object if isinstance(object, Paragraph) else None).Text + "\n")

        # Determine if the child object is table
        if object.DocumentObjectType == DocumentObjectType.Table:
            table = object if isinstance(object, Table) else None
            for i in range(table.Rows.Count):
                row = table.Rows[i]
                for j in range(row.Cells.Count):
                    cell = row.Cells[j]
                    for k in range(cell.Paragraphs.Count):
                        paragraph = cell.Paragraphs.get_Item(k)

                        # Write paragrah text of a specific cell to txt file
                        sw.write(paragraph.Text + "\n")

# Dispose resources
document.Dispose()
Update Text in a Textbox in Word
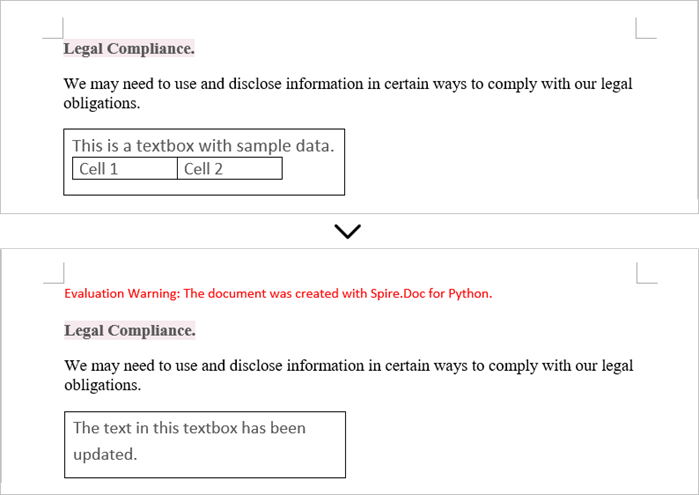
To update a textbox in a Word document, start by clearing its existing content with the TextBox.ChildObjects.Clear() method. This action removes all child objects, including any paragraphs or tables currently contained within the textbox. After clearing the content, you can add a new paragraph to the text box. Once the paragraph is created, set its text to the desired value.
The steps to update a textbox in a Word document are as follows:
- Create a Document object.
- Load a Word file using Document.LoadFromFile() method.
- Get a specific textbox using Document.TextBoxes[index] property
- Remove existing content of the textbox using TextBox.ChildObjects.Clear() method.
- Add a paragraph to the textbox using TextBox.Body.AddParagraph() method.
- Add text to the paragraph using Paragraph.AppendText() method.
- Save the document to a different Word file.
- Python
from spire.doc import *
from spire.doc.common import *

# Create a Document object
document = Document()

# Load a Word file
document.LoadFromFile("C:\\Users\\Administrator\\Desktop\\Input.docx")

# Get a specific textbox
textBox = document.TextBoxes.get_Item(0)

# Remove child objects of the textbox
textBox.ChildObjects.Clear()

# Add a new paragraph to the textbox
paragraph = textBox.Body.AddParagraph()

# Set line spacing
paragraph.Format.LineSpacing = 15.0

# Add text to the paragraph
textRange = paragraph.AppendText("The text in this textbox has been updated.")

# Set font size
textRange.CharacterFormat.FontSize = 15.0

# Save the document to a different Word file
document.SaveToFile("UpdateTextbox.docx", FileFormat.Docx2019);

# Dispose resources
document.Dispose()
Apply for a Temporary License
If you'd like to remove the evaluation message from the generated documents, or to get rid of the function limitations, please request a 30-day trial license for yourself.
Python: Save Shapes as Image Files in PowerPoint Presentations
2024-10-21 01:03:20 Written by KoohjiExtracting and repurposing elements from PowerPoint presentations is a valuable skill for cross-platform content sharing. By converting shapes from slides into standalone image files, users can seamlessly integrate them into documents, web pages, or design projects without losing their original formatting and visual effects. With Python, this process becomes straightforward. In this article, we'll explore how to use Spire.Presentation for Python to save shapes from presentation slides as image files with simple Python code.
- Save Shapes from Slides as Image Files with Python
- Save Images from Slides with Formatting as Images Files
Install Spire.Presentation for Python
This scenario requires Spire.Presentation for Python and plum-dispatch v1.7.4. They can be easily installed in your Windows through the following pip command.
pip install Spire.Presentation
If you are unsure how to install, please refer to: How to Install Spire.Presentation for Python on Windows
Save Shapes from Slides as Image Files with Python
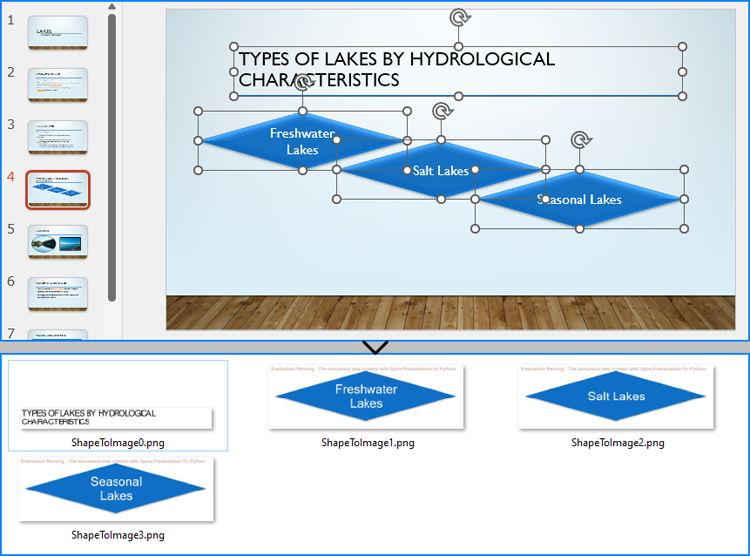
Spire.Presentation for Python provides the Slide.Shapes.SaveAsImage(shapIndex: int, dpiX: int, dpiY: int) method to save shapes in presentation slides as images with the specified DPI(optional). With this method, developers can save either a specific shape or all shapes in a PowerPoint presentation. The detailed steps are as follows:
- Create an instance of Presentation class.
- Load a PowerPoint presentation using Presentation.LoadFromFile() method.
- Get a slide using Presentation.Slides.get_Item() method.
- Iterate through the shapes in the slide:
- Save each shape as an image stream using Slide.Shapes.SaveAsImage() method.
- Save the image stream as an image file using Stream.Save() method.
- Python
from spire.presentation import *

# Create an instance of Presentation
presentation = Presentation()

# Load a PowerPoint file
presentation.LoadFromFile("Sample.pptx")

# Get the first slide
slide = presentation.Slides.get_Item(3)

# Save the shape as an image stream
for i in range(slide.Shapes.Count):
  imageStream = slide.Shapes.SaveAsImage(i, 256, 256)
  # Save the image
  imageStream.Save(f"output/Shapes/ShapeToImage{i}.png")

# Release resources
presentation.Dispose()
Save Images from Slides with Formatting as Images Files
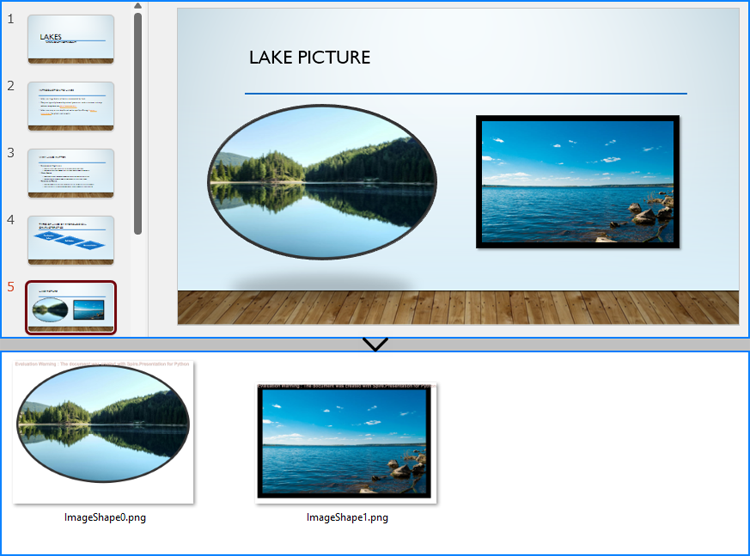
By using the methods provided by Spire.Presentation for Python, developers can also save images from slides as image files while preserving the edits and formatting applied to them. This requires first checking if the shape is an object of SlidePicture class, and if so, the shape can be saved as an image file. The detailed steps are as follows:
- Create an instance of Presentation class.
- Load a PowerPoint presentation using Presentation.LoadFromFile() method.
- Get a slide using Presentation.Slides.get_Item() method.
- Iterate through the shapes in the slide:
- Check if each shape is an object of SlidePicture class.
- If it is, save the shape as an image stream using Slide.Shapes.SaveAsImage() method.
- Save the image stream to a file using Stream.Save() method.
- Python
from spire.presentation import *

# Create an instance of Presentation
presentation = Presentation()

# Load a PowerPoint file
presentation.LoadFromFile("Sample.pptx")

# Get a slide
slide = presentation.Slides.get_Item(4)

# Iterate through all shapes in the slide
i = 0
for shape in slide.Shapes:
  # Check if the shape is an object of SlidePicture
  if isinstance(shape, SlidePicture):
    # Save the shape as an image
    shape = shape if isinstance(shape, SlidePicture) else None
    image = slide.Shapes.SaveAsImage(slide.Shapes.IndexOf(shape), 256, 256)
    image.Save(f"output/Images/ImageShape{i}.png")
    i += 1

# Release resources
presentation.Dispose()
Apply for a Temporary License
If you'd like to remove the evaluation message from the generated documents, or to get rid of the function limitations, please request a 30-day trial license for yourself.
Using Python to manipulate text formatting in PDFs provides a powerful way to automate and customize documents. With the Spire.PDF for Python library, developers can efficiently find text with advanced search options to retrieve and modify text properties like font, size, color, and style, enabling users to find and update text formatting across large document sets, saving time and reducing manual work. This article will demonstrate how to use Spire.PDF for Python to retrieve and modify text formatting in PDF documents with Python code.
- Find Text and Retrieve the Font Information in PDFs
- Find and Modify Text Formatting in PDF Documents
Install Spire.PDF for Python
This scenario requires Spire.PDF for Python and plum-dispatch v1.7.4. They can be easily installed in your Windows through the following pip command.
pip install Spire.PDF
If you are unsure how to install, please refer to: How to Install Spire.PDF for Python on Windows
Find Text and Retrieve Formatting Information in PDFs
Developers can use the PdfTextFinder and PdfTextFindOptions classes provided by Spire.PDF for Python to precisely search for specific text in a PDF document and obtain a collection of PdfTextFragment objects representing the search results. Then, developers can access the format information of the specified search result text through properties such as FontName, FontSize, and FontFamily, under PdfTextFragment.TextStates[] property.
The detailed steps for finding text in PDF and retrieving its font information are as follows:
- Create an instance of PdfDocument class and load a PDF document using PdfDocument.LoadFromFile() method.
- Get a page using PdfDocument.Pages.get_Item() method.
- Create a PdfTextFinder object using the page.
- Create a PdfTextFindOptions object, set the search options, and apply the search options through PdfTextFinder.Options property.
- Find specific text on the page using PdfTextFinder.Find() method and get a collection of PdfTextFragment objects.
- Get the formatting of the first finding result through PdfTextFragment.TextStates property.
- Get the font name, font size, and font family of the result through PdfTextStates[0].FontName, PdfTextStates[0].FontSize, and PdfTextStates[0].FontFamily properties.
- Print the result.
- Python
from spire.pdf import *
# Create a PdfDocument instance
pdf = PdfDocument()
# Load a PDF file
pdf.LoadFromFile("Sample.pdf")
# Get the first page
page = pdf.Pages.get_Item(0)
# Create a PdfTextFinder instance
finder = PdfTextFinder(page)
# Create a PdfTextFindOptions instance and set the search options
options = PdfTextFindOptions()
options.CaseSensitive = True
options.WholeWords = True
# Apply the options
finder.Options = options
# Find the specified text
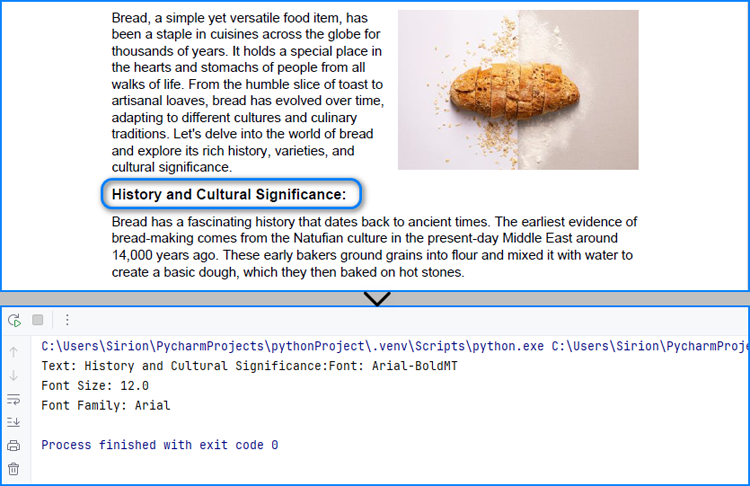
fragments = finder.Find("History and Cultural Significance:")
# Get the formatting of the first fragment
formatting = fragments[0].TextStates
# Get the formatting information
fontInfo = ""
fontInfo += "Text: " + fragments[0].Text
fontInfo += "Font: " + formatting[0].FontName
fontInfo += "\nFont Size: " + str(formatting[0].FontSize)
fontInfo += "\nFont Family: " + formatting[0].FontFamily
# Output font information
print(fontInfo)
# Release resources
pdf.Dispose()
Find and Modify Text Formatting in PDF Documents
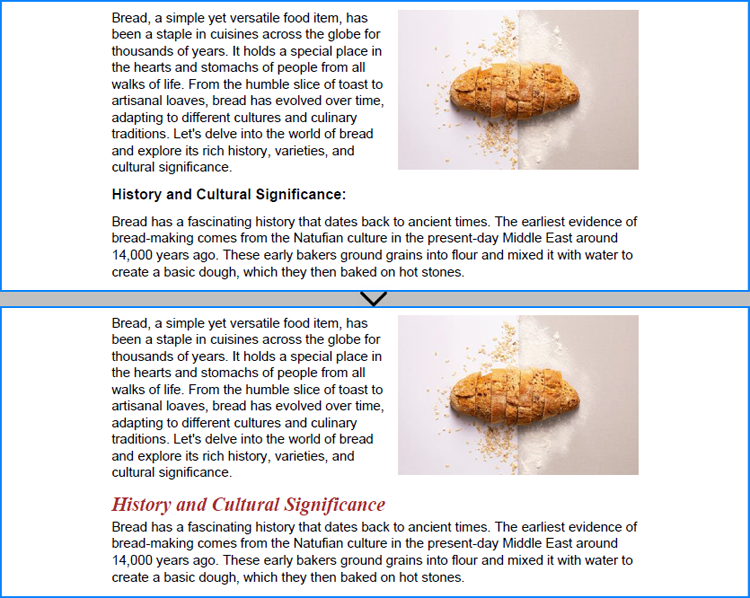
After finding specific text, developers can overlay it with a rectangle in the same color as the background and then redraw the text in a new format at the same position, thus achieving text format modification of simple PDF text fragments on solid color pages. The detailed steps are as follows:
- Create an instance of PdfDocument class and load a PDF document using PdfDocument.LoadFromFile() method.
- Get a page using PdfDocument.Pages.get_Item() method.
- Create a PdfTextFinder object using the page.
- Create a PdfTextFindOptions object, set the search options, and apply the search options through PdfTextFinder.Options property.
- Find specific text on the page using PdfTextFinder.Find() method and get the first result.
- Get the color of the page background through PdfPageBase.BackgroundColor property and change the color to white if the background is empty.
- Draw rectangles with the obtained color in the position of the found text using PdfPageBase.Canvas.DrawRectangle() method.
- Create a new font, brush, and string format and calculate the text frame.
- Draw the text in the new format in the same position using PdfPageBase.Canvas.DrawString() method.
- Save the document using PdfDocument.SaveToFile() method.
- Python
from spire.pdf import *

# Create a PdfDocument instance
pdf = PdfDocument()
# Load a PDF file
pdf.LoadFromFile("Sample.pdf")

# Get the first page
page = pdf.Pages.get_Item(0)

# Create a PdfTextFinder instance
finder = PdfTextFinder(page)

# Create a PdfTextFindOptions instance and set the search options
options = PdfTextFindOptions()
options.CaseSensitive = True
options.WholeWords = True
finder.Options = options

# Find the specified text
fragments = finder.Find("History and Cultural Significance:")
# Get the first result
fragment = fragments[0]

# Get the background color and change it to white if its empty
backColor = page.BackgroundColor
if backColor.ToArgb() == 0:
    backColor = Color.get_White()
# Draw a rectangle with the background color to cover the text
for i in range(len(fragment.Bounds)):
    page.Canvas.DrawRectangle(PdfSolidBrush(PdfRGBColor(backColor)), fragment.Bounds[i])

# Create a new font and a new brush
font = PdfTrueTypeFont("Times New Roman", 16.0, 3, True)
brush = PdfBrushes.get_Brown()
# Create a PdfStringFormat instance
stringFormat = PdfStringFormat()
stringFormat.Alignment = PdfTextAlignment.Left
# Calculate the rectangle that contains the text
point = fragment.Bounds[0].Location
size = SizeF(fragment.Bounds[-1].Right, fragment.Bounds[-1].Bottom)
rect = RectangleF(point, size)

# Draw the text with the specified format in the same rectangle
page.Canvas.DrawString("History and Cultural Significance", font, brush, rect, stringFormat)

# Save the document
pdf.SaveToFile("output/FindModifyTextFormat.pdf")

# Release resources
pdf.Close()
Apply for a Temporary License
If you'd like to remove the evaluation message from the generated documents, or to get rid of the function limitations, please request a 30-day trial license for yourself.
Digital signatures serve as a critical layer of security, ensuring that an Excel file has not been altered since it was signed and verifying the identity of its originator. However, there are scenarios where the detection and removal of these digital signatures become necessary, such as when consolidating multiple documents, updating content, or preparing files for systems that do not support digitally signed documents. This article shows how to detect and remove digital signatures in Excel files with Python code using Spire.XLS for Python, providing a simple way to batch process Excel file digital signatures.
- Detecting the Presence of Digital Signatures in Excel Files
- Removing Digital Signatures from Excel Files
Install Spire.XLS for Python
This scenario requires Spire.XLS for Python and plum-dispatch v1.7.4. They can be easily installed in your Windows through the following pip commands.
pip install Spire.XLS
If you are unsure how to install, please refer to: How to Install Spire.XLS for Python on Windows
Detecting the Presence of Digital Signatures in Excel Files
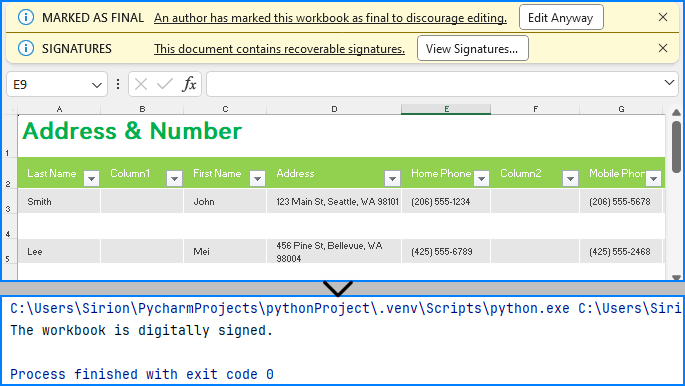
Spire.XLS for Python provides the Workbook class to deal with Excel files and the Workbook.IsDigitallySigned property to check if an Excel file has digital signatures. Developers can use the Boolean value returned by this property to determine whether the Excel file contains a digital signature.
The detailed steps for detecting if an Excel file has digital signatures are as follows:
- Create an instance of Workbook class.
- Load an Excel file using Workbook.LoadFromFile() method.
- Check whether the workbook is digitally signed by the value of the Workbook.IsDigitallySigned property.
- Python
from spire.xls import *

# Create an instance of Workbook
workbook = Workbook()

# Load an Excel file
workbook.LoadFromFile("Sample.xlsx")

# Check whether the workbook is digitally signed
if workbook.IsDigitallySigned is False:
    print("The workbook is not digitally signed.")
else:
    print("The workbook is digitally signed.")
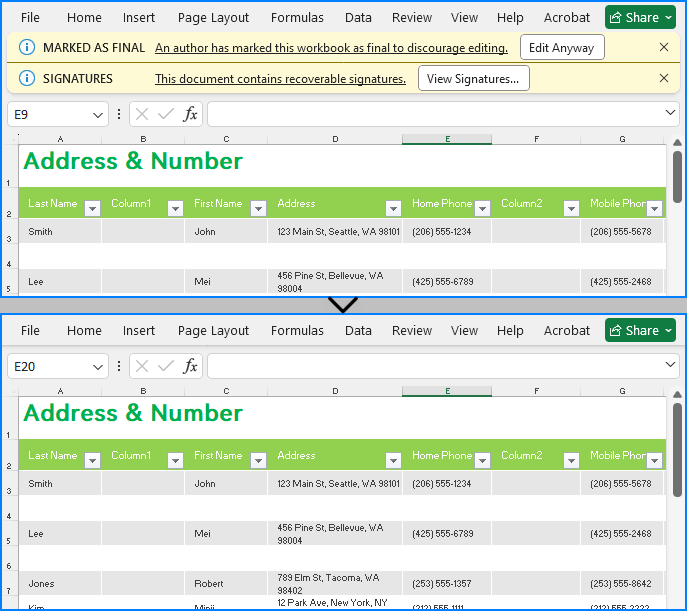
Removing Digital Signatures from Excel Files
Developers can use the Workbook.RemoveAllDigitalSignatures() method to effortlessly delete all digital signatures in an Excel workbook. The detailed steps are as follows:
- Create an instance of Workbook class.
- Load an Excel file using Workbook.LoadFromFile() method.
- Remove all digital signatures from the workbook using Workbook.RemoveAllDigitalSignatures() method.
- Save the workbook using Workbook.SaveToFile() method.
- Python
from spire.xls import *

# Create an instance of Workbook
workbook = Workbook()

# Load an Excel file
workbook.LoadFromFile("Sample.xlsx")

# Remove digital signatures
workbook.RemoveAllDigitalSignatures()

# Save the document
workbook.SaveToFile("output/RemoveExcelDigitalSignature.xlsx", FileFormat.Version2016)
workbook.Dispose()
Apply for a Temporary License
If you'd like to remove the evaluation message from the generated documents, or to get rid of the function limitations, please request a 30-day trial license for yourself.
PDF format has now become a standard for sharing and preserving documents. When working with PDF files, you may sometimes need to copy specific pages in the PDF to extract valuable content, create summaries, or simply share relevant sections without distributing the entire document. In this article, you will learn how to copy pages in PDF in Python using Spire.PDF for Python.
Install Spire.PDF for Python
This scenario requires Spire.PDF for Python. It can be easily installed in your Windows through the following pip command.
pip install Spire.PDF
If you are unsure how to install, please refer to this tutorial: How to Install Spire.PDF for Python on Windows
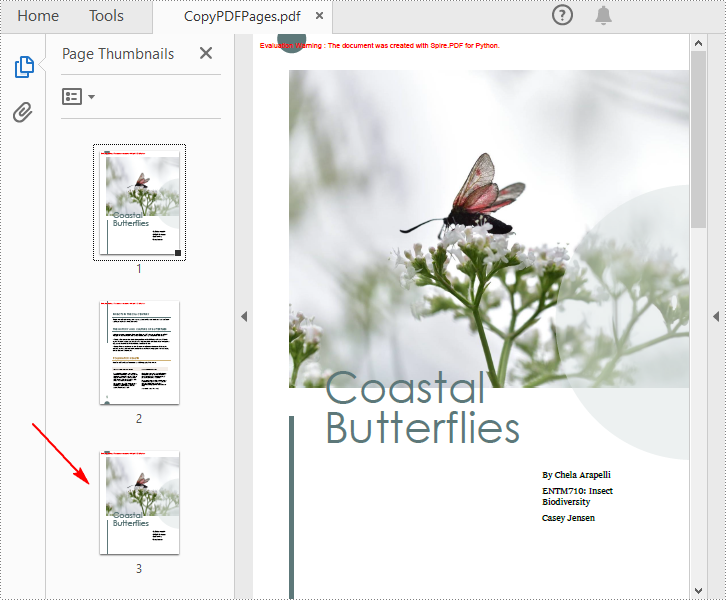
Copy Pages within the Same PDF in Python
To duplicate PDF pages, you can first create template based on a specified page in PDF, and then draw the template on a newly added page through the PdfPageBase.Canvas.DrawTemplate() method. The following are the detailed steps.
- Create a PdfDocument instance.
- Load a PDF file using PdfDocument.LoadFromFile() method.
- Get a specified page using PdfDocument.Pages[] property.
- Get the size of the page using PdfPageBase.Size property.
- Create a template based on the page using PdfPageBase.CreateTemplate() method.
- Add a new page of the same size at the end using PdfDocument.Pages.Add(size: SizeF, margins: PdfMargins) method. Or you can insert a new page of the same size at a specified location using PdfDocument.Pages.Insert(index: int, size: SizeF, margins: PdfMargins) method.
- Draw template on the newly added page using PdfPageBase.Canvas.DrawTemplate(template: PdfTemplate, location: PointF) method.
- Save the result file using PdfDocument.SaveToFile() method.
- Python
from spire.pdf.common import *
from spire.pdf import *

# Create a PdfDocument object
pdf = PdfDocument()

# Load a PDF file from disk
pdf.LoadFromFile("Butterflies.pdf")

# Get the first page
page = pdf.Pages[0]

# Get the size of the page
size = page.Size

# Create a template based on the page
template = page.CreateTemplate()

# Add a new page of the same size at the end
page = pdf.Pages.Add(size, PdfMargins(0.0))
# Insert a new page at the specified location
# page = pdf.Pages.Insert(1, size, PdfMargins(0.0))

# Draw the template on the newly added page
page.Canvas.DrawTemplate(template, PointF(0.0, 0.0))

# Save the PDF file
pdf.SaveToFile("CopyPDFPages.pdf");
pdf.Close()
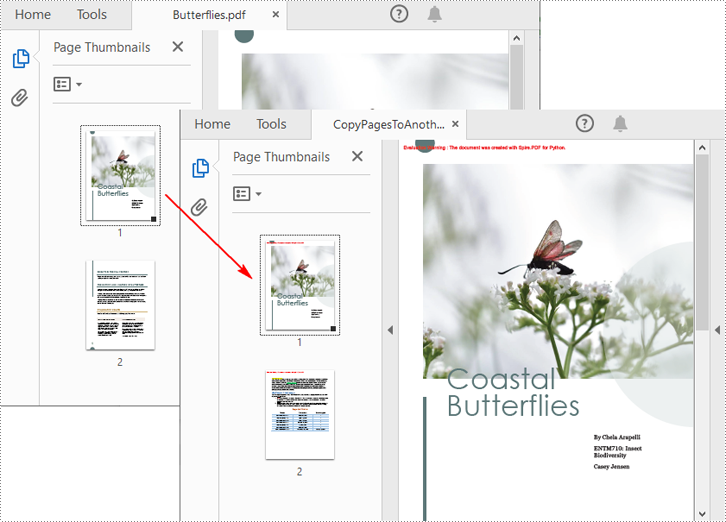
Copy Pages from One PDF to Another in Python
Spire.PDF for Python also allows you to load two PDF files, create templates based on the pages in one PDF file, and then draw them onto the pages in another PDF file. The following are the detailed steps.
- Create a PdfDocument instance.
- Load two PDF files using PdfDocument.LoadFromFile() method.
- Get a specified page in the first PDF using PdfDocument.Pages[] property.
- Get the size of the page using PdfPageBase.Size property.
- Create a template based on the page using PdfPageBase.CreateTemplate() method.
- Insert a new page of the same size at a specified location in the second PDF using PdfDocument.Pages.Insert(index: int, size: SizeF, margins: PdfMargins) method. Or you can add a new page of the same size at the end of the second PDF using PdfDocument.Pages.Add(size: SizeF, margins: PdfMargins) method.
- Draw template on the newly added page using PdfPageBase.Canvas.DrawTemplate(template: PdfTemplate, location: PointF) method.
- Save the result file using PdfDocument.SaveToFile() method.
- Python
from spire.pdf.common import *
from spire.pdf import *

# Load the first PDF file
pdf1 = PdfDocument()
pdf1.LoadFromFile("Butterflies.pdf")

# Load the second PDF file
pdf2 = PdfDocument()
pdf2.LoadFromFile("SamplePDF.pdf")

# Get the first page in the first PDF file
page = pdf1.Pages[0]

# Get the size of the page
size = page.Size

# Create a template based on the page
template = page.CreateTemplate()

# Insert a new page at a specified location in the second PDF file
newPage = pdf2.Pages.Insert(0, size, PdfMargins(0.0))

# Add a new page at the end of the second PDF file
# newPage = pdf2.Pages.Add(size, PdfMargins(0.0))

# Draw the template on the newly added page
newPage.Canvas.DrawTemplate(template, PointF(0.0, 0.0))

# Save the result file
pdf2.SaveToFile("CopyPagesToAnotherPDF.pdf")
pdf2.Close()
Apply for a Temporary License
If you'd like to remove the evaluation message from the generated documents, or to get rid of the function limitations, please request a 30-day trial license for yourself.
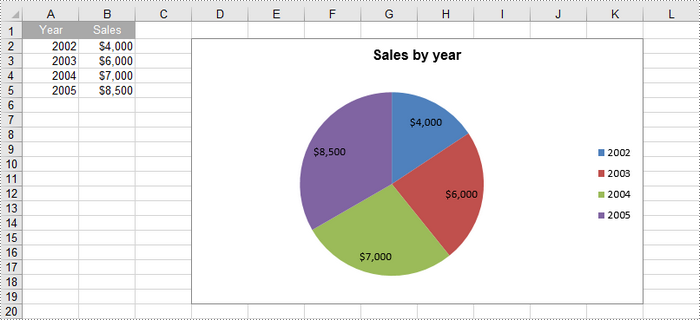
A pie chart is a circular statistical graphic that is divided into slices to illustrate numerical proportions. Each slice represents a category's contribution to the whole, making it an effective way to visualize relative sizes. In this article, you will learn how to create a standard pip chart, an exploded pip chart, and a pie of pie chart in Excel using Spire.XLS for Python.
- Create a Pie Chart in Excel
- Create an Exploded Pie Chart in Excel
- Create a Pie of Pie Chart in Excel
Install Spire.XLS for Python
This scenario requires Spire.XLS for Python and plum-dispatch v1.7.4. They can be easily installed in your Windows through the following pip command.
pip install Spire.XLS
If you are unsure how to install, please refer to this tutorial: How to Install Spire.XLS for Python on Windows
Create a Pie Chart in Excel in Python
To add a pie chart to a worksheet, use the Worksheet.Charts.Add(ExcelChartType.Pie) method, which returns a Chart object. You can then set various properties, such as DataRange, ChartTitle, LeftColumn, TopRow, and Series to define the chart's data, title, position, and series formatting.
Here are the steps to create a pie chart in Excel:
- Create a Workbook object.
- Retrieve a specific worksheet from the workbook.
- Insert values into the worksheet cells that will be used as chart data.
- Add a pie chart to the worksheet using Worksheet.Charts.Add(ExcelChartType.Pie) method.
- Set the chart data using Chart.DataRange property.
- Define the chart's position and size using Chart.LeftColumn, Chart.TopRow, Chart.RightColumn, and Chart.BottomRow properties.
- Set the chart title using Chart.ChartTitle property.
- Access and format the series through Chart.Series property.
- Save the workbook as an Excel file.
- Python
from spire.xls import *
from spire.xls.common import *

# Create a workbook
workbook = Workbook()

# Get the first sheet
sheet = workbook.Worksheets[0]

# Set values of the specified cells
sheet.Range["A1"].Value = "Year"
sheet.Range["A2"].Value = "2002"
sheet.Range["A3"].Value = "2003"
sheet.Range["A4"].Value = "2004"
sheet.Range["A5"].Value = "2005"
sheet.Range["B1"].Value = "Sales"
sheet.Range["B2"].NumberValue = 4000
sheet.Range["B3"].NumberValue = 6000
sheet.Range["B4"].NumberValue = 7000
sheet.Range["B5"].NumberValue = 8500

# Format the cells
sheet.Range["A1:B1"].RowHeight = 15
sheet.Range["A1:B1"].Style.Color = Color.get_DarkGray()
sheet.Range["A1:B1"].Style.Font.Color = Color.get_White()
sheet.Range["A1:B1"].Style.VerticalAlignment = VerticalAlignType.Center
sheet.Range["A1:B1"].Style.HorizontalAlignment = HorizontalAlignType.Center
sheet.Range["B2:B5"].Style.NumberFormat = "\"$\"#,##0"

# Add a pie chart
chart = sheet.Charts.Add(ExcelChartType.Pie)

# Set region of chart data
chart.DataRange = sheet.Range["B2:B5"]
chart.SeriesDataFromRange = False

# Set position of chart
chart.LeftColumn = 4
chart.TopRow = 2
chart.RightColumn = 12
chart.BottomRow = 20

# Set chart title
chart.ChartTitle = "Sales by year"
chart.ChartTitleArea.IsBold = True
chart.ChartTitleArea.Size = 12

# Get the first series
cs = chart.Series[0]

# Set category labels for the series
cs.CategoryLabels = sheet.Range["A2:A5"]

# Set values for the series
cs.Values = sheet.Range["B2:B5"]

# Show vales in data labels
cs.DataPoints.DefaultDataPoint.DataLabels.HasValue = True

# Save the workbook to an Excel file
workbook.SaveToFile("output/PieChart.xlsx", ExcelVersion.Version2016)

# Dispose resources
workbook.Dispose()
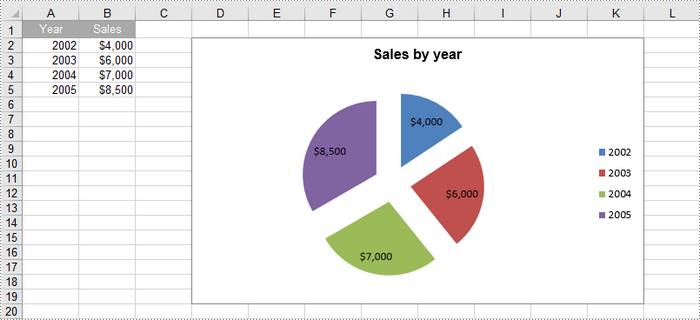
Create an Exploded Pie Chart in Excel in Python
An exploded pie chart is a variation of the standard pie chart where one or more slices are separated or "exploded" from the main chart. To create an exploded pie chart, you can use the Worksheet.Charts.Add(ExcelChartType.PieExploded) method.
The steps to create an exploded pip chart in Excel are as follows:
- Create a Workbook object.
- Retrieve a specific worksheet from the workbook.
- Insert values into the worksheet cells that will be used as chart data.
- Add an exploded pie chart to the worksheet using Worksheet.Charts.Add(ExcelChartType. PieExploded) method.
- Set the chart data using Chart.DataRange property.
- Define the chart's position and size using Chart.LeftColumn, Chart.TopRow, Chart.RightColumn, and Chart.BottomRow properties.
- Set the chart title using Chart.ChartTitle property.
- Access and format the series through Chart.Series property.
- Save the workbook as an Excel file.
- Python
from spire.xls import *
from spire.xls.common import *

# Create a workbook
workbook = Workbook()

# Get the first sheet
sheet = workbook.Worksheets[0]

# Set values of the specified cells
sheet.Range["A1"].Value = "Year"
sheet.Range["A2"].Value = "2002"
sheet.Range["A3"].Value = "2003"
sheet.Range["A4"].Value = "2004"
sheet.Range["A5"].Value = "2005"
sheet.Range["B1"].Value = "Sales"
sheet.Range["B2"].NumberValue = 4000
sheet.Range["B3"].NumberValue = 6000
sheet.Range["B4"].NumberValue = 7000
sheet.Range["B5"].NumberValue = 8500

# Format the cells
sheet.Range["A1:B1"].RowHeight = 15
sheet.Range["A1:B1"].Style.Color = Color.get_DarkGray()
sheet.Range["A1:B1"].Style.Font.Color = Color.get_White()
sheet.Range["A1:B1"].Style.VerticalAlignment = VerticalAlignType.Center
sheet.Range["A1:B1"].Style.HorizontalAlignment = HorizontalAlignType.Center
sheet.Range["B2:B5"].Style.NumberFormat = "\"$\"#,##0"

# Add an exploded pie chart
chart = sheet.Charts.Add(ExcelChartType.PieExploded)

# Set region of chart data
chart.DataRange = sheet.Range["B2:B5"]
chart.SeriesDataFromRange = False

# Set position of chart
chart.LeftColumn = 4
chart.TopRow = 2
chart.RightColumn = 12
chart.BottomRow = 20

# Set chart title
chart.ChartTitle = "Sales by year"
chart.ChartTitleArea.IsBold = True
chart.ChartTitleArea.Size = 12

# Get the first series
cs = chart.Series[0]

# Set category labels for the series
cs.CategoryLabels = sheet.Range["A2:A5"]

# Set values for the series
cs.Values = sheet.Range["B2:B5"]

# Show vales in data labels
cs.DataPoints.DefaultDataPoint.DataLabels.HasValue = True

# Save the workbook to an Excel file
workbook.SaveToFile("output/ExplodedPieChart.xlsx", ExcelVersion.Version2016)

# Dispose resources
workbook.Dispose()
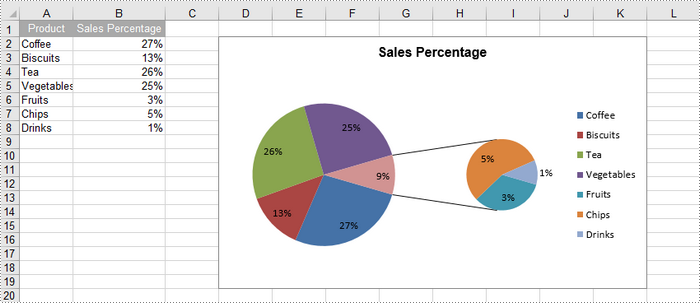
Create a Pie of Pie Chart in Excel in Python
A pie of pie chart is a specialized type of pie chart that allows for more detailed representation of data by providing a secondary pie chart for specific categories. To add a pip of pie chart to a worksheet, use the Worksheet.Charts.Add(ExcelChartType.PieOfPie) method.
The detailed steps to create a pie of pie chart in Excel are as follows:
- Create a Workbook object.
- Retrieve a specific worksheet from the workbook.
- Insert values into the worksheet cells that will be used as chart data.
- Add a pie of pie chart to the worksheet using Worksheet.Charts.Add(ExcelChartType.PieOfPie) method.
- Set the chart data, position, size, title using the properties under the Chart object.
- Access the first series using Chart.Series[0] property.
- Set the split value that determines what displays in the secondary pie using Series.Format.Options.SplitValue property.
- Save the workbook as an Excel file.
- Python
from spire.xls import *
from spire.xls.common import *

# Create a workbook
workbook = Workbook()

# Get the first sheet
sheet = workbook.Worksheets[0]

# Set values of the specified cells
sheet.Range["A1"].Value = "Product"
sheet.Range["A2"].Value = "Coffee"
sheet.Range["A3"].Value = "Biscuits"
sheet.Range["A4"].Value = "Tea"
sheet.Range["A5"].Value = "Vegetables"
sheet.Range["A6"].Value = "Fruits"
sheet.Range["A7"].Value = "Chips"
sheet.Range["A8"].Value = "Drinks"
sheet.Range["B1"].Value = "Sales Percentage"
sheet.Range["B2"].NumberValue = 0.27
sheet.Range["B3"].NumberValue = 0.13
sheet.Range["B4"].NumberValue = 0.26
sheet.Range["B5"].NumberValue = 0.25
sheet.Range["B6"].NumberValue = 0.03
sheet.Range["B7"].NumberValue = 0.05
sheet.Range["B8"].NumberValue = 0.01

# Autofit column width
sheet.AutoFitColumn(2)

# Format the cells
sheet.Range["A1:B1"].RowHeight = 15
sheet.Range["A1:B1"].Style.Color = Color.get_DarkGray()
sheet.Range["A1:B1"].Style.Font.Color = Color.get_White()
sheet.Range["A1:B1"].Style.VerticalAlignment = VerticalAlignType.Center
sheet.Range["A1:B1"].Style.HorizontalAlignment = HorizontalAlignType.Center
sheet.Range["B2:B8"].Style.NumberFormat = "0%"

# Add a pie of pie chart
chart = sheet.Charts.Add(ExcelChartType.PieOfPie)

# Set region of chart data
chart.DataRange = sheet.Range["B2:B58"]
chart.SeriesDataFromRange = False

# Set position of chart
chart.LeftColumn = 4
chart.TopRow = 2
chart.RightColumn = 12
chart.BottomRow = 20

# Chart title
chart.ChartTitle = "Sales Percentage"
chart.ChartTitleArea.IsBold = True
chart.ChartTitleArea.Size = 12

# Get the first series
cs = chart.Series[0]

# Set category labels for the series
cs.CategoryLabels = sheet.Range["A2:A8"]

# Set values for the series
cs.Values = sheet.Range["B2:B8"]

# Show vales in data labels
cs.DataPoints.DefaultDataPoint.DataLabels.HasValue = True

# Set the size of the secondary pie
cs.Format.Options.PieSecondSize = 50

# Set the split value, which determines what displays in the secondary pie
cs.Format.Options.SplitType = SplitType.Percent
cs.Format.Options.SplitValue = 10

# Save the workbook to an Excel file
workbook.SaveToFile("output/PieOfPieChart.xlsx", ExcelVersion.Version2016)

# Dispose resources
workbook.Dispose()
Apply for a Temporary License
If you'd like to remove the evaluation message from the generated documents, or to get rid of the function limitations, please request a 30-day trial license for yourself.
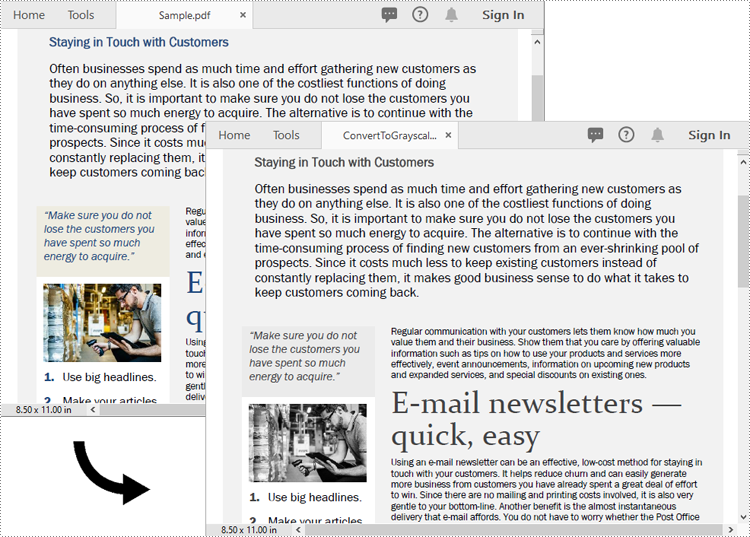
Converting a PDF to grayscale reduces file size by removing unnecessary color data, turning the content into shades of gray. This is especially useful for documents where color isn’t critical, such as text-heavy reports or forms, resulting in more efficient storage and faster transmission. On the other hand, linearization optimizes the PDF’s internal structure for web use. It enables users to start viewing the first page while the rest of the file is still loading, providing a faster and smoother experience, particularly for online viewing. In this article, we will demonstrate how to convert PDF files to grayscale or linearized PDFs in Python using Spire.PDF for Python.
Install Spire.PDF for Python
This scenario requires Spire.PDF for Python and plum-dispatch v1.7.4. They can be easily installed in your Windows through the following pip command.
pip install Spire.PDF
If you are unsure how to install, please refer to this tutorial: How to Install Spire.PDF for Python on Windows
Convert PDF to Grayscale in Python
Converting a PDF document to grayscale can be achieved by using the PdfGrayConverter.ToGrayPdf() method. The detailed steps are as follows.
- Load a PDF document using the PdfGrayConverter class.
- Convert the PDF document to grayscale using the PdfGrayConverter.ToGrayPdf() method.
- Python
from spire.pdf.common import *
from spire.pdf import *

# Specify the input and output PDF file paths
inputFile = "Sample.pdf"
outputFile = "Output/ConvertToGrayscale.pdf"

# Load a PDF document using the PdfGrayConverter class
converter = PdfGrayConverter(inputFile)
# Convert the PDF document to grayscale
converter.ToGrayPdf(outputFile)
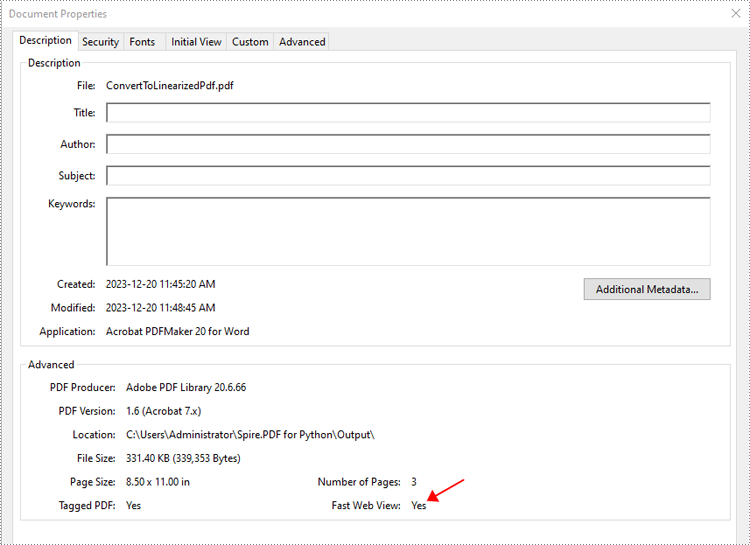
Convert PDF to Linearized in Python
To convert a PDF to linearized, you can use the PdfToLinearizedPdfConverter.ToLinearizedPdf() method. The detailed steps are as follows.
- Load a PDF document using the PdfToLinearizedPdfConverter class.
- Convert the PDF document to linearized using the PdfToLinearizedPdfConverter.ToLinearizedPdf() method.
- Python
from spire.pdf.common import *
from spire.pdf import *

# Specify the input and output PDF file paths
inputFile = "Sample.pdf"
outputFile = "Output/ConvertToLinearizedPdf.pdf"

# Load a PDF document using the PdfToLinearizedPdfConverter class
converter = PdfToLinearizedPdfConverter(inputFile)
# Convert the PDF document to a linearized PDF
converter.ToLinearizedPdf(outputFile)
Open the result file in Adobe Acrobat and check the document properties. You will see that the value for "Fast Web View" is set to "Yes", indicating that the file has been linearized.
Apply for a Temporary License
If you'd like to remove the evaluation message from the generated documents, or to get rid of the function limitations, please request a 30-day trial license for yourself.
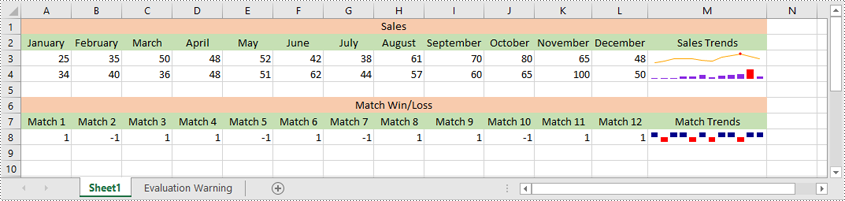
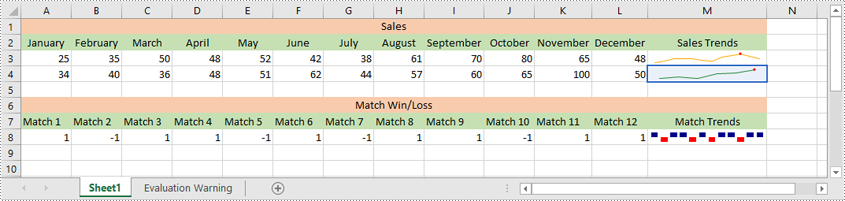
Sparklines in Excel are small, lightweight charts that fit inside individual cells of a worksheet. They are particularly useful for showing variations in data across rows or columns, allowing users to quickly identify trends without taking up much space. In this article, we'll demonstrate how to insert, modify, and delete sparklines in Excel in Python using Spire.XLS for Python.
- Insert a Sparkline in Excel in Python
- Modify a Sparkline in Excel in Python
- Delete Sparklines from Excel in Python
Install Spire.XLS for Python
This scenario requires Spire.XLS for Python and plum-dispatch v1.7.4. They can be easily installed in your Windows through the following pip command.
pip install Spire.XLS
If you are unsure how to install, please refer to this tutorial: How to Install Spire.XLS for Python on Windows
Insert a Sparkline in Excel in Python
Excel offers 3 main types of sparklines:
- Line Sparkline: Shows data trends as a line, similar to a miniature line graph.
- Column Sparkline: Displays data as vertical bars, emphasizing individual data points.
- Win/Loss Sparkline: Illustrates positive and negative values, useful for tracking binary outcomes like wins or losses.
Spire.XLS for Python supports inserting all of the above types of sparklines. Below are the detailed steps for inserting a sparkline in Excel using Spire.XLS for Python:
- Create an object of the Workbook class.
- Load an Excel file using Workbook.LoadFromFile() method.
- Get a specific worksheet using Workbook.Worksheets[index] property.
- Add a sparkline group to the worksheet using Worksheet.SparklineGroups.AddGroup() method.
- Specify the sparkline type, color, and data point color for the sparkline group.
- Add a sparkline collection to the group using SparklineGroup.Add() method, and then add a sparkline to the collection using SparklineCollection.Add() method.
- Save the resulting file using Workbook.SaveToFile() method.
- Python
from spire.xls import *
from spire.xls.common import *

# Create a Workbook object
workbook = Workbook()
# Load an Excel file
workbook.LoadFromFile("Sample.xlsx")

# Get the first worksheet in the workbook
sheet = workbook.Worksheets[0]

# Add a sparkline group to the worksheet
sparkline_group1 = sheet.SparklineGroups.AddGroup()
# Set the sparkline type to line
sparkline_group1.SparklineType = SparklineType.Line
# Set the sparkline color
sparkline_group1.SparklineColor = Color.get_Orange()
# Set the highest data point color
sparkline_group1.HighPointColor = Color.get_Red()
# Add a sparkline collection
sparklines1 = sparkline_group1.Add()
# Add a sparkline to the collection, define the data range for the sparkline and the target cell for displaying the sparkline
sparklines1.Add(sheet.Range["A3:L3"], sheet.Range["M3"])

# Add a sparkline group to the worksheet
sparkline_group2 = sheet.SparklineGroups.AddGroup()
# Set the sparkline type to column
sparkline_group2.SparklineType = SparklineType.Column
# Set the sparkline color
sparkline_group2.SparklineColor = Color.get_BlueViolet()
# Set the highest data point color
sparkline_group2.HighPointColor = Color.get_Red()
# Add a sparkline collection
sparklines2 = sparkline_group2.Add()
# Add a sparkline to the collection, define the data range for the sparkline and the target cell for displaying the sparkline
sparklines2.Add(sheet.Range["A4:L4"], sheet.Range["M4"])

# Add a sparkline group to the worksheet
sparkline_group3 = sheet.SparklineGroups.AddGroup()
# Set the sparkline type to stacked (win/loss)
sparkline_group3.SparklineType = SparklineType.Stacked
# Set the sparkline color
sparkline_group3.SparklineColor = Color.get_DarkBlue()
# Set the negative data point color
sparkline_group3.NegativePointColor = Color.get_Red()
# Add a sparkline collection
sparklines3 = sparkline_group3.Add()
# Add a sparkline to the collection, define the data range for the sparkline and the target cell for displaying the sparkline
sparklines3.Add(sheet.Range["A8:L8"], sheet.Range["M8"])

# Save the resulting workbook to file
workbook.SaveToFile("AddSparklines.xlsx", ExcelVersion.Version2016)
workbook.Dispose()
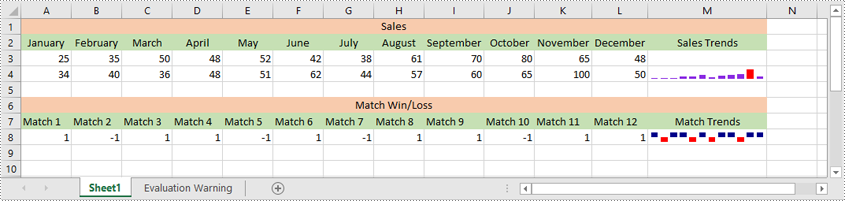
Modify a Sparkline in Excel in Python
After inserting a sparkline, you can modify its type, color, and data source to make it more effective at displaying the information you need.
The following steps explain how to modify a sparkline in Excel using Spire.XLS for Python:
- Create an object of the Workbook class.
- Load an Excel file using Workbook.LoadFromFile() method.
- Get a specific worksheet using Workbook.Worksheets[index] property.
- Get a specific sparkline group in the worksheet using Worksheet.SparklineGroups[index] property.
- Change the sparkline type and color for the sparkline group using SparklineGroup.SparklineType and SparklineGroup.SparklineColor properties.
- Get a specific sparkline in the group and change its data source using ISparklines.RefreshRanges() method.
- Save the resulting file using Workbook.SaveToFile() method.
- Python
from spire.xls import *
from spire.xls.common import *

# Create a Workbook object
workbook = Workbook()
# Load an Excel file that contains sparklines
workbook.LoadFromFile("AddSparklines.xlsx")

# Get the first worksheet in the workbook
sheet = workbook.Worksheets[0]

# Get the second sparkline group
sparklineGroup = sheet.SparklineGroups[1]
# Change the sparkline type
sparklineGroup.SparklineType = SparklineType.Line
# Change the sparkline color
sparklineGroup.SparklineColor = Color.get_ForestGreen()

# Change the data range of the sparkline
sparklines = sparklineGroup[0]
sparklines.RefreshRanges(sheet.Range["A4:F4"], sheet.Range["M4"])

# Save the resulting workbook to file
workbook.SaveToFile("ModifySparklines.xlsx", ExcelVersion.Version2016)
workbook.Dispose()
Delete Sparklines from Excel in Python
Spire.XLS for Python allows you to remove specific sparklines from a sparkline group and to remove the entire sparkline group from an Excel worksheet.
The following steps explain how to remove an entire sparkline group or specific sparklines from a sparkline group using Spire.XLS for Python:
- Create an object of the Workbook class
- Load an Excel file using Workbook.LoadFromFile() method.
- Get a specific worksheet using Workbook.Worksheets[index] property.
- Get a specific sparkline group in the worksheet using Worksheet.SparklineGroups[index] property.
- Delete the entire sparkline group using Worksheet.SparklineGroups.Clear() method. Or delete a specific sparkline using ISparklines.Remove() method.
- Save the resulting file using Workbook.SaveToFile() method.
- Python
from spire.xls import *
from spire.xls.common import *

# Create a Workbook object
workbook = Workbook()
# Load an Excel file that contains sparklines
workbook.LoadFromFile("AddSparklines.xlsx")

# Get the first worksheet in the workbook
sheet = workbook.Worksheets[0]

# Get the first sparkline group in the worksheet
sparklineGroup = sheet.SparklineGroups[0]
# Remove the first sparkline group from the worksheet
sheet.SparklineGroups.Clear(sparklineGroup)

# # Remove the first sparkline
# sparklines = sparklineGroup[0]
# sparklines.Remove(sparklines[0])

# Save the resulting workbook to file
workbook.SaveToFile("RemoveSparklines.xlsx", ExcelVersion.Version2016)
workbook.Dispose()
Apply for a Temporary License
If you'd like to remove the evaluation message from the generated documents, or to get rid of the function limitations, please request a 30-day trial license for yourself.
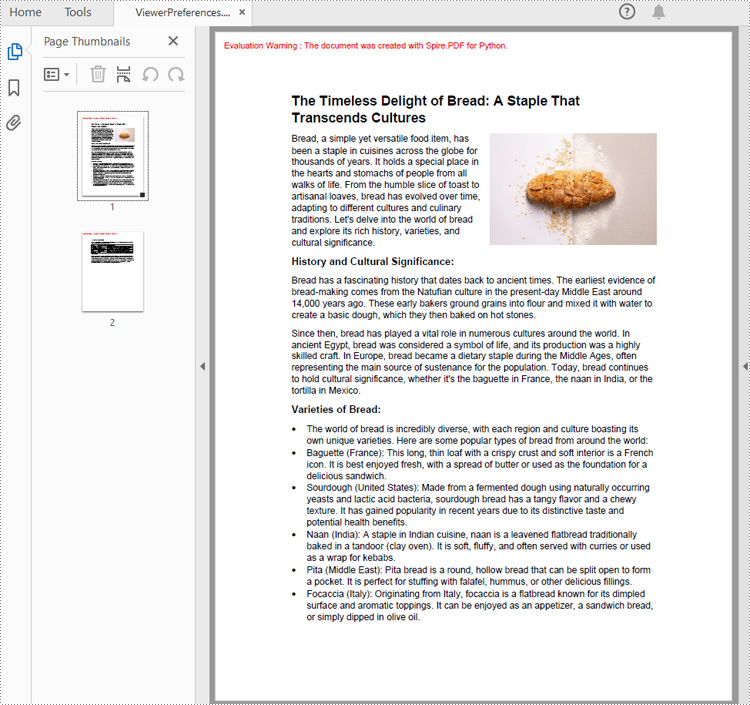
Setting view preferences in PDF documents is a crucial feature that can significantly enhance user experience. By configuring options like page layout, display mode, and zoom level, you ensure recipients view the document as intended, without manual adjustments. This is especially useful for business reports, design plans, or educational materials, where consistent presentation is crucial for effectively delivering information and leaving a professional impression. This article will show how to set view preferences of PDF documents with Python code using Spire.PDF for Python.
Install Spire.PDF for Python
This scenario requires Spire.PDF for Python and plum-dispatch v1.7.4. They can be easily installed in your Windows through the following pip command.
pip install Spire.PDF
If you are unsure how to install, please refer to: How to Install Spire.PDF for Python on Windows
Set PDF Viewer Preferences with Python
Viewer preferences allow document creators to define how a PDF document is displayed when opened, including page layout, window layout, and display mode. Developers can use the properties under ViewerPreferences class to set those display options. The detailed steps are as follows:
- Create a PdfDocument object.
- Load a PDF document using PdfDocument.LoadFromFile() method.
- Get the ViewerPreferences through using PdfDocument.ViewerPreferences property.
- Set the viewer preferences using properties under ViewerPreferences class.
- Save the document using PdfDocument.SaveToFile() method.
- Python
from spire.pdf import *

# Create a PdfDocument object
pdf = PdfDocument()

# Load a PDF file
pdf.LoadFromFile("Sample.pdf")

# Get the viewer preferences
preferences = pdf.ViewerPreferences

# Set the viewer preferences
preferences.FitWindow = True
preferences.CenterWindow = True
preferences.HideMenubar = True
preferences.HideToolbar = True
preferences.DisplayTitle = True
preferences.HideWindowUI = True
preferences.PageLayout = PdfPageLayout.SinglePage
preferences.BookMarkExpandOrCollapse = True
preferences.PrintScaling = PrintScalingMode.AppDefault
preferences.PageMode = PdfPageMode.UseThumbs

# Save the document
pdf.SaveToFile("output/ViewerPreferences.pdf")
pdf.Close()
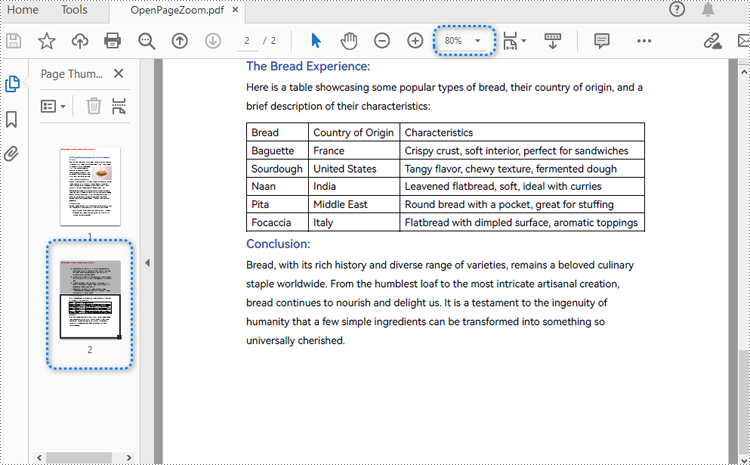
Set the Opening Page and Zoom Level with Python
By creating PDF actions and setting them to be executed when the document is opened, developers can configure additional viewer preferences, such as the initial page display and zoom level. Here are the steps to follow:
- Create a PdfDocument object.
- Load a PDF document using PdfDocument.LoadFromFile() method.
- Get a page using PdfDocument.Pages.get_Item() method.
- Create a PdfDestination object and set the location and zoom factor of the destination.
- Create a PdfGoToAction object using the destination.
- Set the action as the document open action through PdfDocument.AfterOpenAction property.
- Save the document using PdfDocument.SaveToFile() method.
- Python
from spire.pdf import *

# Create a PdfDocument object
pdf = PdfDocument()

# Load a PDF file
pdf.LoadFromFile("Sample1.pdf")

# Get the second page
page = pdf.Pages.get_Item(1)

# Create a PdfDestination object
dest = PdfDestination(page)
# Set the location and zoom factor of the destination
dest.Mode = PdfDestinationMode.Location
dest.Location = PointF(0.0, page.Size.Height / 2)
dest.Zoom = 0.8

# Create a PdfGoToAction object
action = PdfGoToAction(dest)

# Set the action as the document open action
pdf.AfterOpenAction = action

# Save the document
pdf.SaveToFile("output/OpenPageZoom.pdf")
pdf.Close()
Apply for a Temporary License
If you'd like to remove the evaluation message from the generated documents, or to get rid of the function limitations, please request a 30-day trial license for yourself.
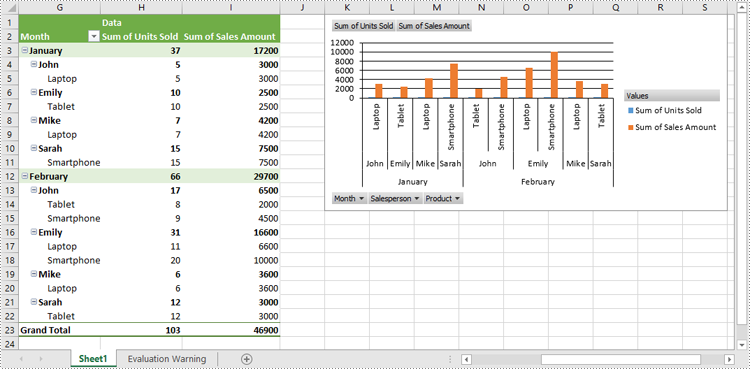
Pivot charts are a powerful tool in Excel that allows you to visualize data from pivot tables in an easy-to-understand format. They enable users to summarize large datasets, highlight trends, and make data-driven decisions through interactive graphs. Whether you're analyzing sales figures, performance metrics, or any other form of data, pivot charts provide a dynamic way to represent complex data visually. In this article, we will demonstrate how to create pivot charts in Excel in Python using Spire.XLS for Python.
- Create Pivot Charts in Excel in Python
- Show or Hide Field Buttons in Pivot Charts in Excel in Python
- Format Pivot Chart Series in Excel in Python
Install Spire.XLS for Python
This scenario requires Spire.XLS for Python and plum-dispatch v1.7.4. They can be easily installed in your Windows through the following pip command.
pip install Spire.XLS
If you are unsure how to install, please refer to this tutorial: How to Install Spire.XLS for Python on Windows
Create Pivot Charts in Excel in Python
Spire.XLS for Python provides the Worksheet.Charts.Add(pivotChartType:ExcelChartType, pivotTable:IPivotTable) method to create a pivot chart based on a specific pivot table in Excel. The detailed steps are as follows:
- Create an object of the Workbook class.
- Load an Excel file using Workbook.LoadFromFile() method.
- Get a specific worksheet in the Excel file using Workbook.Worksheets[index] property.
- Get a specific pivot table in the worksheet using Worksheet.PivotTables[index] property.
- Add a pivot chart based on the pivot table to the worksheet using Worksheet.Charts.Add(pivotChartType:ExcelChartType, pivotTable:IPivotTable) method.
- Set the position and title of the pivot chart.
- Save the resulting file using Workbook.SaveToFile() method.
- Python
from spire.xls import *
from spire.xls.common import *

# Create a Workbook object
workbook = Workbook()
# Load an Excel file
workbook.LoadFromFile("PivotTable.xlsx")

# Get the first worksheet
sheet = workbook.Worksheets[0]

# Get the first pivot table in the worksheet
pivotTable = sheet.PivotTables[0]

# Create a clustered column chart based on the pivot table
pivotChart = sheet.Charts.Add(ExcelChartType.ColumnClustered, pivotTable)
# Set chart position
pivotChart.TopRow = 1
pivotChart.LeftColumn = 11
pivotChart.RightColumn = 20
pivotChart.BottomRow = 15

# Set chart title to null
pivotChart.ChartTitle = ""

# Save the resulting file
workbook.SaveToFile("CreatePivotChart.xlsx", ExcelVersion.Version2013)
workbook.Dispose()
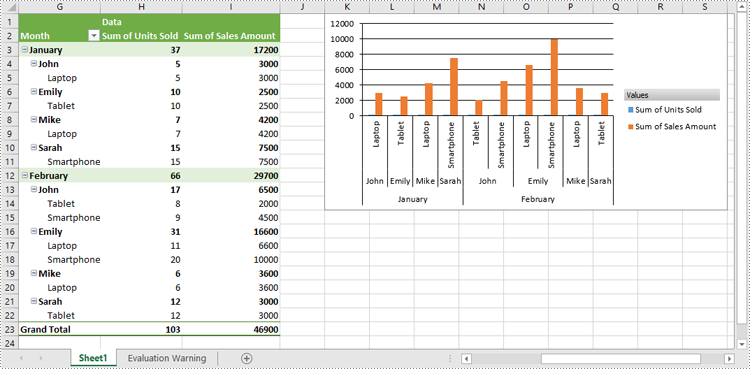
Show or Hide Field Buttons in Pivot Charts in Excel in Python
You can show or hide the following field buttons in a pivot chart with Spire.XLS for Python:
- Entire Field Buttons
- Report Filter Field Buttons
- Legend Field Buttons
- Axis Field Buttons
- Value Field Buttons
The detailed steps are as follows:
- Create an object of the Workbook class.
- Load an Excel file using Workbook.LoadFromFile() method.
- Get a specific worksheet in the Excel file using Workbook.Worksheets[index] property.
- Get a specific pivot table in the worksheet using Worksheet.PivotTables[index] property.
- Add a pivot chart based on the pivot table to the worksheet using Worksheet.Charts.Add(pivotChartType:ExcelChartType, pivotTable:IPivotTable) method.
- Set the position and title of the pivot chart.
- Hide specific field buttons in the pivot chart, such as the axis field buttons and the value field buttons, using Chart.DisplayAxisFieldButtons and Chart.DisplayValueFieldButtons properties.
- Save the resulting file using Workbook.SaveToFile() method.
- Python
from spire.xls import *
from spire.xls.common import *

# Create a Workbook object
workbook = Workbook()
# Load an Excel file
workbook.LoadFromFile("CreatePivotChart.xlsx")

# Get the first worksheet
sheet = workbook.Worksheets[0]

# Get the first pivot table in the worksheet
pivotTable = sheet.PivotTables[0]

# Create a clustered column chart based on the pivot table
pivotChart = sheet.Charts.Add(ExcelChartType.ColumnClustered, pivotTable)
# Set chart position
pivotChart.TopRow = 1
pivotChart.LeftColumn = 11
pivotChart.RightColumn = 20
pivotChart.BottomRow = 15

# Set chart title to null
pivotChart.ChartTitle = ""

# Hide specific field buttons
pivotChart.DisplayAxisFieldButtons = False
pivotChart.DisplayValueFieldButtons = False
# pivotChart.DisplayLegendFieldButtons = False
# pivotChart.ShowReportFilterFieldButtons = False
# pivotChart.DisplayEntireFieldButtons = False

# Save the resulting file
workbook.SaveToFile("HideFieldButtons.xlsx", ExcelVersion.Version2013)
workbook.Dispose()
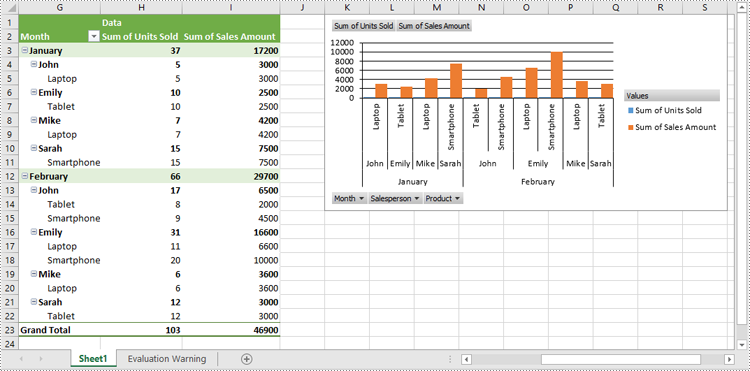
Format Pivot Chart Series in Excel in Python
When generating a pivot chart using a pivot table as the data source with Spire.XLS for Python, the chart series are not automatically created. You need to add the series to the pivot chart and then apply the desired formatting. The detailed steps are as follows.
- Create an object of the Workbook class.
- Load an Excel file using Workbook.LoadFromFile() method.
- Get a specific worksheet in the Excel file using Workbook.Worksheets[index] property.
- Get a specific pivot table in the worksheet using Worksheet.PivotTables[index] property.
- Add a pivot chart based on the pivot table to the worksheet using Worksheet.Charts.Add(pivotChartType:ExcelChartType, pivotTable:IPivotTable) method.
- Set the position and title of the pivot chart.
- Add series to the chart using Chart.Series.Add() method and then apply the desired formatting to the series.
- Save the resulting file using Workbook.SaveToFile() method.
- Python
from spire.xls import *
from spire.xls.common import *

# Create a Workbook object
workbook = Workbook()
# Load an Excel file
workbook.LoadFromFile("CreatePivotChart.xlsx")

# Get the first worksheet
sheet = workbook.Worksheets[0]

# Get the first pivot table in the worksheet
pivotTable = sheet.PivotTables[0]

# Create a clustered column chart based on the pivot table
pivotChart = sheet.Charts.Add(ExcelChartType.ColumnClustered, pivotTable)
# Set chart position
pivotChart.TopRow = 1
pivotChart.LeftColumn = 11
pivotChart.RightColumn = 20
pivotChart.BottomRow = 15

# Set chart title to null
pivotChart.ChartTitle = ""

# Add chart series
series = pivotChart.Series.Add(ExcelChartType.ColumnClustered)
# Set bar width
series.GetCommonSerieFormat().GapWidth = 10
# Set overlap
# series.GetCommonSerieFormat().Overlap = 100

# Save the resulting file
workbook.SaveToFile("FormatChartSeries.xlsx", ExcelVersion.Version2013)
workbook.Dispose()
Apply for a Temporary License
If you'd like to remove the evaluation message from the generated documents, or to get rid of the function limitations, please request a 30-day trial license for yourself.
