
Knowledgebase (2370)
Children categories
There are articles in our tutorials that introduce how to add trendline, error bars and data tables to Excel charts in C# using Spire.XLS. It's worthy of mention that Spire.XLS also supports data labels which are widely used to quickly identify a data series in a chart. In label options, we could set whether label contains series name, category name, value, percentages (pie chart) and legend key. This article is going to introduce the method to set and format data labels for Excel charts in C# using Spire.XLS.
Note: before start, please download the latest version of Spire.XLS and add the .dll in the bin folder as the reference of Visual Studio.
Step 1: Create an Excel document and add sample data.
            Workbook workbook = new Workbook();
            workbook.CreateEmptySheets(1);
            Worksheet sheet = workbook.Worksheets[0];
            sheet.Name = "Demo";
            sheet.Range["A1"].Value = "Month";
            sheet.Range["A2"].Value = "Jan";
            sheet.Range["A3"].Value = "Feb";
            sheet.Range["A4"].Value = "Mar";
            sheet.Range["A5"].Value = "Apr";
            sheet.Range["A6"].Value = "May";
            sheet.Range["A7"].Value = "Jun";
            sheet.Range["B1"].Value = "Peter";
            sheet.Range["B2"].NumberValue = 25;
            sheet.Range["B3"].NumberValue = 18;
            sheet.Range["B4"].NumberValue = 8;
            sheet.Range["B5"].NumberValue = 13;
            sheet.Range["B6"].NumberValue = 22;
            sheet.Range["B7"].NumberValue = 28;
Step 2: Create a line markers chart based on the sample data.
            Chart chart = sheet.Charts.Add(ExcelChartType.LineMarkers);
            chart.DataRange = sheet.Range["B1:B7"];
            chart.PlotArea.Visible = false;
            chart.SeriesDataFromRange = false;
            chart.TopRow = 5;
            chart.BottomRow = 26;
            chart.LeftColumn = 2;
            chart.RightColumn =11;
            chart.ChartTitle = "Data Labels Demo";
            chart.ChartTitleArea.IsBold = true;
            chart.ChartTitleArea.Size = 12;
            Spire.Xls.Charts.ChartSerie cs1 = chart.Series[0];
            cs1.CategoryLabels = sheet.Range["A2:A7"];
Step 3: Set which parts are displayed in the data labels and the delimiter to separate them.
            cs1.DataPoints.DefaultDataPoint.DataLabels.HasValue = true;
            cs1.DataPoints.DefaultDataPoint.DataLabels.HasLegendKey = false;
            cs1.DataPoints.DefaultDataPoint.DataLabels.HasPercentage = false;
            cs1.DataPoints.DefaultDataPoint.DataLabels.HasSeriesName = true;
            cs1.DataPoints.DefaultDataPoint.DataLabels.HasCategoryName = true;
            cs1.DataPoints.DefaultDataPoint.DataLabels.Delimiter = ". ";
Step 4: Set the font, position and fill effects for data labels in the chart.
            cs1.DataPoints.DefaultDataPoint.DataLabels.Size = 9;
            cs1.DataPoints.DefaultDataPoint.DataLabels.Color = Color.Red;
            cs1.DataPoints.DefaultDataPoint.DataLabels.FontName = "Calibri";
            cs1.DataPoints.DefaultDataPoint.DataLabels.Position = DataLabelPositionType.Center;
            cs1.DataPoints.DefaultDataPoint.DataLabels.FrameFormat.Fill.Texture = GradientTextureType.Papyrus;
Step 5: Save the document as Excel 2010.
            workbook.SaveToFile("S3.xlsx", ExcelVersion.Version2010);
            System.Diagnostics.Process.Start("S3.xlsx");
Effects:

Full Codes:
using System;
using System.Collections.Generic;
using System.Linq;
using System.Text;
using Spire.Xls;
using System.Drawing;

namespace ConsoleApplication2
{
    class Program
    {
        static void Main(string[] args)
        {

            Workbook workbook = new Workbook();
            workbook.CreateEmptySheets(1);
            Worksheet sheet = workbook.Worksheets[0];

            sheet.Name = "Demo";
            sheet.Range["A1"].Value = "Month";
            sheet.Range["A2"].Value = "Jan";
            sheet.Range["A3"].Value = "Feb";
            sheet.Range["A4"].Value = "Mar";
            sheet.Range["A5"].Value = "Apr";
            sheet.Range["A6"].Value = "May";
            sheet.Range["A7"].Value = "Jun";
            sheet.Range["B1"].Value = "Peter";
            sheet.Range["B2"].NumberValue = 25;
            sheet.Range["B3"].NumberValue = 18;
            sheet.Range["B4"].NumberValue = 8;
            sheet.Range["B5"].NumberValue = 13;
            sheet.Range["B6"].NumberValue = 22;
            sheet.Range["B7"].NumberValue = 28;

            Chart chart = sheet.Charts.Add(ExcelChartType.LineMarkers);
            chart.DataRange = sheet.Range["B1:B7"];
            chart.PlotArea.Visible = false;
            chart.SeriesDataFromRange = false;
            chart.TopRow = 5;
            chart.BottomRow = 26;
            chart.LeftColumn = 2;
            chart.RightColumn =11;
            chart.ChartTitle = "Data Labels Demo";
            chart.ChartTitleArea.IsBold = true;
            chart.ChartTitleArea.Size = 12;
            Spire.Xls.Charts.ChartSerie cs1 = chart.Series[0];
            cs1.CategoryLabels = sheet.Range["A2:A7"];

            cs1.DataPoints.DefaultDataPoint.DataLabels.HasValue = true;
            cs1.DataPoints.DefaultDataPoint.DataLabels.HasLegendKey = false;
            cs1.DataPoints.DefaultDataPoint.DataLabels.HasPercentage = false;
            cs1.DataPoints.DefaultDataPoint.DataLabels.HasSeriesName = true;
            cs1.DataPoints.DefaultDataPoint.DataLabels.HasCategoryName = true;
            cs1.DataPoints.DefaultDataPoint.DataLabels.Delimiter = ". ";

            cs1.DataPoints.DefaultDataPoint.DataLabels.Size = 9;
            cs1.DataPoints.DefaultDataPoint.DataLabels.Color = Color.Red;
            cs1.DataPoints.DefaultDataPoint.DataLabels.FontName = "Calibri";
            cs1.DataPoints.DefaultDataPoint.DataLabels.Position = DataLabelPositionType.Center;
            cs1.DataPoints.DefaultDataPoint.DataLabels.FrameFormat.Fill.Texture = GradientTextureType.Papyrus;

            workbook.SaveToFile("S3.xlsx", ExcelVersion.Version2010);
            System.Diagnostics.Process.Start("S3.xlsx");
        }
    }
}
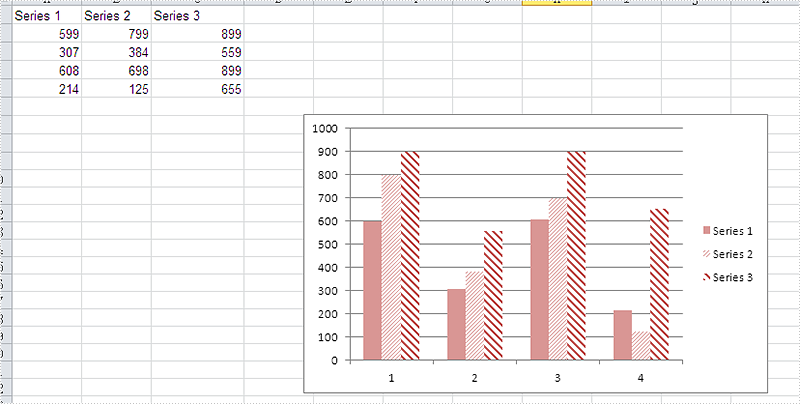
As a powerful Excel library, Spire.XLS supports to work with many kinds of charts and it also supports to set the performance for the chart. We have already shown you how to fill the excel chart with background image to make the chart more attractive. This article will show you how to fill the excel chart with background color in C#.
Please check the original Excel chart without any background color:
Code Snippet for Inserting Background color:
Step 1: Create a new workbook and load from file.
Workbook workbook = new Workbook();
workbook.LoadFromFile("sample.xlsx");
Step 2: Get the first worksheet from workbook and then get the first chart from the worksheet.
Worksheet ws = workbook.Worksheets[0];
Chart chart = ws.Charts[0];
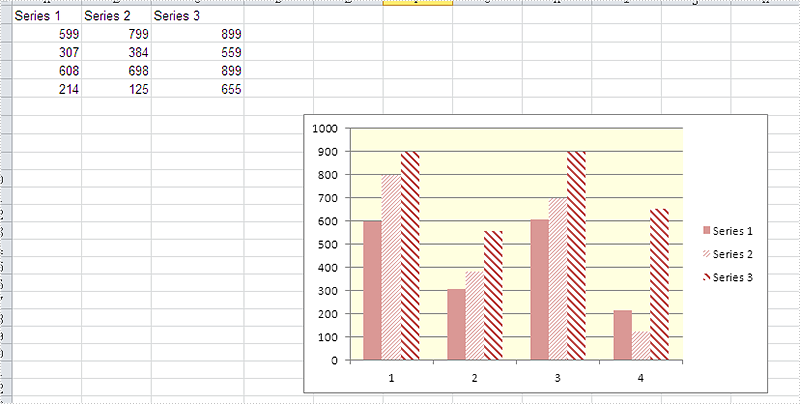
Step 3: Set the property to ForeGroundColor for PlotArea to fill the background color for the chart.
chart.PlotArea.ForeGroundColor = System.Drawing.Color.LightYellow;
Step 4: Save the document to file.
workbook.SaveToFile("result.xlsx",ExcelVersion.Version2010);
Effective screenshot after fill the background color for Excel chart:
Full codes:
using Spire.Xls;
namespace SetBackgroundColor
{
    class Program
    {

        static void Main(string[] args)
        {
            Workbook workbook = new Workbook();
            workbook.LoadFromFile("sample.xlsx");

            Worksheet ws = workbook.Worksheets[0];
            Chart chart = ws.Charts[0];

            chart.PlotArea.ForeGroundColor = System.Drawing.Color.LightYellow;

            workbook.SaveToFile("result.xlsx", ExcelVersion.Version2010);
        }

    }
}
Nowadays, we're facing a bigger chance to download a file from URL since more documents are electronically delivered by internet. In this article, I'll introduce how to download a Word document from URL programmatically using Spire.Doc in C#, VB.NET.
Spire.Doc does not provide a method to download a Word file directly from URL. However, you can download the file from URL into a MemoryStream and then use Spire.Doc to load the document from MemoryStream and save as a new Word document to local folder.
Code Snippet:
Step 1: Initialize a new Word document.
Document doc = new Document();
Step 2: Initialize a new instance of WebClient class.
WebClient webClient = new WebClient();
Step 3: Call WebClient.DownloadData(string address) method to load the data from URL. Save the data to a MemoryStream, then call Document.LoadFromStream() method to load the Word document from MemoryStream.
using (MemoryStream ms = new MemoryStream(webClient.DownloadData("http://www.e-iceblue.com/images/test.docx")))
{
    doc.LoadFromStream(ms,FileFormat.Docx);
}
Step 4: Save the file.
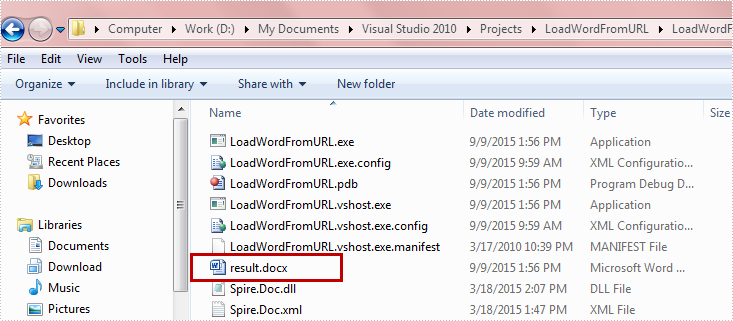
doc.SaveToFile("result.docx",FileFormat.Docx);
Run the program, the targeted file will be downloaded and saved as a new Word file in Bin folder.
Full Code:
using Spire.Doc;
using System.IO;
using System.Net;

namespace DownloadfromURL
{
    class Program
    {
        static void Main(string[] args)
        {
            Document doc = new Document();
            WebClient webClient = new WebClient();
            using (MemoryStream ms = new MemoryStream(webClient.DownloadData("http://www.e-iceblue.com/images/test.docx")))
            {
                doc.LoadFromStream(ms, FileFormat.Docx);
            }
            doc.SaveToFile("result.docx", FileFormat.Docx);
        }
    }
}
Imports Spire.Doc
Imports System.IO
Imports System.Net
Namespace DownloadfromURL
	Class Program
		Private Shared Sub Main(args As String())
			Dim doc As New Document()
			Dim webClient As New WebClient()
Using ms As New MemoryStream(webClient.DownloadData("http://www.e-iceblue.com/images/test.docx"))
				doc.LoadFromStream(ms, FileFormat.Docx)
			End Using
			doc.SaveToFile("result.docx", FileFormat.Docx)

		End Sub
	End Class
End Namespace
