
Python (365)
Protecting valuable and sensitive information from unauthorized access is a crucial task for individuals and organizations alike. When it comes to sharing and storing confidential Word documents, such as financial records, legal documents, or personal records, encrypting the documents provides extra protection for their security and confidentiality. Moreover, using Python, users can easily encrypt large numbers of Word documents. This article shows how to use Spire.Doc for Python to encrypt Word documents in Python programs.
- Encrypt a Word Document with a Password
- Change the Password of a Word Document
- Remove the Encryption from a Word Document
Install Spire.Doc for Python
This scenario requires Spire.Doc for Python and plum-dispatch v1.7.4. They can be easily installed in your Windows through the following pip command.
pip install Spire.Doc
If you are unsure how to install, please refer to: How to Install Spire.Doc for Python on Windows
Encrypt a Word Document with a Password
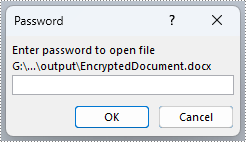
Using the Document.Encrypt(password: str) method provided by Spire.Doc for Python, developers can set an open password for a Word document, ensuring that only authorized people can open and view the document. The detailed steps for encrypting a Word document with a password are as follows:
- Create an instance of Document class.
- Load a Word document using Document.LoadFromFile() method.
- Encrypt the document using Document.Encrypt() method.
- Save the document using Document.SaveToFile() method.
- Python
from spire.doc import *
from spire.doc.common import *

# Create an instance of Document class
doc = Document()

# Load a Word document
doc.LoadFromFile("Sample.docx")

# Encrypt the document
doc.Encrypt("password")

# Save the document
doc.SaveToFile("output/EncryptedDocument.docx")
doc.Close()
Change the Encryption from a Word Document
By passing the password as the parameter, developers can load an encrypted document using Document.LoadFromFile(fileName: str, fileFormat: FileFormat, password: str) method. After loading the encrypted document, the Document.Encrypt() method can be used to set a new password. The detailed steps are as follows:
- Create an instance of Document class.
- Load an encrypted Word document using Document.LoadFromFile() method.
- Change the password of the document using Document.Encrypt() method.
- Save the document using Document.SaveToFile() method.
- Python
from spire.doc import *
from spire.doc.common import *

# Create an instance of Document class
doc = Document()

# Load an encrypted Word document
doc.LoadFromFile("output/EncryptedDocument.docx", FileFormat.Docx, "password")

# Change the password
doc.Encrypt("password1")

# Save the document
doc.SaveToFile("output/ChangeDocument.docx")
doc.Close()
Remove the Password from a Word Document
After loading an encrypted Word document, developers can also use Document.RemoveEncryption() method to remove the encryption from the document directly, thus making the document available to all users. The detailed steps are as follows:
- Create an instance of Document class.
- Load an encrypted Word document using Document.LoadFromFile() method.
- Remove the password using Document.RemoveEncryption() method.
- Save the document using Document.SaveToFile() method.
- Python
from spire.doc import *
from spire.doc.common import *

# Create an instance of Document class
doc = Document()

# Load an encrypted Word document
doc.LoadFromFile("output/EncryptedDocument.docx", FileFormat.Auto, "password")

# Remove the password
doc.RemoveEncryption()

# Save the document
doc.SaveToFile("output/RemovePassword.docx", FileFormat.Docx)
doc.Close()
Apply for a Temporary License
If you'd like to remove the evaluation message from the generated documents, or to get rid of the function limitations, please request a 30-day trial license for yourself.
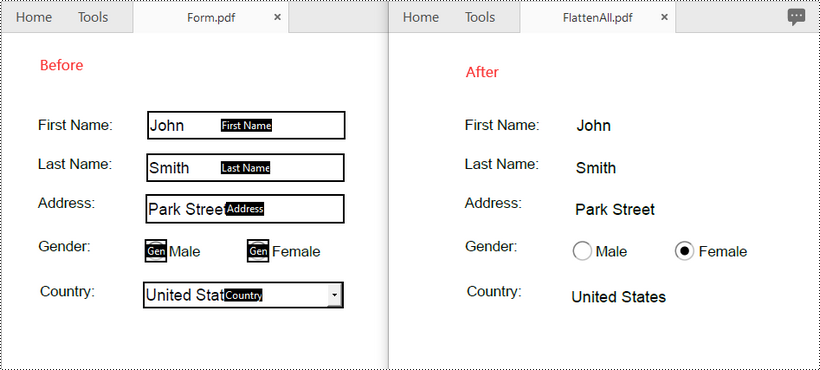
Flattening forms in PDF means transforming the interactive form fields (such as text boxes, checkboxes, and drop-down menus) into static content. Once a form is flattened, it cannot be edited or filled out anymore. When you need to maintain a permanent and unalterable record of a completed form, flattening is essential. This ensures that the data entered into the form fields cannot be modified or tampered with, providing a reliable reference for future use. In this article, we will demonstrate how to flatten forms in PDF in Python using Spire.PDF for Python.
Install Spire.PDF for Python
This scenario requires Spire.PDF for Python and plum-dispatch v1.7.4. They can be easily installed in your Windows through the following pip command.
pip install Spire.PDF
If you are unsure how to install, please refer to this tutorial: How to Install Spire.PDF for Python on Windows
Flatten All Forms in a PDF in Python
Spire.PDF for Python provides the PdfDocument.Form.IsFlatten property, which enables you to flatten all forms in a PDF file. The detailed steps are as follows.
- Create an object of the PdfDocument class.
- Load a PDF file using PdfDocument.LoadFromFile() method.
- Flatten all forms in the PDF file by setting the PdfDocument.Form.IsFlatten property to True.
- Save the result file using PdfDocument.SaveToFile() method.
- Python
from spire.pdf.common import *
from spire.pdf import *

# Specify the input and output PDF file paths
input_file = "Form.pdf"
output_file = "FlattenAll.pdf"

# Create an object of the PdfDocument class
doc = PdfDocument()
# Load a PDF file
doc.LoadFromFile(input_file)

# Flatten all forms in the PDF file
doc.Form.IsFlatten = True

# Save the result file
doc.SaveToFile(output_file)
doc.Close()
Flatten a Specific Form in a PDF in Python
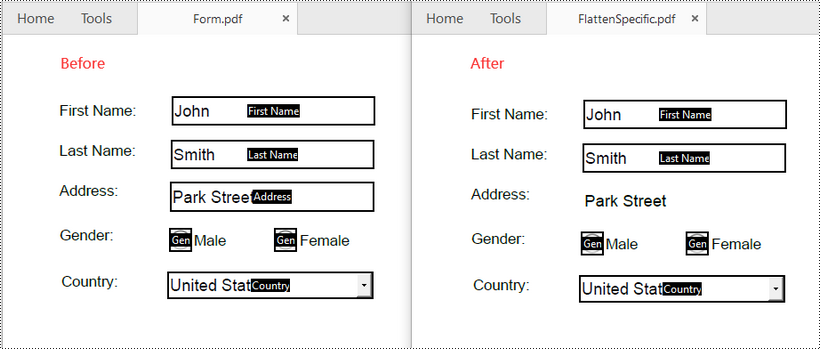
To flatten a specific form in a PDF file, you can use the PdfField.Flatten property. The detailed steps are as follows.
- Create an object of the PdfDocument class.
- Load a PDF file using the PdfDocument.LoadFromFile() method.
- Get the forms of the PDF file using PdfDocument.Form property.
- Get a specific form by its index or name using PdfFormWidget.FieldsWidget.get_Item() method.
- Flatten the form by setting the PdfField.Flatten property to True.
- Save the result file using PdfDocument.SaveToFile() method.
- Python
from spire.pdf.common import *
from spire.pdf import *

# Specify the input and output PDF file paths
input_file = "Form.pdf"
output_file = "FlattenSpecific.pdf"

# Create an object of the PdfDocument class
doc = PdfDocument()
# Load a PDF file
doc.LoadFromFile(input_file)

# Get the forms of the PDF file
loadedForm = doc.Form

# Get a specific form by its index or name
formWidget = PdfFormWidget(loadedForm)
form = formWidget.FieldsWidget.get_Item(2)
# form = formWidget.FieldsWidget.get_Item("Address")

# Flatten the specific form
form.Flatten = True

# Save the result file
doc.SaveToFile(output_file)
doc.Close()
Apply for a Temporary License
If you'd like to remove the evaluation message from the generated documents, or to get rid of the function limitations, please request a 30-day trial license for yourself.
Python: Create a Pie Chart or a Doughnut Chart in PowerPoint
2024-03-19 01:13:26 Written by AdministratorPie charts and doughnut charts are two popular types of data visualization tools that are widely used to show the proportional distribution of categories within the whole. Both charts can serve as powerful communication aids, allowing viewers to quickly grasp the significance of each component and how it relates to the overall picture.
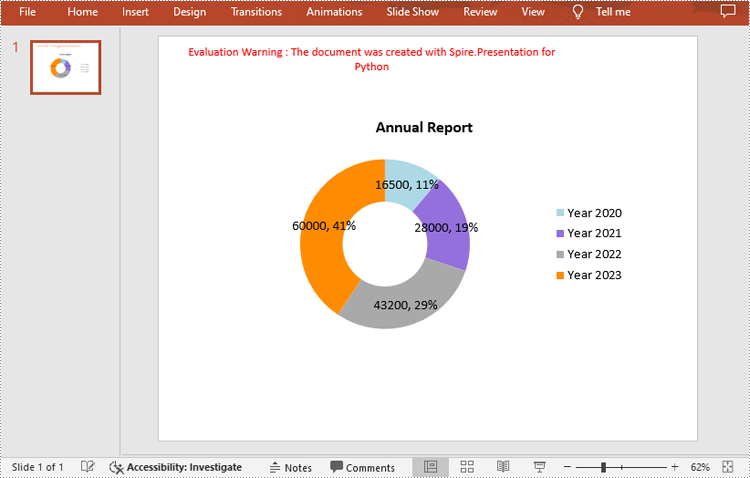
While pie charts and doughnut charts share many similarities, they also have unique characteristics that make them suitable for different analytical scenarios. In this article, you will learn how to create a pie chart or a doughnut chart in PowerPoint with Python using Spire.Presentation for Python.
Install Spire.Presentation for Python
This scenario requires Spire.Presentation for Python and plum-dispatch v1.7.4. They can be easily installed in your Windows through the following pip command.
pip install Spire.Presentation
If you are unsure how to install, please refer to this tutorial: How to Install Spire.Presentation for Python on Windows
Create a Pie Chart in PowerPoint with Python
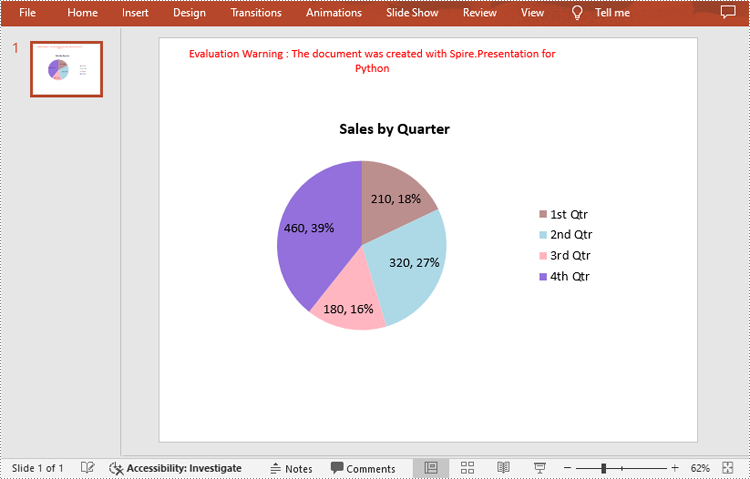
Pie charts are designed to resemble a circle, which is divided into sections or "slices", with each slice representing a portion of the whole.
With Spire.Prensetion for Python, you can add a pie chart to a presentation slide using the ISlide.Shapes.AppendChartInit(type: ChartType, rectangle: RectangleF, init: bool) method and specify the chart type as Pie. The following are the detailed steps.
- Create a Presentation instance.
- Get the first slide using Prenstion.Slides[] property.
- Add a pie chart at a specified location on the side using ISlide.Shapes.AppendChartInit(type: ChartType, rectangle RectangleF, init bool).
- Set and format the chart title.
- Define some data and append the data to the chart sheet as chart data using IChart.ChartData property.
- Set series labels, category labels, series values and other attributes using the properties of the IChart class.
- Set to show label value and percentage value.
- Save the result file using Presentation.SaveToFile() method.
- Python
from spire.presentation.common import *
from spire.presentation import *

# Create a Presentation instance
presentation = Presentation()

# Add a pie chart at a specified location on the first slide
rect = RectangleF.FromLTRB (40, 100, 590, 420)
chart = presentation.Slides[0].Shapes.AppendChartInit (ChartType.Pie, rect, False)

# Set and format chart title
chart.ChartTitle.TextProperties.Text = "Sales by Quarter"
chart.ChartTitle.TextProperties.IsCentered = True
chart.ChartTitle.Height = 30
chart.HasTitle = True

# Define some data
quarters = ["1st Qtr", "2nd Qtr", "3rd Qtr", "4th Qtr"]
sales = [210, 320, 180, 460]

# Append data to ChartData, which represents a data table where the chart data is stored
chart.ChartData[0,0].Text = "Quarters"
chart.ChartData[0,1].Text = "Sales"
i = 0
while i < len(quarters):
    chart.ChartData[i + 1,0].Text = quarters[i]
    chart.ChartData[i + 1,1].NumberValue = sales[i]
    i += 1

# Set series labels and category labels
chart.Series.SeriesLabel = chart.ChartData["B1","B1"]
chart.Categories.CategoryLabels = chart.ChartData["A2","A5"]

# Set values for series
chart.Series[0].Values = chart.ChartData["B2","B5"]

# Add data points to series
for i, unusedItem in enumerate(chart.Series[0].Values):
    cdp = ChartDataPoint(chart.Series[0])
    cdp.Index = i
    chart.Series[0].DataPoints.Add(cdp)

# Fill each data point with a different color
chart.Series[0].DataPoints.get_Item(0).Fill.FillType = FillFormatType.Solid
chart.Series[0].DataPoints.get_Item(0).Fill.SolidColor.Color = Color.get_RosyBrown()
chart.Series[0].DataPoints.get_Item(1).Fill.FillType = FillFormatType.Solid
chart.Series[0].DataPoints.get_Item(1).Fill.SolidColor.Color = Color.get_LightBlue()
chart.Series[0].DataPoints.get_Item(2).Fill.FillType = FillFormatType.Solid
chart.Series[0].DataPoints.get_Item(2).Fill.SolidColor.Color = Color.get_LightPink()
chart.Series[0].DataPoints.get_Item(3).Fill.FillType = FillFormatType.Solid
chart.Series[0].DataPoints.get_Item(3).Fill.SolidColor.Color = Color.get_MediumPurple()

# Set the data labels to display label value and percentage value
chart.Series[0].DataLabels.LabelValueVisible = True
chart.Series[0].DataLabels.PercentValueVisible = True

# Save the result file
presentation.SaveToFile("CreatePieChart.pptx", FileFormat.Pptx2016)
presentation.Dispose()
Create a Doughnut Chart in PowerPoint with Python
Doughnut charts are very similar to pie charts, with the primary difference being the presence of a "hole" in the center. This hole can be used to display additional information or to maintain a cleaner look.
To add a donut chart to a presentation slide, you can specify the ChartType parameter of ISlide.Shapes.AppendChartInit() method as Doughnut. The following are the detailed steps.
- Create a Presentation instance.
- Get the first slide using Prenstion.Slides[] property.
- Add a doughnut chart at a specified location on the side using ISlide.Shapes.AppendChartInit(type: ChartType, rectangle: RectangleF, init: bool).
- Define some data and append the data to the chart sheet as chart data using IChart.ChartData property.
- Set series labels, category labels, series values and other attributes using the properties of the IChart class.
- Set to show label value and percentage value.
- Save the result file using Presentation.SaveToFile() method.
- Python
from spire.presentation.common import *
from spire.presentation import *

# Create a Presentation instance
presentation = Presentation()

# Add a doughnut chart at a specified location on the first slide
rect = RectangleF.FromLTRB (80, 100, 630, 420)
chart = presentation.Slides[0].Shapes.AppendChartInit(ChartType.Doughnut, rect, False)

# Set and format chart title
chart.ChartTitle.TextProperties.Text = "Annual Report"
chart.ChartTitle.TextProperties.IsCentered = True
chart.ChartTitle.Height = 30

# Define some data
years = ["Year 2020", "Year 2021", "Year 2022", "Year 2023"]
sales = [16500, 28000, 43200, 60000]

# Append data to ChartData, which represents a data table where the chart data is stored
chart.ChartData[0,0].Text = "Quarters"
chart.ChartData[0,1].Text = "Sales"
i = 0
while i < len(years):
    chart.ChartData[i + 1,0].Text = years[i]
    chart.ChartData[i + 1,1].NumberValue = sales[i]
    i += 1

# Set series labels and category labels
chart.Series.SeriesLabel = chart.ChartData["B1","B1"]
chart.Categories.CategoryLabels = chart.ChartData["A2","A5"]

# Set values for series
chart.Series[0].Values = chart.ChartData["B2","B5"]

# Add data points to series
for i, item in enumerate(chart.Series[0].Values):
    cdp = ChartDataPoint(chart.Series[0])
    cdp.Index = i
    chart.Series[0].DataPoints.Add(cdp)

# Fill each data point with a different color
chart.Series[0].DataPoints.get_Item(0).Fill.FillType = FillFormatType.Solid
chart.Series[0].DataPoints.get_Item(0).Fill.SolidColor.Color = Color.get_LightBlue()
chart.Series[0].DataPoints.get_Item(1).Fill.FillType = FillFormatType.Solid
chart.Series[0].DataPoints.get_Item(1).Fill.SolidColor.Color = Color.get_MediumPurple()
chart.Series[0].DataPoints.get_Item(2).Fill.FillType = FillFormatType.Solid
chart.Series[0].DataPoints.get_Item(2).Fill.SolidColor.Color =  Color.get_DarkGray()
chart.Series[0].DataPoints.get_Item(3).Fill.FillType = FillFormatType.Solid
chart.Series[0].DataPoints.get_Item(3).Fill.SolidColor.Color = Color.get_DarkOrange()

# Set the data labels to display label value and percentage value
chart.Series[0].DataLabels.LabelValueVisible = True
chart.Series[0].DataLabels.PercentValueVisible = True

# Set the hole size of the doughnut chart
chart.Series[0].DoughnutHoleSize = 50

# Save the result file
presentation.SaveToFile("DoughnutChart.pptx", FileFormat.Pptx2016)
presentation.Dispose()
Apply for a Temporary License
If you'd like to remove the evaluation message from the generated documents, or to get rid of the function limitations, please request a 30-day trial license for yourself.
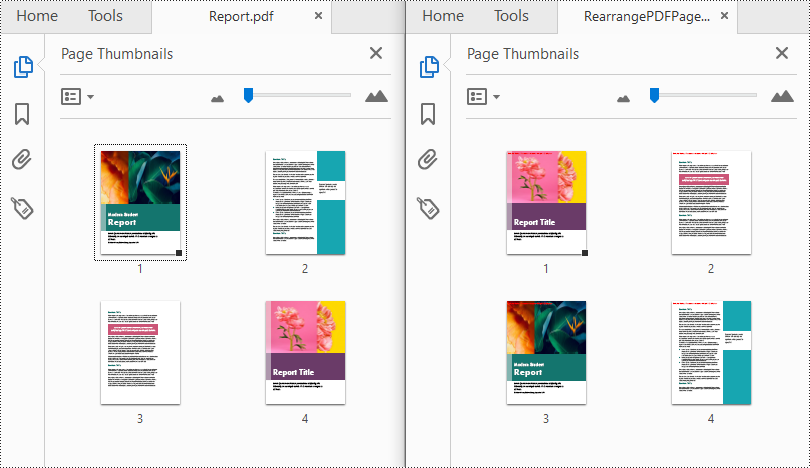
Typically, the content of a PDF document needs to follow a logical flow, such as a report is usually structured with chapters, sections, and subsections. When the pages within a PDF are not arranged in the correct sequence, the coherence of the document will be affected. By reordering the pages, you can ensure that the information is presented in a clear and understandable manner. In this article, you will learn how to reorder the pages in a PDF file with Python using Spire.PDF for Python.
Install Spire.PDF for Python
This scenario requires Spire.PDF for Python and plum-dispatch v1.7.4. They can be easily installed in your Windows through the following pip command.
pip install Spire.PDF
If you are unsure how to install, please refer to this tutorial: How to Install Spire.PDF for Python on Windows
Reorder PDF Pages with Python
Spire.PDF for Python provides the PdfDocument.Pages.ReArrange(orderArray: List[int]) method to rearrange the pages in a PDF file. The parameter orderArray is a list of integers which allows you to reorder the PDF pages by specifying the page index in the desired order.
The following are the detailed steps to rearrange the PDF page order with Python:
- Create a PdfDocument instance.
- Load a sample PDF file using PdfDocument.LoadFromFile() method.
- Rearrange the page order of the PDF file using PdfDocument.Pages.ReArrange(orderArray: List[int]) method.
- Save the result file using PdfDocument.SaveToFile() method.
- Python
from spire.pdf.common import *
from spire.pdf import *

inputFile = "Report.pdf"
outputFile = "RearrangePDFPageOrder.pdf"

# Create a PdfDocument instance
pdf = PdfDocument()

# Load a PDF file
pdf.LoadFromFile(inputFile)

# Reorder pages in the PDF file
pdf.Pages.ReArrange([3, 2, 0, 1])

# Save the result file
pdf.SaveToFile(outputFile, FileFormat.PDF)
pdf.Close()
Apply for a Temporary License
If you'd like to remove the evaluation message from the generated documents, or to get rid of the function limitations, please request a 30-day trial license for yourself.
Python: Set the Background Color and Image for Excel Worksheets
2024-03-15 08:01:56 Written by KoohjiFor data analysis and reporting, visual aesthetics play a significant role in presenting information effectively. When working with Excel worksheets, the ability to set background colors and images enhances the overall readability and impact of the data. By leveraging the power of Python, developers can effortlessly manipulate Excel files and customize the appearance of their worksheets. This article demonstrates how to use Spire.XLS for Python to set the background color and image for Excel worksheets with Python programs.
Install Spire.XLS for Python
This scenario requires Spire.XLS for Python and plum-dispatch v1.7.4. They can be easily installed in your Windows through the following pip command.
pip install Spire.XLS
If you are unsure how to install, please refer to: How to Install Spire.XLS for Python on Windows
Set the Background Color for an Excel Worksheet
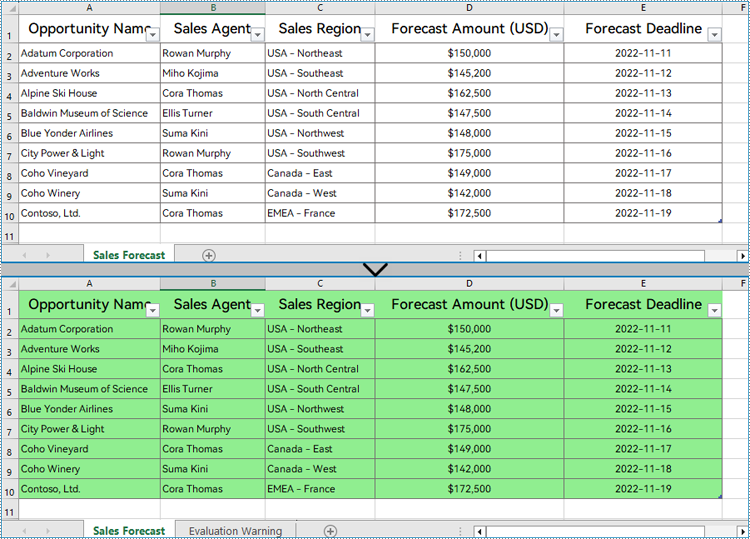
With Spire.XLS for Python, developers can set the background color for a specified cell range through CellRange.Style.Color property. The detailed steps for setting the background color for the used cell range in a worksheet are as follows:
- Create an instance of Workbook class.
- Load an Excel workbook using Workbook.LoadFromFile() method.
- Get a worksheet using Workbook.Worksheets.get_Item() method.
- Get the used range in the worksheet through Worksheet.AllocatedRange property.
- Set the background color of the used range through CellRange.Style.Color property.
- Save the workbook using Workbook.SaveToFile() method.
- Python
from spire.xls import *
from spire.xls.common import *

# Create an instance of Workbook class
wb = Workbook()

# Load an Excel file
wb.LoadFromFile("Sample.xlsx")

# Get a worksheet
sheet = wb.Worksheets.get_Item(0)

# Get the used range of the worksheet
usedRange = sheet.AllocatedRange

# Set the background color of the used range to a light and soft color
usedRange.Style.Color = Color.FromRgb(144, 238, 144)

# Save the workbook
wb.SaveToFile("output/ExcelBackgroundColor.xlsx", FileFormat.Version2016)
wb.Dispose()
Set the Background Image for an Excel Worksheet
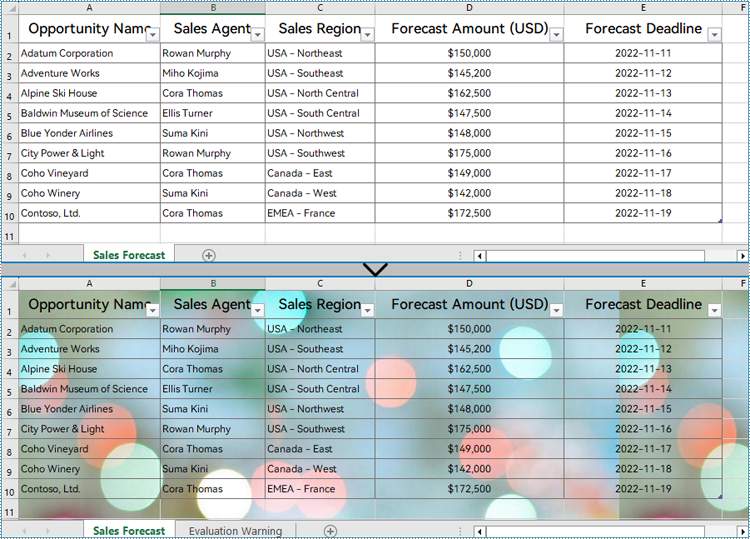
Setting a background image for an Excel worksheet can be accomplished through PageSetup class. Using the Worksheet.PageSetup.BackgroundImage property, developers can set the image background for the entire worksheet. Detailed steps are as follows:
- Create an instance of Workbook class.
- Load an Excel workbook using Workbook.LoadFromFile() method.
- Get a worksheet using Workbook.Worksheets.get_Item() method.
- Load an image using Stream() method.
- Set the background image of the worksheet through Worksheet.PageSetup.BackgroundImage property.
- Save the workbook using Workbook.SaveToFile() method.
- Python
from spire.xls import *
from spire.xls.common import *

# Create an instance of Workbook class
wb = Workbook()

# Load an Excel file
wb.LoadFromFile("Sample.xlsx")

# Get a worksheet
sheet = wb.Worksheets.get_Item(0)

# Load an image
image = Stream("BackgroundImage.jpg")

# Set the background of the worksheet
sheet.PageSetup.BackgoundImage = image

# Save the workbook
wb.SaveToFile("output/ExcelBackgroundImage.xlsx", FileFormat.Version2016)
wb.Dispose()
Apply for a Temporary License
If you'd like to remove the evaluation message from the generated documents, or to get rid of the function limitations, please request a 30-day trial license for yourself.
Shapes are a powerful tool in Excel that enables you to transform raw data into visually appealing and informative representations. By inserting and customizing shapes, you can create clear, engaging, and visually impactful spreadsheets that effectively communicate your data and captivate your audience. In this article, we will demonstrate how to insert and remove shapes in Excel in Python using Spire.XLS for Python.
Install Spire.XLS for Python
This scenario requires Spire.XLS for Python and plum-dispatch v1.7.4. They can be easily installed in your Windows through the following pip command.
pip install Spire.XLS
If you are unsure how to install, please refer to this tutorial: How to Install Spire.XLS for Python on Windows
Insert Shapes in Excel in Python
You can add numerous types of shapes, such as lines, rectangles, triangles, and stars, to an Excel worksheet by using the Worksheet.PrstGeomShapes.AddPrstGeomShape() method provided by Spire.XLS for Python. Once added, you can customize the shapes, such as adding text to the shapes, filling the shapes with solid or gradient colors or images, and setting shadow styles for the shapes. The detailed steps are as follows.
- Create an object of the Workbook class.
- Get the first worksheet using Workbook.Worksheets[] property.
- Add a shape to the worksheet using Worksheet.PrstGeomShapes.AddPrstGeomShape() method.
- Add text to the shape using IPrstGeomShape.Text property.
- Fill the shape with a color using IPrstGeomShape.Fill.ForeColor property.
- Set the fill type of the shape as solid using IPrstGeomShape.Fill.FillType property.
- Repeat the above steps to add more shapes to the worksheet.
- Save the result file using Workbook.SaveToFile() method.
- Python
from spire.xls import *
from spire.xls.common import *

# Create a Workbook object
workbook = Workbook()
# Get the first worksheet
sheet = workbook.Worksheets[0]

# Add a triangle shape to the worksheet
triangle = sheet.PrstGeomShapes.AddPrstGeomShape(2, 2, 100, 100, PrstGeomShapeType.Triangle)
# Add text to the shape
triangle.Text = "Text"
# Fill the triangle with a solid color
triangle.Fill.ForeColor = Color.get_Yellow()
triangle.Fill.FillType = ShapeFillType.SolidColor

# Add a heart shape to the worksheet
heart = sheet.PrstGeomShapes.AddPrstGeomShape(2, 5, 100, 100, PrstGeomShapeType.Heart)
# Fill the heart with a gradient color
heart.Fill.ForeColor = Color.get_Red()
heart.Fill.FillType = ShapeFillType.Gradient

# Add an arrow shape with the default color to the worksheet
arrow = sheet.PrstGeomShapes.AddPrstGeomShape(10, 2, 100, 100, PrstGeomShapeType.CurvedRightArrow)
# Set shadow style for the arrow
arrow.Shadow.Angle = 90
arrow.Shadow.Distance = 10
arrow.Shadow.Size = 150
arrow.Shadow.Color = Color.get_Gray()
arrow.Shadow.Blur = 30
arrow.Shadow.Transparency = 1
arrow.Shadow.HasCustomStyle = True

# Add a cloud shape to the worksheet
cloud = sheet.PrstGeomShapes.AddPrstGeomShape(10, 5, 100, 100, PrstGeomShapeType.Cloud)
# Fill the cloud with a custom picture
cloud.Fill.CustomPicture(Image.FromFile("Hydrangea.jpg"), "Hydrangea.jpg")
cloud.Fill.FillType = ShapeFillType.Picture

# Save the result file
workbook.SaveToFile("InsertShapes.xlsx", ExcelVersion.Version2013)
workbook.Dispose()
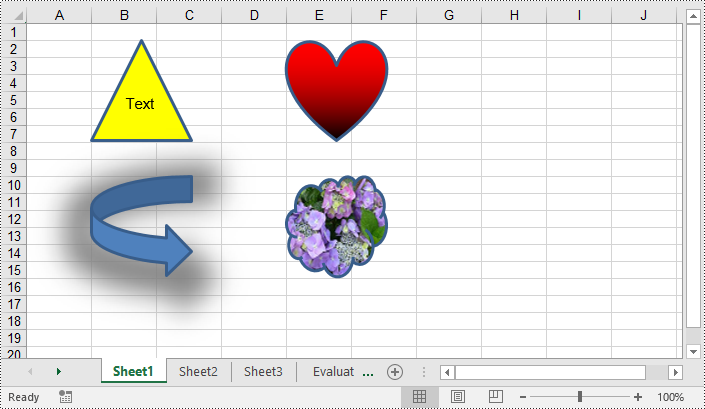
Remove Shapes from Excel in Python
Shapes can improve the visual appearance of your workbook, but they can also increase the file size of it. Removing unnecessary shapes helps reduce the file size, making it more manageable and easier to share or store. Spire.XLS for Python enables you to remove specific shapes from a worksheet effortlessly by using the Worksheet.PrstGeomShapes[index].Remove() method. The detailed steps are as follows.
- Create an object of the Workbook class.
- Load an Excel file using Workbook.LoadFromFile() method.
- Remove a specific shape from the Worksheet using Worksheet.PrstGeomShapes[index].Remove() method.
- Save the result file using Workbook.SaveToFile() method.
- Python
from spire.xls import *
from spire.xls.common import *

# Create a Workbook object
workbook = Workbook()
# Load an Excel file
workbook.LoadFromFile("InsertShapes.xlsx")

# Get the first worksheet
sheet = workbook.Worksheets[0]

# Remove the first shape from the worksheet
sheet.PrstGeomShapes[0].Remove()

#Save to file.
workbook.SaveToFile("RemoveShapes.xlsx", ExcelVersion.Version2013)
workbook.Dispose()
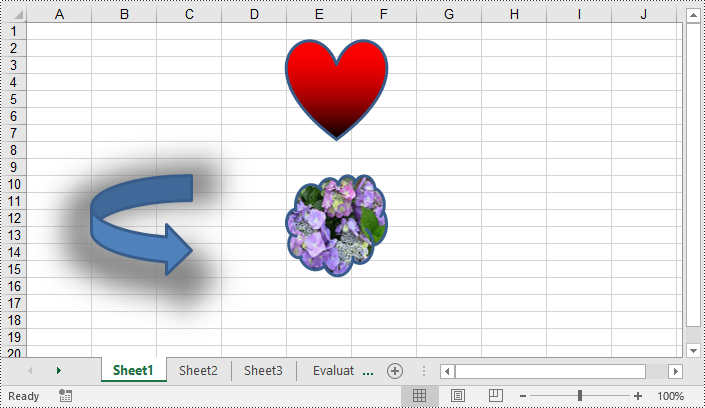
Apply for a Temporary License
If you'd like to remove the evaluation message from the generated documents, or to get rid of the function limitations, please request a 30-day trial license for yourself.
Table borders in PowerPoint refer to the visible lines or outlines that surround the cells within a table. These borders provide a visual separation between cells and help define the boundaries of the table. By setting or modifying table borders, you can customize the appearance of tables in your PowerPoint presentations. In this article, we will guide you on how to set and remove table borders in PowerPoint in Python using Spire.Presentation for Python.
Install Spire.Presentation for Python
This scenario requires Spire.Presentation for Python and plum-dispatch v1.7.4. They can be easily installed in your Windows through the following pip command.
pip install Spire.Presentation
If you are unsure how to install, please refer to this tutorial: How to Install Spire.Presentation for Python on Windows
Set Table Borders in PowerPoint in Python
Spire.Presentation for Python provides the ITable.SetTableBorder() method, which allows you to set borders for a table in PowerPoint. The detailed steps are as follows.
- Create an object of the Presentation class.
- Get the first slide of the presentation using Presentation.Slides[] property.
- Add a table to the slide using ISlide.Shapes.AppendTable() method.
- Add borders to the table and set the border type, width, and color using ITable.SetTableBorder() method.
- Save the result presentation using Presentation.SaveToFile() method.
- Python
from spire.presentation.common import *
from spire.presentation import *

# Create a Presentation object
presentation = Presentation()
# Get  the first slide of the presentation
slide = presentation.Slides[0]

# Specify the number and size of rows and columns in table
widths = [100, 100, 100, 100, 100]
heights = [20, 20]

# Add a table to the first slide
table = slide.Shapes.AppendTable(100, 100, widths, heights)

# Add borders to the table and set the border type, width, and color
table.SetTableBorder(TableBorderType.All, 1, Color.get_Blue())

# Save the result presentation
presentation.SaveToFile("SetBorders.pptx", FileFormat.Pptx2013)
presentation.Dispose()
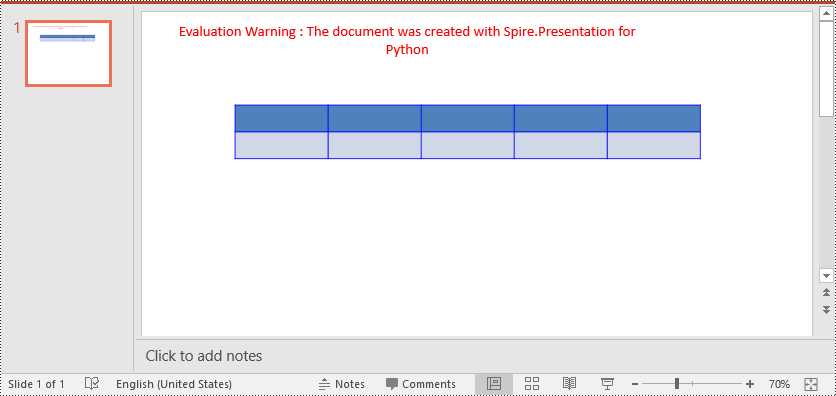
Remove Table Borders in PowerPoint in Python
To remove borders from a table, you need to iterate through the cells in the table and then remove the borders from each cell. The detailed steps are as follows.
- Create an object of the Presentation class.
- Load a PowerPoint presentation using Presentation.LoadFromFile() method.
- Get a specific slide of the presentation using Presentation.Slides[] property.
- Get the table on the slide.
- Iterate through the rows in the table and the cells in each row.
- Remove the borders from each cell by setting the fill type of the top, bottom, left and right borders of the cell as none.
- Save the result presentation using Presentation.SaveToFile() method.
- Python
from spire.presentation.common import *
from spire.presentation import *

# Create a PowerPoint presentation
presentation = Presentation()
# Load a PowerPoint presentation
presentation.LoadFromFile("SetBorders.pptx")

# Get the first slide
slide = presentation.Slides[0]
# Get the table on the slide
table = slide.Shapes[0] if isinstance(slide.Shapes[0], ITable) else None
table = (ITable)(table)

# Iterate through the rows and cells in the table
for row in table.TableRows:
    for cell in row:
        # Remove borders from each cell by setting the fill type of the top, bottom, left and right borders of the cell as none
        cell.BorderTop.FillType = FillFormatType.none
        cell.BorderBottom.FillType = FillFormatType.none
        cell.BorderLeft.FillType = FillFormatType.none
        cell.BorderRight.FillType = FillFormatType.none

# Save the result presentation
presentation.SaveToFile("RemoveBorders.pptx", FileFormat.Pptx2013)
presentation.Dispose()
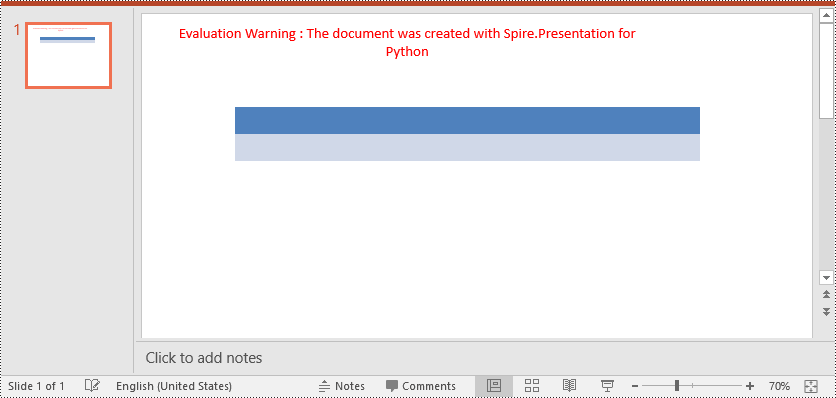
Apply for a Temporary License
If you'd like to remove the evaluation message from the generated documents, or to get rid of the function limitations, please request a 30-day trial license for yourself.
Working with multiple PowerPoint presentations at the same time can be a daunting task, often resulting in a less-than-ideal presentation experience. However, there is a solution that can streamline this process and ensure seamless transitions throughout the presentation. By combining multiple PowerPoint files into a single cohesive presentation, presenters can eliminate the need to repeatedly open different files, saving time and effort. While manually copying slides can be arduous and time-consuming, Python offers a swift and efficient solution. This article is going to show how to leverage Spire.Presentation for Python to merge PowerPoint presentations effortlessly through Python programs.
- Merging PowerPoint Presentations and Retain Their Designs
- Merging PowerPoint Presentations with Consistent Design
Install Spire.PDF for Python
This scenario requires Spire.Presentation for Python and plum-dispatch v1.7.4. They can be easily installed in your Windows through the following pip command.
pip install Spire.Presentation
If you are unsure how to install, please refer to: How to Install Spire.Presentation for Python on Windows
Merging PowerPoint Presentations and Retain Their Designs
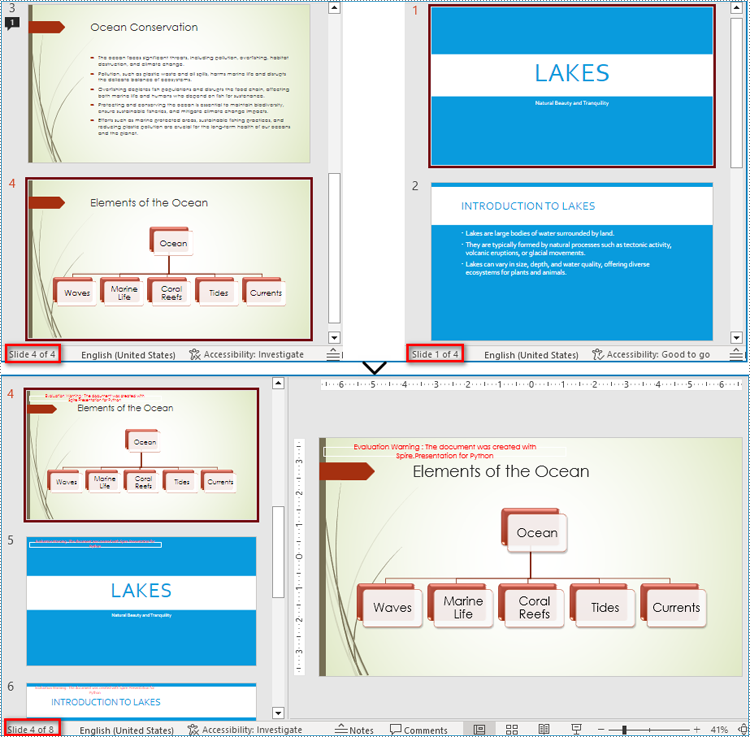
Merging PowerPoint presentations can be accomplished by reading slides from one presentation and adding them to another presentation. During the process of adding to the target presentation, developers can use Presentation.Slides.AppendBySlide(ISlide) method to add slides and retain the original design of the slides.
The detailed steps are as follows:
- Create two instances of Presentation class.
- Load two PowerPoint presentations using Presentation.LoadFromFile() method.
- Iterate through each slide in the second presentation and add them to the first presentation while keeping their design using Presentation.Slides.AppendBySlide() method.
- Save the first presentation using Presentation.SaveToFile() method.
- Python
from spire.presentation import *
from spire.presentation.common import *

# Create two instances of Presentation class
pres1 = Presentation()
pres2 = Presentation()

# Load two presentation files
pres1.LoadFromFile("Sample1.pptx")
pres2.LoadFromFile("Sample2.pptx")

# Iterate through the slides of the second presentation
for slide in pres2.Slides:
    # Add each slides to the first presentation and keep the original design
    pres1.Slides.AppendBySlide(slide)

# Save the first presentation
pres1.SaveToFile("output/MergePresentations.pptx", FileFormat.Pptx2016)
pres1.Dispose()
pres2.Dispose()
Merging PowerPoint Presentations with Consistent Design
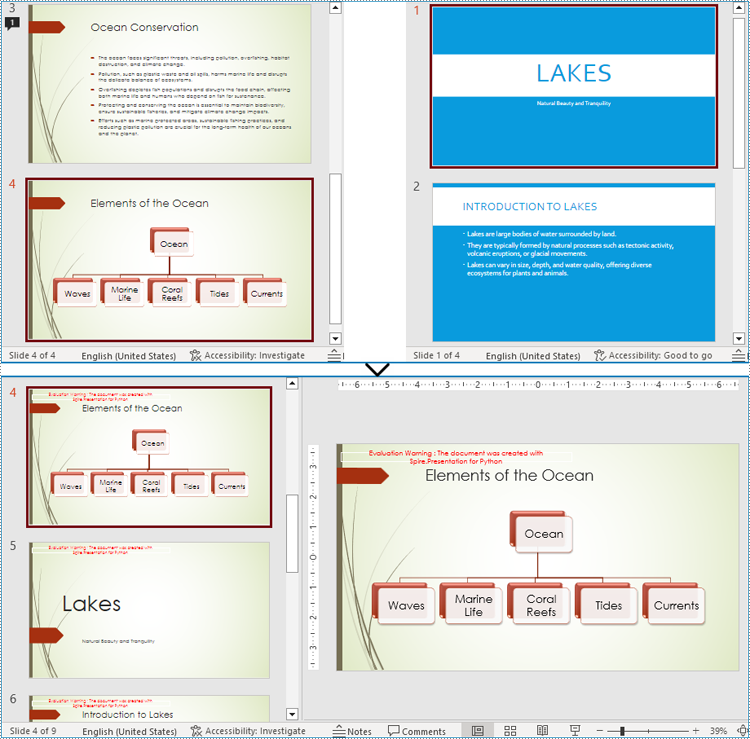
Developers can also use Presentation.Slides.AppendByMaster(slide Islide, master IMasterSlide) method to insert slides into the target presentation and change the design of the slides to the design of the target presentation. This allows for merging presentations and ensuring a consistent design.
The detailed stops are as follows:
- Create two instances of Presentation class.
- Load two PowerPoint presentations using Presentation.LoadFromFile() method.
- Iterate through each slide in the second presentation and add them to the first presentation while changing their design to the design of the first presentation using Presentation.Slides.AppendByMaster() method.
- Save the first presentation using Presentation.SaveToFile() method.
- Python
from spire.presentation import *
from spire.presentation.common import *

# Create two instances of Presentation class
pres1 = Presentation()
pres2 = Presentation()

# Load two presentation files
pres1.LoadFromFile("Sample1.pptx")
pres2.LoadFromFile("Sample2.pptx")

# Iterate through each slide in the second presentation
for slide in pres2.Slides:
    # Add each slide to the first presentation
    pres1.Slides.AppendByMaster(slide, pres1.Masters[0])

# Save the first presentation
pres1.SaveToFile("output/MergePresentationsDesign.pptx", FileFormat.Pptx2016)
pres1.Dispose()
pres2.Dispose()
Apply for a Temporary License
If you'd like to remove the evaluation message from the generated documents, or to get rid of the function limitations, please request a 30-day trial license for yourself.
Margins in a PDF document refer to the blank spaces surrounding the content on each page. They act as a buffer zone between the text or images and the edges of the page. Changing the margins of a PDF document can be a useful task when you want to adjust the layout, accommodate annotations or comments, or prepare the document for printing or presentation.
This article introduces how to modify the margins of a PDF document using the Spire.PDF for Python library. You will discover techniques to both increase and reduce the margins of your PDFs, enabling you to customize the layout according to your specific requirements.
Install Spire.PDF for Python
This scenario requires Spire.PDF for Python and plum-dispatch v1.7.4. They can be easily installed in your Windows through the following pip command.
pip install Spire.PDF
If you are unsure how to install, please refer to this tutorial: How to Install Spire.PDF for Python on Windows
Increase the Margins of a PDF Document in Python
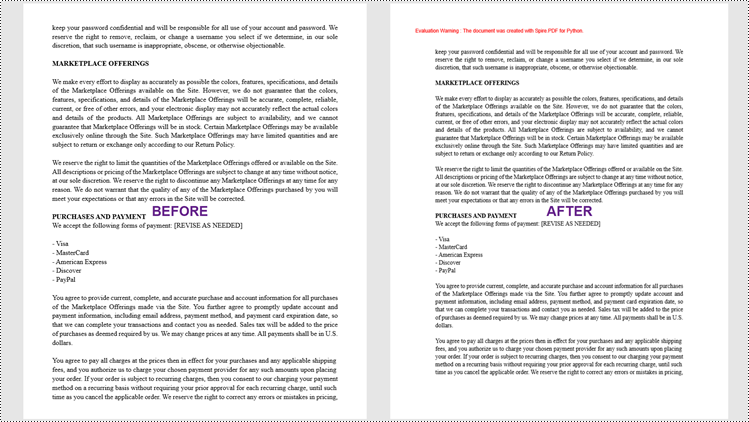
In Spire.PDF for Python, there isn't a direct method to modify the margins of an existing PDF document. However, you can increase the margins by creating a new PDF document with a page size equal to the original document's page size plus the increased margin values. Then, copy and paste (draw) each page of the original document into the appropriate place on the new document page.
The following are the steps to increase the margins of a PDF document using Python.
- Create a PdfDocument object called "originalPdf" and load the original PDF document.
- Create another PdfDocument object called "newPdf" for creating a new PDF document.
- Specify the desired increase values for the top, bottom, left, and right margins.
- Calculate the new page size by adding the margin increase values to the original page dimensions.
- Create a template based on the original PDF page using PdfPageBase.CreateTemplate() method.
- Add a new page to the "newPdf" document with the calculated page size using PdfDocument.Pages.Add() method.
- Draw the template onto the new page at the appropriate location to using PdfTemplate.Draw() method.
- Repeat steps 5-7 for each page in the original PDF document.
- Save the "newPdf" object to a PDF file.
- Python
from spire.pdf.common import *
from spire.pdf import *

# Create a PdfDocument object
originalPdf = PdfDocument()

# Load a PDF file
originalPdf.LoadFromFile("C:\\Users\\Administrator\\Desktop\\Input.pdf")

# Get the first page
"firstPage = originalPdf.Pages.get_Item(0)

# Create another PdfDocument object for creating new document
newPdf = PdfDocument()

# Set the increase values of the margins
marginsToAdd = newPdf.PageSettings.Margins
marginsToAdd.Top = 40
marginsToAdd.Bottom = 40
marginsToAdd.Left = 40
marginsToAdd.Right = 40

# Calculate the new page size
sizeF = SizeF(firstPage.Size.Width + marginsToAdd.Left + marginsToAdd.Right, firstPage.Size.Height + marginsToAdd.Top + marginsToAdd.Bottom)

# Iterate through the pages in the original document
for i in range(originalPdf.Pages.Count):

    # Create a template based on a specific page
    pdfTemplate = originalPdf.Pages.get_Item(i).CreateTemplate()"

    # Add a page to the new PDF
    page = newPdf.Pages.Add(sizeF)

    # Draw template on the page
    pdfTemplate.Draw(page, 0.0, 0.0)

# Save the new document
newPdf.SaveToFile("Output/IncreaseMargins.pdf", FileFormat.PDF)

# Dispose resources
originalPdf.Dispose()
newPdf.Dispose()
Reduce the Margins of a PDF Document in Python
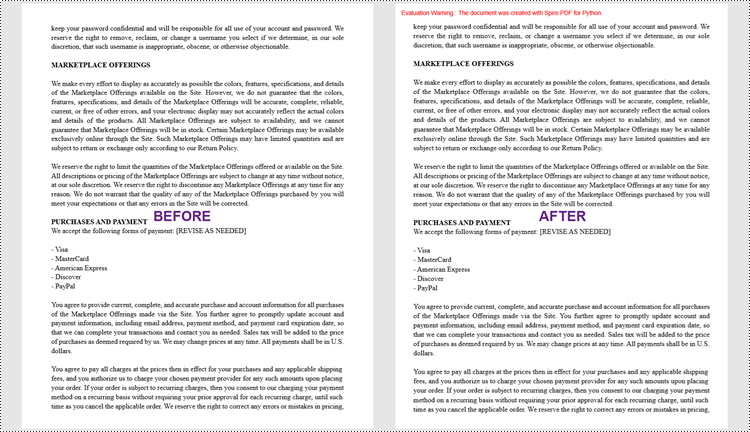
Similarly, you can reduce the margins by creating a new PDF document with a page size equal to the page size of the original document minus the margin value to be reduced. Then, copy and paste (draw) each page of the original document into the appropriate place on the new document page.
To reduce the margins of a PDF document using Python, follow these steps:
- Create a PdfDocument object called "originalPdf" and load the original PDF document.
- Create another PdfDocument object called "newPdf" for creating a new PDF document.
- Specify the desired reduction values for the top, bottom, left, and right margins.
- Calculate the new page size by subtracting the margin value to be reduced from the original page size.
- Create a template based on the original PDF page using PdfPageBase.CreateTemplate() method.
- Add a new page to the "newPdf" document with the calculated page size using PdfDocument.Pages.Add() method.
- Draw the template onto the new page at the appropriate location using PdfTemplate.Draw() method.
- Repeat steps 5-7 for each page in the original PDF document.
- Save the "newPdf" object to a PDF file.
- Python
from spire.pdf.common import *
from spire.pdf import *

# Create a PdfDocument object
originalPdf = PdfDocument()

# Load a PDF file
originalPdf.LoadFromFile(""C:\\Users\\Administrator\\Desktop\\Input.pdf"")

# Get the first page
firstPage = originalPdf.Pages.get_Item(0)

# Create another PdfDocument object
newPdf = PdfDocument()

# Set the reduction value of the margins
topToReduce = 20.0
bottomToReduce = 20.0
leftToReduce = 20.0
rightToReduce = 20.0

# Calculate the new page size
sizeF = SizeF(firstPage.Size.Width - leftToReduce - rightToReduce, firstPage.Size.Height - topToReduce - bottomToReduce)

# Iterate through the pages in the original document
for i in range(originalPdf.Pages.Count):

    # Create a template based on a specific page
    pdfTemplate = originalPdf.Pages.get_Item(i).CreateTemplate()

    # Add a page to the new PDF
    page = newPdf.Pages.Add(sizeF, PdfMargins(0.0))

    # Draw template on the page
    pdfTemplate.Draw(page, -leftToReduce, -topToReduce)

# Save the new document
newPdf.SaveToFile(""Output/ReduceMargins.pdf"", FileFormat.PDF)

# Dispose resources
originalPdf.Dispose()
newPdf.Dispose()
Apply for a Temporary License
If you'd like to remove the evaluation message from the generated documents, or to get rid of the function limitations, please request a 30-day trial license for yourself.
Paragraph spacing and line spacing are crucial formatting options in Microsoft Word that greatly influence the visual presentation and readability of your documents. Paragraph spacing determines the vertical space between paragraphs, creating a distinct separation between each paragraph. Line spacing, on the other hand, controls the vertical distance between lines within a paragraph, directly impacting the density and readability of the text. By appropriately setting paragraph spacing and line spacing, you can easily create visually appealing and easy-to-read documents. In this article, we will explain how to set paragraph spacing and line spacing in Word documents in Python using Spire.Doc for Python.
Install Spire.Doc for Python
This scenario requires Spire.Doc for Python and plum-dispatch v1.7.4. They can be easily installed in your Windows through the following pip commands.
pip install Spire.Doc
If you are unsure how to install, please refer to this tutorial: How to Install Spire.Doc for Python on Windows
Set Paragraph Spacing in Word in Python
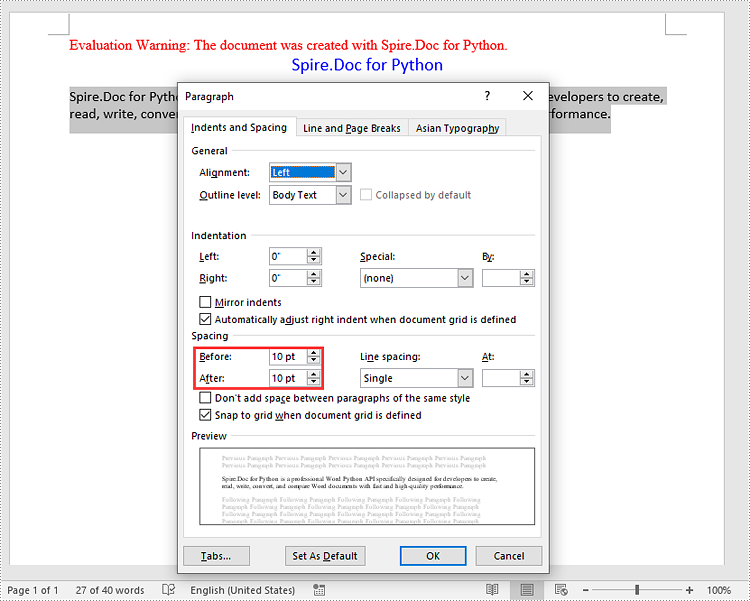
Spire.Doc for Python provides the Paragraph.Format.BeforeSpacing and Paragraph.Format.AfterSpacing properties to adjust the spacing before and after a paragraph. The detailed steps are as follows.
- Create an object of the Document class.
- Add a section to the document using Document.AddSection() method.
- Add two paragraphs to the section using Section.AddParagraph() methods.
- Set the spacing before and after the paragraphs using Paragraph.Format.BeforeSpacing and Paragraph.Format.AfterSpacing properties.
- Save the result document using Document.SaveToFile() method.
- Python
from spire.doc import *
from spire.doc.common import *

# Create an object of the Document class
document = Document()
# Add a section to the document
section = document.AddSection()

# Add two paragraphs to the section
para1 = section.AddParagraph()
para1.Format.HorizontalAlignment = HorizontalAlignment.Center
textRange1 = para1.AppendText("Spire.Doc for Python")
textRange1.CharacterFormat.TextColor = Color.get_Blue()
textRange1.CharacterFormat.FontName = "Calibri"
textRange1.CharacterFormat.FontSize = 15

para2 = section.AddParagraph()
textRange2 = para2.AppendText("Spire.Doc for Python is a professional Word Python API specifically designed for developers to create, read, write, convert, and compare Word documents with fast and high-quality performance.")
textRange2.CharacterFormat.FontName = "Calibri"
textRange2.CharacterFormat.FontSize = 12

# Set the spacing after the first paragraph
para1.Format.AfterAutoSpacing = False
para1.Format.AfterSpacing = 10

# Set the spacing before and after the second paragraph
para2.Format.BeforeAutoSpacing = False
para2.Format.BeforeSpacing = 10
para2.Format.AfterAutoSpacing = False
para2.Format.AfterSpacing = 10

# Save the result file
document.SaveToFile("SetParagraphSpacing.docx", FileFormat.Docx2013)
document.Close()
Set Line Spacing in Word in Python
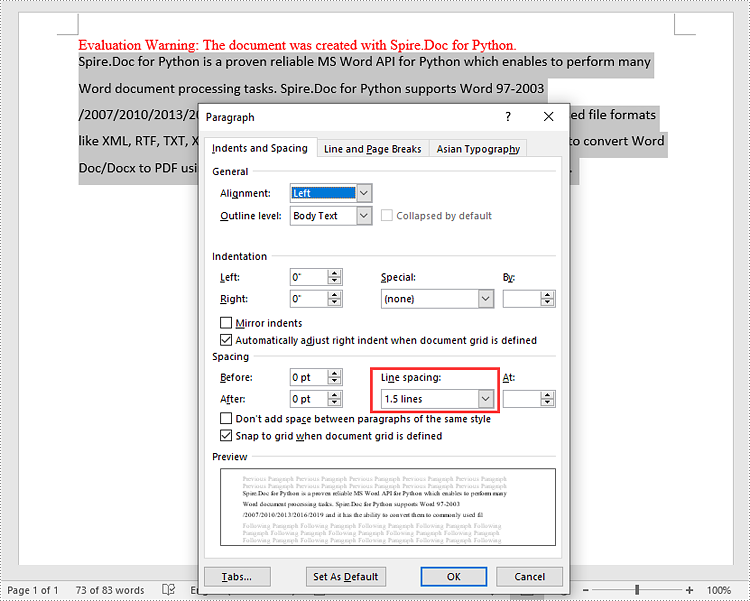
To set the pacing between lines in a paragraph, you can use the Paragraph.Format.LineSpacing property. The detailed steps are as follows.
- Create an object of the Document class.
- Add a section to the document using Document.AddSection() method.
- Add a paragraph to the section using Section.AddParagraph() methods.
- Set the spacing between lines in the paragraph using Paragraph.Format.LineSpacing property.
- Save the result document using Document.SaveToFile() method.
- Python
from spire.doc import *
from spire.doc.common import *

# Create an object of the Document class
document = Document()
# Add a section
section = document.AddSection()

# Add a paragraph to the section
para = section.AddParagraph()
textRange = para.AppendText("Spire.Doc for Python is a proven reliable MS Word API for Python which enables to perform many Word document processing tasks. Spire.Doc for Python supports Word 97-2003 /2007/2010/2013/2016/2019 and it has the ability to convert them to commonly used file formats like XML, RTF, TXT, XPS, EPUB, EMF, HTML and vice versa. Furthermore, it supports to convert Word Doc/Docx to PDF using Python, Word to SVG, and Word to PostScript in high quality.")
textRange.CharacterFormat.FontName = "Calibri"
textRange.CharacterFormat.FontSize = 12

# Set line spacing rule
para.Format.LineSpacingRule = LineSpacingRule.Multiple
# Set line spacing value (The line spacing rule "Multiple" with value 18 sets the line spacing to "1.5 lines", value 12 sets the line spacing to "Single")
para.Format.LineSpacing = 18

# Save the result file
document.SaveToFile("SetLineSpacing.docx", FileFormat.Docx2013)
document.Close()
Apply for a Temporary License
If you'd like to remove the evaluation message from the generated documents, or to get rid of the function limitations, please request a 30-day trial license for yourself.
