Wie man Seiten aus einem PDF ohne Acrobat löscht (Kostenlose Methoden)
Inhaltsverzeichnis
Mit Pypi installieren
pip install spire.pdf
Verwandte Links
Adobe Acrobat ist ein leistungsstarkes Werkzeug zur Verwaltung von PDF-Dateien, hat aber seinen Preis. Viele Benutzer suchen nach kostenlosen Alternativen, wenn sie nur einfache Aufgaben wie das Löschen einiger Seiten durchführen müssen. Glücklicherweise gibt es mehrere Möglichkeiten, Seiten aus einer PDF-Datei ohne Acrobat zu löschen, einschließlich Online-Tools, Desktop-Anwendungen und automatisierter Skripte.
In diesem Leitfaden lernen Sie mehrere einfache und sichere Methoden zum Entfernen unerwünschter PDF-Seiten kennen – und am Ende zeigen wir Ihnen, wie Sie den Prozess mit Python für maximale Effizienz automatisieren können.
Überblick
- Warum Seiten aus einer PDF-Datei ohne Acrobat löschen
- Methode 1: PDF-Seiten online löschen (kostenlose Tools)
- Methode 2: Kostenlose Desktop-PDF-Editoren verwenden
- Methode 3: Seiten aus PDF automatisch mit Python löschen
- Vergleich aller Methoden
- Tipps zur effizienten Verwaltung von PDF-Dateien
Warum Seiten aus einer PDF-Datei ohne Acrobat löschen
Das Löschen von Seiten aus PDFs ist eine häufige Anforderung, wenn Sie:
- Leere Seiten entfernen oder doppelte Seiten aus gescannten PDF-Dokumenten.
- Vertrauliche oder veraltete Inhalte vor der Weitergabe ausschließen.
- Berichte oder Präsentationen vereinfachen, indem nur relevante Seiten beibehalten werden.
Obwohl Adobe Acrobat all dies kann, erfordert es ein kostenpflichtiges Abonnement, was für Benutzer, die nur gelegentliche Bearbeitungen benötigen, nicht ideal ist. Deshalb suchen viele Menschen nach Möglichkeiten, Seiten aus einer PDF-Datei ohne Acrobat zu löschen – um kostenlose, einfache und zuverlässige Alternativen zu finden.
Methode 1: PDF-Seiten online löschen (kostenlose Tools)
Wenn Sie nur gelegentlich Seiten löschen müssen, sind Online-PDF-Editoren die einfachste Wahl. Websites wie Smallpdf, Canva und PDF24 Tools ermöglichen es Ihnen, PDF-Seiten direkt in Ihrem Browser zu löschen – keine Installation erforderlich.
Schritte zum Online-Löschen von Seiten aus einer PDF-Datei ohne Acrobat
- Besuchen Sie einen Online-PDF-Editor. Wir nehmen PDF24 Tools als Beispiel.
- Klicken Sie auf Datei auswählen oder ziehen Sie Ihre PDF-Datei per Drag & Drop, um sie hochzuladen.
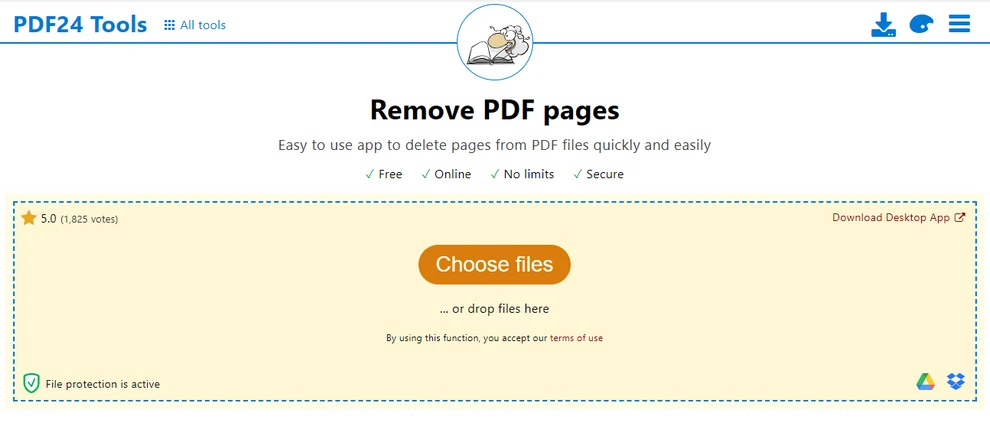
- Wählen Sie die Seiten aus, die Sie entfernen möchten, und klicken Sie auf das Papierkorb-Symbol, um sie zu löschen.

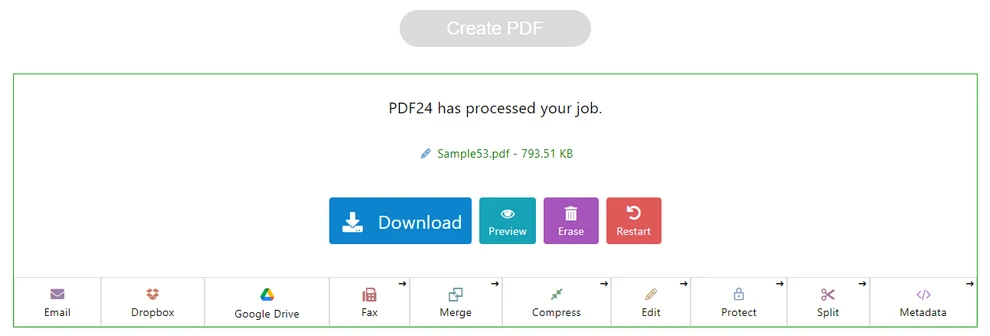
- Klicken Sie auf die Schaltfläche PDF erstellen, um die bearbeitete PDF-Datei zu generieren.
- Laden Sie die bearbeitete PDF-Datei herunter, indem Sie auf die Schaltfläche Herunterladen klicken.
Vorteile:
- Kostenlos und praktisch für den schnellen Gebrauch.
- Funktioniert auf jedem Gerät mit Internetverbindung.
Nachteile:
- Das Hochladen von Dateien kann Datenschutzrisiken bergen.
- Eingeschränkte Funktionalität für große oder vertrauliche Dokumente.
Tipp: Die Suche nach Phrasen wie „Seiten aus PDF ohne Acrobat online löschen“ kann Ihnen helfen, zuverlässige und kostenlose Tools zu finden. Dies ist der einfachste Weg für Gelegenheitsnutzer, eine Seite aus einer PDF-Datei ohne Acrobat zu löschen.
Methode 2: Kostenlose Desktop-PDF-Editoren verwenden
Wenn Sie lieber offline arbeiten oder sensible Dokumente sicher handhaben müssen, ist Desktop-Software eine bessere Option, um PDF-Seiten ohne Acrobat zu löschen.
Beliebte kostenlose Tools
- PDF24 Creator: Ein kostenloser Desktop-PDF-Editor für Windows, mit dem Sie PDF-Dateien mit einer benutzerfreundlichen Oberfläche löschen, zusammenführen, teilen, komprimieren und konvertieren können.
- PDFgear: Ein moderner PDF-Editor für Windows und Mac, der das Löschen von Seiten, Bearbeiten, Zusammenführen und Teilen von PDFs unterstützt, ideal für häufige PDF-Aufgaben.
Sie können diese Tools von ihren offiziellen Websites herunterladen und installieren oder sie über den Microsoft Store oder den Apple App Store installieren.
Allgemeine Schritte
- Öffnen Sie die PDF-Datei in Ihrem gewählten Desktop-Editor.
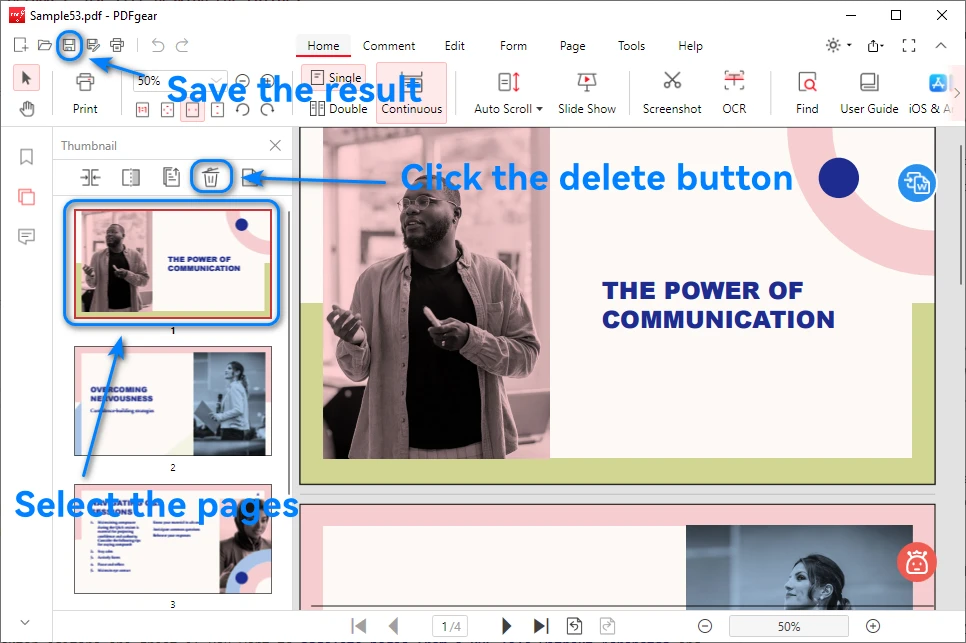
- Wählen Sie die Seiten im Seiten-Miniaturansichtsfenster aus und klicken Sie auf die Löschen-Schaltfläche.
- Speichern oder exportieren Sie die neue Datei.
Unten sehen Sie ein Bild, das zeigt, wie man Seiten aus einer PDF-Datei in PDFgear löscht:
Vorteile:
- Funktioniert offline – keine Daten werden online hochgeladen.
- Sicherer für vertrauliche oder private Dateien.
Nachteile:
- Einige Benutzeroberflächen sind möglicherweise weniger intuitiv.
- Die Stapelverarbeitung beim Löschen wird möglicherweise nicht unterstützt.
Desktop-Editoren sind großartig, wenn Sie Seiten aus einer PDF-Datei ohne Acrobat löschen und dabei die volle Kontrolle über Ihre Dokumente behalten möchten.
Methode 3: Seiten aus PDF automatisch mit Python löschen
Für Benutzer, die mehrere PDFs bearbeiten oder sich wiederholende Bearbeitungsaufgaben durchführen, bietet die Automatisierung mit Python die effizienteste und skalierbarste Lösung.
Warum Python für die PDF-Bearbeitung verwenden
Python wird häufig für die Dokumentenautomatisierung verwendet. Es ermöglicht Ihnen, PDF-Seiten automatisch zu löschen, zusammenzuführen und neu anzuordnen – ideal für umfangreiche oder sich wiederholende Arbeitsabläufe.
Wenn Sie Hunderte von PDFs verarbeiten müssen – wie Berichte, Rechnungen oder gescannte Dokumente – wird das manuelle Löschen schnell ineffizient. Mit Python können Sie diese Aufgaben programmatisch automatisieren.
Eine dedizierte Bibliothek wie Free Spire.PDF for Python bietet eine leistungsstarke und entwicklerfreundliche API zur effizienten Handhabung der Erstellung, Bearbeitung und Löschung von PDF-Seiten.
Beispiel: Seiten aus einer PDF-Datei mit Spire.PDF for Python löschen
Hier ist ein einfaches Beispiel, das zeigt, wie man Seiten aus einer PDF-Datei ohne Acrobat mit Python löscht:
from spire.pdf import PdfDocument

# Load the PDF file
pdf = PdfDocument()
pdf.LoadFromFile("sample.pdf")

# Delete the second page (index starts at 0)
pdf.Pages.RemoveAt(1)

# Save the updated PDF
pdf.SaveToFile("output.pdf")
pdf.Close()
Erklärung:
- Laden Sie die Ziel-PDF-Datei mit LoadFromFile().
- Verwenden Sie RemoveAt(index), um bestimmte Seiten zu löschen.
- Speichern Sie die bearbeitete Datei mit SaveToFile().
Hier ist ein Bild, das das PDF-Dokument vor und nach dem Entfernen einer Seite mit dem obigen Python-Code zeigt:
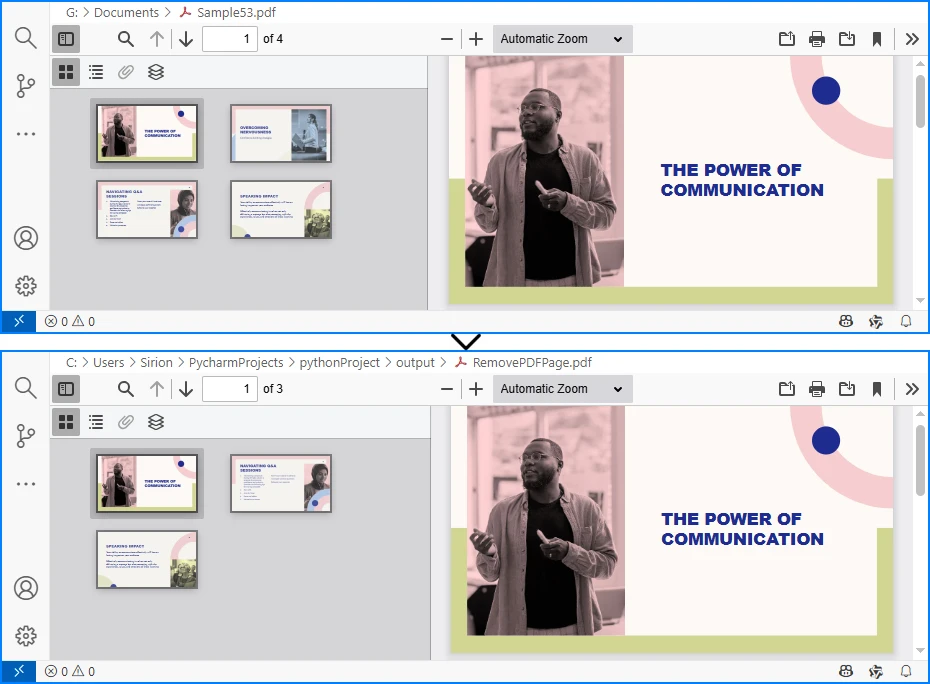
Neben dem Löschen einer einzelnen Seite unterstützt Free Spire.PDF for Python auch das Löschen eines Seitenbereichs, die Verarbeitung mehrerer Dateien in einem Stapel und die Kombination des Löschens mit Operationen wie dem Zusammenführen oder Teilen von PDFs – was es ideal für automatisierte Arbeitsabläufe oder Unternehmensanwendungen macht.
Wenn Sie weitere PDF-Verarbeitungsaufgaben mit Python automatisieren möchten, finden Sie in der Spire.PDF for Python Dokumentation weitere Python-Codebeispiele.
Vergleich aller Methoden
| Methode | Benutzerfreundlichkeit | Datenschutz | Automatisierung | Ideal für | Kosten |
|---|---|---|---|---|---|
| Online-Tools | 鈽呪槄鈽呪槄鈽?/td> | Niedrig | 鉁?/td> | Schnelle einmalige Bearbeitungen | Kostenlos |
| Kostenlose Desktop-Editoren | 鈽呪槄鈽呪槄鈽?/td> | Hoch | 鉁?/td> | Offline-Nutzung, kleine Aufgaben | Kostenlos |
| Python-Automatisierung (Spire.PDF) | 鈽呪槄鈽呪槄鈽?/td> | Hoch | 鉁?/td> | Massenverarbeitung, automatisierte Arbeitsabläufe | Kostenlos für Entwickler |
Zusammenfassung: Online-Tools sind perfekt für schnelle Bearbeitungen. Desktop-Editoren eignen sich für Benutzer, die Wert auf Datenschutz legen, während die Python-Automatisierung – insbesondere mit Spire.PDF for Python – die effizienteste Option für Entwickler ist, die eine große Anzahl von PDFs verwalten.
Tipps zur effizienten Verwaltung von PDF-Dateien
- Sichern Sie Ihre PDFs immer, bevor Sie Seiten löschen.
- Kombinieren Sie das Löschen mit anderen Aktionen wie Zusammenführen, Komprimieren oder Neuanordnen.
- Verwenden Sie Automatisierungstools, um Zeit bei der Verarbeitung großer Dateimengen zu sparen.
- Halten Sie konsistente Namenskonventionen für eine organisierte Dokumentenverwaltung ein.
Fazit
Es gibt mehrere praktische Möglichkeiten, Seiten aus einer PDF-Datei ohne Acrobat zu löschen, die von schnellen Online-Tools über kostenlose Desktop-Editoren bis hin zu automatisierten Skripten reichen. Online-Tools sind ideal für gelegentliche Bearbeitungen, Desktop-Software bietet mehr Kontrolle und Datenschutz, und die Python-Automatisierung ist die effizienteste Wahl für häufige oder umfangreiche Operationen.
Für Entwickler oder Teams, die eine große Anzahl von PDFs bearbeiten, bietet Spire.PDF for Python eine zuverlässige API zum programmgesteuerten Löschen, Zusammenführen und Verwalten von Seiten. Sie können auch die volle Funktionalität mit einer kostenlosen temporären Lizenz erkunden.
Häufig gestellte Fragen zum Löschen von Seiten aus PDF ohne Acrobat
Nachfolgend finden Sie Antworten auf häufig gestellte Fragen zum Entfernen von Seiten aus einer PDF-Datei ohne Acrobat, einschließlich kostenloser und automatisierter Methoden.
F1: Wie lösche ich unerwünschte Seiten kostenlos aus einer PDF-Datei?
Sie können Seiten kostenlos aus einer PDF-Datei löschen, indem Sie Online-Tools wie Smallpdf oder PDF24 oder kostenlose Desktop-Editoren wie PDFgear oder PDF24 Creator verwenden.
F2: Wie lösche ich eine Seite in einer PDF-Datei, die sich nicht löschen lässt?
Wenn sich eine Seite nicht löschen lässt, ist die PDF-Datei möglicherweise passwortgeschützt oder hat Bearbeitungseinschränkungen. Versuchen Sie zuerst, den Schutz zu entfernen, oder verwenden Sie eine fortschrittlichere Lösung wie Spire.PDF for Python, um geschützte Dateien programmgesteuert zu bearbeiten.
F3: Wie entferne ich Seiten aus einer PDF-Datei ohne Acrobat?
Sie können kostenlose Online-Editoren, Desktop-Tools oder die Python-Automatisierung verwenden. Mit Python und Spire.PDF for Python können Sie ganz einfach bestimmte Seitenindizes entfernen oder mehrere Seiten automatisch im Stapel löschen.
F4: Kann man in Microsoft Edge Seiten aus einer PDF-Datei löschen?
Microsoft Edge ermöglicht das Anzeigen und Kommentieren von PDFs, unterstützt jedoch nicht das Löschen von Seiten. Um Seiten zu entfernen, verwenden Sie einen dedizierten PDF-Editor oder automatisieren Sie den Prozess mit Python.
F5: Was ist der beste Weg, um Seiten aus einer PDF-Datei ohne Acrobat für die Automatisierung zu löschen?
Für umfangreiche oder sich wiederholende Aufgaben ist die Python-Automatisierung mit Spire.PDF for Python der effizienteste Weg, um PDF-Seiten ohne Acrobat zu löschen.
Siehe auch
Как удалить страницы из PDF без Acrobat (Бесплатные способы)
Содержание
Установить с помощью Pypi
pip install spire.pdf
Похожие ссылки
Adobe Acrobat — мощный инструмент для управления PDF-файлами, но он платный. Многие пользователи ищут бесплатные альтернативы, когда им нужно выполнить простые задачи, такие как удаление нескольких страниц. К счастью, существует несколько способов удалить страницы из PDF без Acrobat, включая онлайн-инструменты, настольные приложения и автоматизированные скрипты.
В этом руководстве вы узнаете несколько простых и безопасных методов для удаления ненужных страниц PDF, а в конце мы покажем, как автоматизировать этот процесс с помощью Python для максимальной эффективности.
Обзор
- Зачем удалять страницы из PDF без Acrobat
- Способ 1: Удаление страниц PDF онлайн (бесплатные инструменты)
- Способ 2: Использование бесплатных настольных редакторов PDF
- Способ 3: Автоматическое удаление страниц из PDF с помощью Python
- Сравнение всех методов
- Советы по эффективному управлению PDF-файлами
Зачем удалять страницы из PDF без Acrobat
Удаление страниц из PDF — частая необходимость, когда вы хотите:
- Удалить пустые страницы или дубликаты страниц из отсканированных PDF-документов.
- Исключить конфиденциальное или устаревшее содержимое перед отправкой.
- Упростить отчеты или презентации, оставив только релевантные страницы.
Хотя Adobe Acrobat может все это делать, он требует платной подписки, что не идеально для пользователей, которым нужны лишь редкие правки. Вот почему многие ищут, как удалить страницы из PDF без Acrobat, чтобы найти бесплатные, простые и надежные альтернативы.
Способ 1: Удаление страниц PDF онлайн (бесплатные инструменты)
Если вам нужно удалять страницы лишь изредка, онлайн-редакторы PDF — самый простой выбор. Сайты, такие как Smallpdf, Canva и PDF24 Tools, позволяют удалять страницы PDF прямо в браузере — установка не требуется.
Шаги по удалению страниц из PDF без Acrobat онлайн
- Посетите онлайн-редактор PDF. В качестве примера мы возьмем PDF24 Tools.
- Нажмите Выбрать файл или перетащите его, чтобы загрузить ваш PDF-файл.
- Выберите страницы, которые хотите удалить, и нажмите на значок корзины, чтобы их удалить.
- Нажмите кнопку Создать PDF, чтобы сгенерировать отредактированный PDF.
- Загрузите отредактированный PDF-файл, нажав кнопку Скачать.
Плюсы:
- Бесплатно и удобно для быстрого использования.
- Работает на любом устройстве с подключением к интернету.
Минусы:
- Загрузка файлов может представлять риски для конфиденциальности.
- Ограниченная функциональность для больших или конфиденциальных документов.
Совет: Поиск фраз вроде «удалить страницы из PDF без Acrobat онлайн» поможет вам найти надежные и бесплатные инструменты. Это самый простой способ удалить страницу из PDF без Acrobat для обычных пользователей.
Способ 2: Использование бесплатных настольных редакторов PDF
Если вы предпочитаете работать офлайн или вам нужно безопасно обрабатывать конфиденциальные документы, настольное программное обеспечение — лучший вариант для удаления страниц PDF без Acrobat.
Популярные бесплатные инструменты
- PDF24 Creator: Бесплатный настольный редактор PDF для Windows, который позволяет удалять, объединять, разделять, сжимать и конвертировать PDF-файлы с помощью простого в использовании интерфейса.
- PDFgear: Современный редактор PDF для Windows и Mac, который поддерживает удаление страниц, редактирование, объединение и разделение PDF, идеально подходит для частых задач с PDF.
Вы можете скачать и установить эти инструменты с их официальных сайтов или установить их через Microsoft Store или Apple App Store.
Общие шаги
- Откройте PDF в выбранном вами настольном редакторе.
- Выберите страницы в окне миниатюр страниц и нажмите кнопку удаления.
- Сохраните или экспортируйте новый файл.
Ниже приведено изображение, показывающее, как удалить страницы из PDF в PDFgear:
Плюсы:
- Работает офлайн — данные не загружаются в интернет.
- Более безопасно для конфиденциальных или личных файлов.
Минусы:
- Некоторые интерфейсы могут быть менее интуитивными.
- Пакетное удаление может не поддерживаться.
Настольные редакторы отлично подходят, если вы хотите удалить страницы из PDF-файла без Acrobat, сохраняя полный контроль над своими документами.
Способ 3: Автоматическое удаление страниц из PDF с помощью Python
Для пользователей, которые обрабатывают несколько PDF-файлов или выполняют повторяющиеся задачи редактирования, автоматизация с помощью Python предоставляет наиболее эффективное и масштабируемое решение.
Зачем использовать Python для редактирования PDF
Python широко используется для автоматизации документов. Он позволяет автоматически удалять, объединять и переупорядочивать страницы PDF — идеально для крупномасштабных или повторяющихся рабочих процессов.
Если вам нужно обработать сотни PDF-файлов — таких как отчеты, счета или отсканированные документы — ручное удаление быстро становится неэффективным. С помощью Python вы можете автоматизировать эти задачи программно.
Специализированная библиотека, такая как Free Spire.PDF for Python, предоставляет мощный и удобный для разработчиков API для эффективной обработки создания, редактирования и удаления страниц PDF.
Пример: Удаление страниц из PDF с помощью Spire.PDF for Python
Вот простой пример, показывающий, как удалить страницы из PDF без Acrobat с помощью Python:
from spire.pdf import PdfDocument

# Загрузить PDF-файл
pdf = PdfDocument()
pdf.LoadFromFile("sample.pdf")

# Удалить вторую страницу (индексация начинается с 0)
pdf.Pages.RemoveAt(1)

# Сохранить обновленный PDF
pdf.SaveToFile("output.pdf")
pdf.Close()
Объяснение:
- Загрузите целевой PDF-файл с помощью LoadFromFile().
- Используйте RemoveAt(index) для удаления определенных страниц.
- Сохраните отредактированный файл с помощью SaveToFile().
Вот изображение, показывающее PDF-документ до и после удаления страницы с использованием приведенного выше кода Python:
Помимо удаления одной страницы, Free Spire.PDF for Python также поддерживает удаление диапазона страниц, обработку нескольких файлов в пакете и объединение удаления с операциями, такими как объединение или разделение PDF, что делает его идеальным для автоматизированных рабочих процессов или корпоративных приложений.
Если вы хотите автоматизировать больше задач по обработке PDF с помощью Python, вы можете обратиться к документации Spire.PDF for Python для получения дополнительных примеров кода на Python.
Сравнение всех методов
| Метод | Простота использования | Конфиденциальность | Автоматизация | Идеально для | Стоимость |
|---|---|---|---|---|---|
| Онлайн-инструменты | 鈽呪槄鈽呪槄鈽?/td> | Низкая | 鉁?/td> | Быстрые одноразовые правки | Бесплатно |
| Бесплатные настольные редакторы | 鈽呪槄鈽呪槄鈽?/td> | Высокая | 鉁?/td> | Офлайн-использование, мелкомасштабные задачи | Бесплатно |
| Автоматизация на Python (Spire.PDF) | 鈽呪槄鈽呪槄鈽?/td> | Высокая | 鉁?/td> | Массовая обработка, автоматизированные рабочие процессы | Бесплатно для разработчиков |
Итог: Онлайн-инструменты идеально подходят для быстрых правок. Настольные редакторы подходят пользователям, которые ценят конфиденциальность, в то время как автоматизация на Python — особенно с Spire.PDF for Python — является наиболее эффективным вариантом для разработчиков, управляющих большим количеством PDF-файлов.
Советы по эффективному управлению PDF-файлами
- Всегда делайте резервные копии ваших PDF-файлов перед удалением страниц.
- Совмещайте удаление с другими действиями, такими как объединение, сжатие или переупорядочивание.
- Используйте инструменты автоматизации для экономии времени при обработке больших партий файлов.
- Придерживайтесь последовательных соглашений об именовании для организованного управления документами.
Заключение
Существует несколько практических способов удалить страницы из PDF без Acrobat, от быстрых онлайн-инструментов до бесплатных настольных редакторов и автоматизированных скриптов. Онлайн-инструменты идеально подходят для редких правок, настольное программное обеспечение обеспечивает больший контроль и конфиденциальность, а автоматизация на Python является наиболее эффективным выбором для частых или массовых операций.
Для разработчиков или команд, которые обрабатывают большое количество PDF-файлов, Spire.PDF for Python предоставляет надежный API для программного удаления, объединения и управления страницами. Вы также можете изучить его полную функциональность с помощью бесплатной временной лицензии.
Часто задаваемые вопросы об удалении страниц из PDF без Acrobat
Ниже приведены ответы на распространенные вопросы об удалении страниц из PDF без Acrobat, включая бесплатные и автоматизированные методы.
В1: Как бесплатно удалить ненужные страницы из PDF?
Вы можете бесплатно удалить страницы из PDF с помощью онлайн-инструментов, таких как Smallpdf или PDF24, или через бесплатные настольные редакторы, такие как PDFgear или PDF24 Creator.
В2: Как удалить страницу в PDF, которая не удаляется?
Если страница не удаляется, PDF может быть защищен паролем или иметь ограничения на редактирование. Попробуйте сначала снять защиту или используйте более продвинутое решение, такое как Spire.PDF for Python, для программной обработки защищенных файлов.
В3: Как извлечь страницы из PDF без Acrobat?
Вы можете использовать бесплатные онлайн-редакторы, настольные инструменты или автоматизацию на Python. С помощью Python и Spire.PDF for Python вы можете легко удалить определенные страницы по индексу или автоматически удалить несколько страниц в пакетном режиме.
В4: Можно ли удалить страницы из PDF в Microsoft Edge?
Microsoft Edge позволяет просматривать и комментировать PDF, но не поддерживает удаление страниц. Чтобы удалить страницы, используйте специальный редактор PDF или автоматизируйте процесс с помощью Python.
В5: Какой лучший способ удалить страницы из PDF-файла без Acrobat для автоматизации?
Для крупномасштабных или повторяющихся задач автоматизация на Python с помощью Spire.PDF for Python является наиболее эффективным способом удаления страниц PDF без Acrobat.
Смотрите также
How to Delete Pages from PDF without Acrobat (Free Methods)
Table of Contents
Install with Pypi
pip install spire.pdf
Related Links
Adobe Acrobat is a powerful tool for managing PDF files, but it comes with a price tag. Many users look for free alternatives when they only need to perform simple tasks such as deleting a few pages. Fortunately, there are multiple ways to delete pages from a PDF without Acrobat, including online tools, desktop applications, and automated scripts.
In this guide, you’ll learn several easy and secure methods to remove unwanted PDF pages — and by the end, we’ll show how to automate the process using Python for maximum efficiency.
Overview
- Why Delete Pages from a PDF without Acrobat
- Method 1: Delete PDF Pages Online (Free Tools)
- Method 2: Use Free Desktop PDF Editors
- Method 3: Delete Pages from PDF Automatically Using Python
- Comparison of All Methods
- Tips for Managing PDF Files Efficiently
Why Delete Pages from a PDF without Acrobat
Deleting pages from PDFs is a common need when you want to:
- Remove blank pages or duplicate pages from scanned PDF documents.
- Exclude confidential or outdated content before sharing.
- Simplify reports or presentations by keeping only relevant pages.
While Adobe Acrobat can do all of this, it requires a paid subscription, which isn’t ideal for users who only need occasional edits. That’s why many people search for how to delete pages from a PDF without Acrobat — to find free, easy, and reliable alternatives.
Method 1: Delete PDF Pages Online (Free Tools)
If you only need to delete pages occasionally, online PDF editors are the easiest choice. Websites such as Smallpdf, Canva, and PDF24 Tools allow you to delete PDF pages directly in your browser — no installation required.
Steps to Delete Pages from a PDF without Acrobat Online
- Visit an online PDF editor. We take PDF24 Tools as an example.
- Click Choose a file or drag and drop it to upload your PDF file.
- Select the pages you want to remove and click the trash icon to delete them.
- Click the Create PDF button to generate the edited PDF.
- Download the edited PDF file by clicking the Download button.
Pros:
- Free and convenient for quick use.
- Works on any device with an internet connection.
Cons:
- Uploading files may pose privacy risks.
- Limited functionality for large or confidential documents.
Tip: Searching phrases like “delete pages from a PDF without Acrobat online” can help you find reliable and free tools. This is the simplest way to delete a page from a PDF without Acrobat for casual users.
Method 2: Use Free Desktop PDF Editors
If you prefer to work offline or need to handle sensitive documents securely, desktop software is a better option to delete PDF pages without Acrobat.
Popular Free Tools
- PDF24 Creator: A free desktop PDF editor for Windows that lets you delete, merge, split, compress, and convert PDF files with an easy-to-use interface.
- PDFgear: A modern PDF editor for Windows and Mac that supports deleting pages, editing, merging, and splitting PDFs, ideal for frequent PDF tasks.
You can download and install these tools from their official websites or install them via Microsoft Store or Apple App Store.
General Steps
- Open the PDF in your chosen desktop editor.
- Select the pages in the page thumbnail window and click the delete button.
- Save or export the new file.
Below is an image showing how to delete pages from a PDF in PDFgear:
Pros:
- Works offline — no data uploaded online.
- More secure for confidential or private files.
Cons:
- Some interfaces may be less intuitive.
- Batch deletion might not be supported.
Desktop editors are great if you want to delete pages from a PDF file without Acrobat while maintaining full control over your documents.
Method 3: Delete Pages from PDF Automatically Using Python
For users who handle multiple PDFs or perform repetitive editing tasks, automation with Python provides the most efficient and scalable solution.
Why Use Python for PDF Editing
Python is widely used for document automation. It allows you to delete, merge, and rearrange PDF pages automatically — ideal for large-scale or repetitive workflows.
If you need to process hundreds of PDFs — such as reports, invoices, or scanned documents — manual deletion quickly becomes inefficient. With Python, you can automate these tasks programmatically.
A dedicated library like Free Spire.PDF for Python provides a powerful and developer-friendly API to handle PDF creation, editing, and page deletion efficiently.
Example: Delete Pages from a PDF Using Spire.PDF for Python
Here’s a simple example showing how to delete pages from a PDF without Acrobat using Python:
from spire.pdf import PdfDocument

# Load the PDF file
pdf = PdfDocument()
pdf.LoadFromFile("sample.pdf")

# Delete the second page (index starts at 0)
pdf.Pages.RemoveAt(1)

# Save the updated PDF
pdf.SaveToFile("output.pdf")
pdf.Close()
Explanation:
- Load the target PDF file using LoadFromFile().
- Use RemoveAt(index) to delete specific pages.
- Save the edited file using SaveToFile().
Here's an image showing the PDF document before and after removing a page using the above Python code:
Besides deleting a single page, Free Spire.PDF for Python also supports deleting a range of pages, processing multiple files in a batch, and combining deletion with operations like merging or splitting PDFs — making it ideal for automated workflows or enterprise applications.
If you want to automate more PDF processing tasks with Python, you can refer to the Spire.PDF for Python Documentation for more Python code examples.
Comparison of All Methods
| Method | Ease of Use | Privacy | Automation | Ideal For | Cost |
|---|---|---|---|---|---|
| Online Tools | ★★★★★ | Low | ✗ | Quick one-time edits | Free |
| Free Desktop Editors | ★★★★☆ | High | ✗ | Offline use, small-scale tasks | Free |
| Python Automation (Spire.PDF) | ★★★★☆ | High | ✓ | Bulk processing, automated workflows | Free for devs |
Summary: Online tools are perfect for quick edits. Desktop editors suit users who prioritize privacy, while Python automation — especially with Spire.PDF for Python — is the most efficient option for developers managing large numbers of PDFs.
Tips for Managing PDF Files Efficiently
- Always back up your PDFs before deleting pages.
- Combine deletion with other actions such as merging, compressing, or reordering.
- Use automation tools to save time when processing large batches of files.
- Keep consistent naming conventions for organized document management.
Conclusion
There are several practical ways to delete pages from PDF without Acrobat, ranging from quick online tools to free desktop editors and automated scripts. Online tools are ideal for occasional edits, desktop software provides more control and privacy, and Python automation is the most efficient choice for frequent or bulk operations.
For developers or teams who handle a large number of PDFs, Spire.PDF for Python provides a reliable API to delete, merge, and manage pages programmatically. You can also explore its full functionality with a free temporary license.
FAQs About Deleting Pages from PDF without Acrobat
Below are answers to common questions about removing pages from a PDF without Acrobat, including free and automated methods.
Q1: How do I delete unwanted pages from a PDF for free?
You can delete pages from a PDF for free using online tools like Smallpdf or PDF24, or through free desktop editors such as PDFgear or PDF24 Creator.
Q2: How do I delete a page in a PDF that won't delete?
If a page won’t delete, the PDF may be password-protected or have editing restrictions. Try removing the protection first, or use a more advanced solution like Spire.PDF for Python to handle protected files programmatically.
Q3: How do I take pages out of a PDF without Acrobat?
You can use free online editors, desktop tools, or Python automation. With Python and Spire.PDF for Python, you can easily remove specific page indices or batch-delete multiple pages automatically.
Q4: Can you delete pages from a PDF in Microsoft Edge?
Microsoft Edge lets you view and annotate PDFs but doesn’t support deleting pages. To remove pages, use a dedicated PDF editor or automate the process with Python.
Q5: What’s the best way to delete pages from a PDF file without Acrobat for automation?
For large-scale or repeated tasks, Python automation with Spire.PDF for Python is the most efficient way to delete PDF pages without Acrobat.
See Also
Come creare un grafico a torta in PowerPoint passo dopo passo
Indice
Installa con Pypi
pip install spire.presentation
Link Correlati

Rendere i tuoi dati facili da capire può essere complicato, specialmente se non sei sicuro di come trasformare i numeri in elementi visivi. Se hai mai aperto PowerPoint e ti sei chiesto come creare rapidamente un grafico, sei nel posto giusto. In questa guida, imparerai come creare un grafico a torta in PowerPoint, passo dopo passo. Tratteremo tutto, dall'aggiunta di un grafico alla personalizzazione di colori ed etichette, in modo che le tue diapositive appaiano chiare e professionali. Alla fine, sarai in grado di mostrare i tuoi dati in un modo semplice, attraente e facile da capire per chiunque.
- Crea Grafico a Torta Manualmente
- Crea Grafico a Torta Automaticamente
- La Conclusione
- Domande Frequenti
Come Creare un Grafico a Torta in PowerPoint Manualmente
Creare un grafico a torta in PowerPoint è più facile di quanto si possa pensare. In questo capitolo, ti guideremo passo dopo passo attraverso il processo. Innanzitutto, assicurati di avere i tuoi dati pronti insieme a una presentazione PowerPoint. Soprattutto, avrai bisogno di Microsoft PowerPoint o di un'altra app di modifica delle presentazioni installata sul tuo dispositivo. In questo tutorial, useremo Microsoft PowerPoint come esempio. Una volta che sei pronto, tuffiamoci nella guida di oggi.
Passaggio 1: Apri la Tua Presentazione
Inizia individuando e aprendo il file PowerPoint in cui desideri aggiungere il tuo grafico.
Passaggio 2: Scegli la Diapositiva
Seleziona la diapositiva in cui deve apparire il grafico a torta. Assicurati che sia pronta per i dati che vuoi mostrare.
Passaggio 3: Inserisci il Grafico
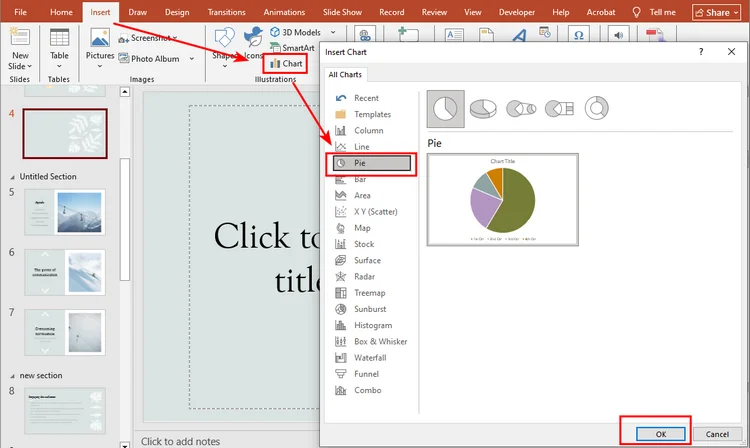
Vai alla scheda Inserisci sulla Barra multifunzione in alto e fai clic su Grafico.
Passaggio 4: Scegli il Tuo Grafico a Torta
Nella finestra di dialogo Inserisci grafico, seleziona Torta dal pannello di sinistra. Vedrai diversi tipi di grafici a torta: se vuoi creare un grafico a torta 3D sulla diapositiva, scegli la seconda opzione. Fai clic su OK per inserire il grafico.
Passaggio 5: Inserisci i Tuoi Dati
PowerPoint mostrerà dati predefiniti in un foglio simile a Excel. Sostituiscili con i tuoi numeri per soddisfare le esigenze della tua presentazione.

Passaggio 6: Personalizza il Grafico
Fai clic sul grafico e vai alla scheda Progettazione grafico sulla Barra multifunzione. Qui puoi cambiare lo stile, i colori, le etichette o persino passare a un altro tipo di grafico. Sperimenta finché non avrà l'aspetto giusto per la tua diapositiva.
Ecco l'aspetto finale del grafico a torta: 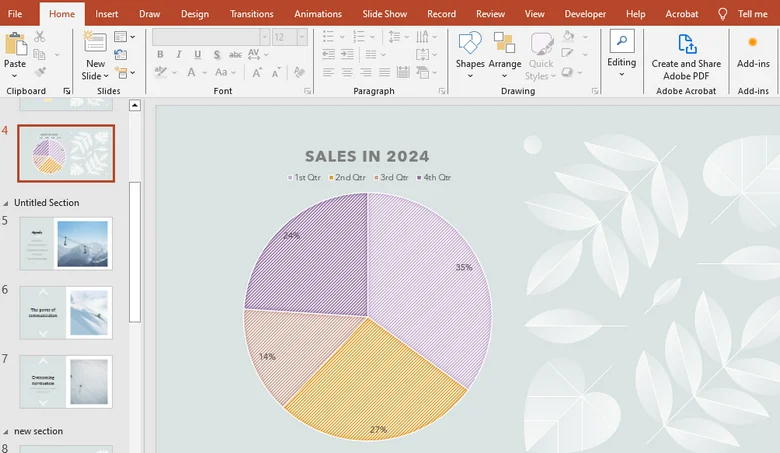
Come Creare Automaticamente un Grafico a Torta in una Presentazione PowerPoint
Dopo aver imparato come aggiungere manualmente un grafico a torta in PowerPoint, avrai probabilmente notato che i passaggi possono essere un po' noiosi, specialmente quando si aggiornano i dati o si personalizza il grafico. Quindi, c'è un modo più veloce?
L'uso del codice per generare grafici è un'ottima soluzione. Con Spire.Presentation, una libreria PowerPoint professionale, puoi creare facilmente grafici in modo automatico, gestendo tutto, dalla configurazione del file all'inserimento dei dati e alla personalizzazione del grafico, in un unico passaggio.
Ecco una guida dettagliata su come creare un grafico in PowerPoint utilizzando Spire.Presentation:
Passaggio 1: Installa Spire.Presentation
In questo tutorial, useremo Spire.Presentation for Python. Puoi installarlo tramite pip aprendo il tuo ambiente Python (ad esempio, il terminale di VSCode) ed eseguendo:
pip install spire.presentation
Premi Invio, e la libreria verrà installata.
Passaggio 2: Scrivi il Codice
Ecco la logica generale per creare un grafico a torta con Spire.Presentation:
- Importa il file �?Carica la presentazione PowerPoint con cui vuoi lavorare o crea una nuova presentazione.
- Accedi alla diapositiva di destinazione �?Seleziona la diapositiva in cui verrà inserito il grafico a torta.
- Inserisci il grafico a torta �?Aggiungi un oggetto grafico a torta alla diapositiva.
- Imposta il titolo del grafico �?Dai un titolo al tuo grafico a torta.
- Aggiungi dati al grafico �?Riempi il grafico a torta con il tuo set di dati.
- Personalizza i colori del grafico �?Regola i colori per rendere il grafico visivamente accattivante.
Di seguito è riportato il codice Python completo che mostra come creare un grafico a torta durante la creazione di una nuova presentazione PowerPoint:
from spire.presentation.common import *
from spire.presentation import *

# Create a Presentation instance
presentation = Presentation()

# Add a pie chart at a specified location on the first slide
rect = RectangleF.FromLTRB (40, 100, 590, 420)
chart = presentation.Slides[0].Shapes.AppendChartInit (ChartType.Pie, rect, False)

# Set and format chart title
chart.ChartTitle.TextProperties.Text = "Sales by Quarter (2024)"
chart.ChartTitle.TextProperties.IsCentered = True
chart.ChartTitle.Height = 30
chart.HasTitle = True

# Define some data
quarters = ["1st Qtr", "2nd Qtr", "3rd Qtr", "4th Qtr"]
sales = [210, 320, 180, 460]

# Append data to ChartData, which represents a data table where the chart data is stored
chart.ChartData[0,0].Text = "Quarters"
chart.ChartData[0,1].Text = "Sales"
i = 0
while i < len(quarters):
    chart.ChartData[i + 1,0].Text = quarters[i]
    chart.ChartData[i + 1,1].NumberValue = sales[i]
    i += 1

# Set series labels and category labels
chart.Series.SeriesLabel = chart.ChartData["B1","B1"]
chart.Categories.CategoryLabels = chart.ChartData["A2","A5"]

# Set values for series
chart.Series[0].Values = chart.ChartData["B2","B5"]

# Add data points to series
for i, unusedItem in enumerate(chart.Series[0].Values):
    cdp = ChartDataPoint(chart.Series[0])
    cdp.Index = i
    chart.Series[0].DataPoints.Add(cdp)

# Fill each data point with a different color
chart.Series[0].DataPoints[0].Fill.FillType = FillFormatType.Solid
chart.Series[0].DataPoints[0].Fill.SolidColor.Color = Color.get_Honeydew()
chart.Series[0].DataPoints[1].Fill.FillType = FillFormatType.Solid
chart.Series[0].DataPoints[1].Fill.SolidColor.Color = Color.get_LightBlue()
chart.Series[0].DataPoints[2].Fill.FillType = FillFormatType.Solid
chart.Series[0].DataPoints[2].Fill.SolidColor.Color = Color.get_LightPink()
chart.Series[0].DataPoints[3].Fill.FillType = FillFormatType.Solid
chart.Series[0].DataPoints[3].Fill.SolidColor.Color = Color.get_AliceBlue()

# Set the data labels to display label value and percentage value
chart.Series[0].DataLabels.LabelValueVisible = True
chart.Series[0].DataLabels.PercentValueVisible = True

# Save the result file
presentation.SaveToFile("E:/Administrator/Python1/output/CreatePieChart.pptx", FileFormat.Pptx2016)
presentation.Dispose()
Ecco il grafico a torta realizzato da Spire.Presentation:
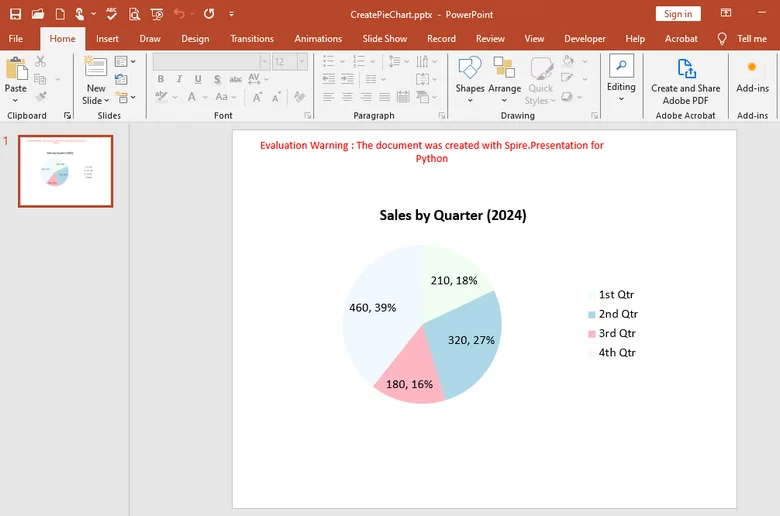
Con Spire.Presentation, puoi fare molto di più che creare semplici grafici a torta. Ti consente anche di generare grafici a colonne, grafici a linee, grafici a barre e molti altri tipi di elementi visivi direttamente nelle tue diapositive. Inoltre, la libreria supporta più linguaggi di programmazione: che tu preferisca C#, Java, Python o JavaScript, puoi creare e personalizzare facilmente grafici con poche righe di codice.
La Conclusione
In questa guida, abbiamo esaminato passo dopo passo come creare un grafico a torta in PowerPoint, dall'inserimento manuale del grafico alla personalizzazione del suo stile e dei suoi colori. Mentre il metodo manuale funziona bene per compiti semplici, Spire.Presentation funziona meglio in situazioni complicate. Con questa libreria professionale, puoi automatizzare l'intero processo, dall'aggiunta di grafici e l'inserimento di dati alla personalizzazione del loro aspetto. Provalo subito ottenendo una licenza temporanea per 30 giorni, rendendo la creazione di grafici più veloce ed efficiente che mai.
Domande Frequenti sulla Creazione di un Grafico a Torta in PowerPoint
1. Come si crea un grafico a torta passo dopo passo in PowerPoint?
Vai su Inserisci �?Grafico �?Torta, quindi sostituisci i dati di esempio con i tuoi e regola lo stile del grafico in Progettazione grafico.
2. Come posso mostrare le percentuali in un grafico a torta?
Fai clic sul grafico, seleziona Etichette dati �?Altre opzioni e seleziona Percentuale per visualizzare i valori come percentuali.
3. Come si crea un grafico a torta di avanzamento in PowerPoint?
Usa un grafico a Torta o ad Anello con due valori �?avanzamento e rimanente �?e formatta le fette con colori diversi.
4. Posso automatizzare la creazione di grafici a torta?
Sì. Puoi usare Spire.Presentation per generare e modificare grafici automaticamente dopo aver ottenuto una licenza temporanea.
LEGGI ANCHE
Como criar um gráfico de pizza no PowerPoint passo a passo
Índice
Instalar com Pypi
pip install spire.presentation
Links Relacionados
Tornar seus dados fáceis de entender pode ser complicado, especialmente se você não tem certeza de como transformar números em visuais. Se você já abriu o PowerPoint e se perguntou como fazer um gráfico rapidamente, você está no lugar certo. Neste guia, você aprenderá como criar um gráfico de pizza no PowerPoint, passo a passo. Cobriremos tudo, desde adicionar um gráfico até personalizar cores e rótulos, para que seus slides pareçam claros e profissionais. Ao final, você será capaz de mostrar seus dados de uma forma simples, atraente e fácil para qualquer um entender.
- Criar Gráfico de Pizza Manualmente
- Criar Gráfico de Pizza Automaticamente
- A Conclusão
- Perguntas Frequentes
Como Criar um Gráfico de Pizza no PowerPoint Manualmente
Fazer um gráfico de pizza no PowerPoint é mais fácil do que você imagina. Neste capítulo, vamos guiá-lo passo a passo pelo processo. Primeiro, certifique-se de que seus dados estão prontos, juntamente com uma apresentação do PowerPoint. Mais importante, você precisará do Microsoft PowerPoint ou de outro aplicativo de edição de apresentações instalado em seu dispositivo. Neste tutorial, usaremos o Microsoft PowerPoint como nosso exemplo. Quando estiver pronto, vamos mergulhar no guia de hoje.
Passo 1: Abra Sua Apresentação
Comece localizando e abrindo o arquivo do PowerPoint onde você deseja adicionar seu gráfico.
Passo 2: Escolha o Slide
Selecione o slide onde o gráfico de pizza deve aparecer. Certifique-se de que ele está pronto para os dados que você deseja mostrar.
Passo 3: Inserir o Gráfico
Vá para a guia Inserir na Faixa de Opções na parte superior e clique em Gráfico.
Passo 4: Escolha Seu Gráfico de Pizza
Na caixa de diálogo Inserir Gráfico, selecione Pizza no painel esquerdo. Você verá vários tipos de gráficos de pizza �?se quiser criar um gráfico de Pizza 3D no slide, escolha a segunda opção. Clique em OK para inserir o gráfico.
Passo 5: Insira Seus Dados
O PowerPoint mostrará dados padrão em uma planilha semelhante ao Excel. Substitua-os por seus próprios números para atender às necessidades da sua apresentação.
Passo 6: Personalize o Gráfico
Clique no gráfico e vá para a guia Design do Gráfico na Faixa de Opções. Aqui, você pode alterar o estilo, cores, rótulos ou até mesmo mudar para outro tipo de gráfico. Brinque com as opções até que ele fique perfeito para o seu slide.
Aqui está a aparência final do gráfico de pizza:
Como Criar um Gráfico de Pizza em uma Apresentação do PowerPoint Automaticamente
Depois de aprender a adicionar um gráfico de pizza manualmente no PowerPoint, você provavelmente notou que os passos podem ser um pouco tediosos, especialmente ao atualizar dados ou personalizar o gráfico. Então, existe uma maneira mais rápida?
Usar código para gerar gráficos é uma ótima solução. Com o Spire.Presentation, uma biblioteca profissional para PowerPoint, você pode criar gráficos facilmente de forma automática, cuidando de tudo, desde a configuração do arquivo até a entrada de dados e a personalização do gráfico, de uma só vez.
Aqui está um guia detalhado sobre como criar um gráfico no PowerPoint usando o Spire.Presentation:
Passo 1: Instale o Spire.Presentation
Neste tutorial, usaremos o Spire.Presentation for Python. Você pode instalá-lo via pip abrindo seu ambiente Python (por exemplo, o terminal do VSCode) e executando:
pip install spire.presentation
Pressione Enter, e a biblioteca será instalada.
Passo 2: Escreva o Código
Aqui está a lógica geral para criar um gráfico de pizza com o Spire.Presentation:
- Importar o arquivo �?Carregue a apresentação do PowerPoint com a qual você deseja trabalhar ou crie uma nova apresentação.
- Acessar o slide de destino �?Selecione o slide onde o gráfico de pizza será inserido.
- Inserir o gráfico de pizza �?Adicione um objeto de gráfico de pizza ao slide.
- Definir o título do gráfico �?Dê um título ao seu gráfico de pizza.
- Adicionar dados ao gráfico �?Preencha o gráfico de pizza com seu conjunto de dados.
- Personalizar as cores do gráfico �?Ajuste as cores para tornar o gráfico visualmente atraente.
Abaixo está o código Python completo mostrando como criar um gráfico de pizza ao fazer uma nova apresentação do PowerPoint:
from spire.presentation.common import *
from spire.presentation import *

# Create a Presentation instance
presentation = Presentation()

# Add a pie chart at a specified location on the first slide
rect = RectangleF.FromLTRB (40, 100, 590, 420)
chart = presentation.Slides[0].Shapes.AppendChartInit (ChartType.Pie, rect, False)

# Set and format chart title
chart.ChartTitle.TextProperties.Text = "Sales by Quarter (2024)"
chart.ChartTitle.TextProperties.IsCentered = True
chart.ChartTitle.Height = 30
chart.HasTitle = True

# Define some data
quarters = ["1st Qtr", "2nd Qtr", "3rd Qtr", "4th Qtr"]
sales = [210, 320, 180, 460]

# Append data to ChartData, which represents a data table where the chart data is stored
chart.ChartData[0,0].Text = "Quarters"
chart.ChartData[0,1].Text = "Sales"
i = 0
while i < len(quarters):
    chart.ChartData[i + 1,0].Text = quarters[i]
    chart.ChartData[i + 1,1].NumberValue = sales[i]
    i += 1

# Set series labels and category labels
chart.Series.SeriesLabel = chart.ChartData["B1","B1"]
chart.Categories.CategoryLabels = chart.ChartData["A2","A5"]

# Set values for series
chart.Series[0].Values = chart.ChartData["B2","B5"]

# Add data points to series
for i, unusedItem in enumerate(chart.Series[0].Values):
    cdp = ChartDataPoint(chart.Series[0])
    cdp.Index = i
    chart.Series[0].DataPoints.Add(cdp)

# Fill each data point with a different color
chart.Series[0].DataPoints[0].Fill.FillType = FillFormatType.Solid
chart.Series[0].DataPoints[0].Fill.SolidColor.Color = Color.get_Honeydew()
chart.Series[0].DataPoints[1].Fill.FillType = FillFormatType.Solid
chart.Series[0].DataPoints[1].Fill.SolidColor.Color = Color.get_LightBlue()
chart.Series[0].DataPoints[2].Fill.FillType = FillFormatType.Solid
chart.Series[0].DataPoints[2].Fill.SolidColor.Color = Color.get_LightPink()
chart.Series[0].DataPoints[3].Fill.FillType = FillFormatType.Solid
chart.Series[0].DataPoints[3].Fill.SolidColor.Color = Color.get_AliceBlue()

# Set the data labels to display label value and percentage value
chart.Series[0].DataLabels.LabelValueVisible = True
chart.Series[0].DataLabels.PercentValueVisible = True

# Save the result file
presentation.SaveToFile("E:/Administrator/Python1/output/CreatePieChart.pptx", FileFormat.Pptx2016)
presentation.Dispose()
Aqui está o gráfico de pizza feito pelo Spire.Presentation:
Com o Spire.Presentation, você pode fazer muito mais do que apenas criar gráficos de pizza. Ele também permite que você gere gráficos de colunas, gráficos de linhas, gráficos de barras e muitos outros tipos de visuais diretamente em seus slides. Além disso, a biblioteca suporta várias linguagens de programação �?quer você prefira C#, Java, Python ou JavaScript, você pode criar e personalizar gráficos facilmente com apenas algumas linhas de código.
A Conclusão
Neste guia, percorremos passo a passo como criar um gráfico de pizza no PowerPoint, desde a inserção manual do gráfico até a personalização de seu estilo e cores. Embora o método manual funcione bem para tarefas simples, o Spire.Presentation funciona melhor em situações complicadas. Com esta biblioteca profissional, você pode automatizar todo o processo �?desde adicionar gráficos e inserir dados até personalizar sua aparência. Experimente imediatamente obtendo uma licença temporária por 30 dias, tornando a criação de gráficos mais rápida e eficiente do que nunca.
Perguntas Frequentes sobre a Criação de um Gráfico de Pizza no PowerPoint
1. Como crio um gráfico de pizza passo a passo no PowerPoint?
Vá para Inserir �?Gráfico �?Pizza, depois substitua os dados de exemplo pelos seus e ajuste o estilo do gráfico em Design do Gráfico.
2. Como posso mostrar porcentagens em um gráfico de pizza?
Clique no gráfico, selecione Rótulos de Dados �?Mais Opções e marque Porcentagem para exibir os valores como porcentagens.
3. Como faço um gráfico de pizza de progresso no PowerPoint?
Use um gráfico de Pizza ou Rosca com dois valores �?progresso e restante �?e formate as fatias com cores diferentes.
4. Posso automatizar a criação de gráficos de pizza?
Sim. Você pode usar o Spire.Presentation para gerar e editar gráficos automaticamente após obter uma licença temporária.
LEIA TAMBÉM
PowerPoint에서 원형 차트를 단계별로 만드는 방법
Pypi로 설치
pip install spire.presentation
관련 링크
데이터를 이해하기 쉽게 만드는 것은 까다로울 수 있으며, 특히 숫자를 시각 자료로 바꾸는 방법을 잘 모르는 경우 더욱 그렇습니다. PowerPoint를 열고 빠르게 차트를 만드는 방법을 궁금해한 적이 있다면 제대로 찾아오셨습니다. 이 가이드에서는 PowerPoint에서 원형 차트를 만드는 방법을 단계별로 배웁니다. 차트 추가부터 색상 및 레이블 사용자 지정까지 모든 것을 다루므로 슬라이드가 명확하고 전문적으로 보일 것입니다. 마지막에는 간단하고 매력적이며 누구나 이해하기 쉬운 방식으로 데이터를 표시할 수 있게 될 것입니다.
PowerPoint에서 수동으로 원형 차트를 만드는 방법
PowerPoint에서 원형 차트를 만드는 것은 생각보다 쉽습니다. 이 장에서는 그 과정을 단계별로 안내합니다. 먼저, 데이터와 함께 PowerPoint 프레젠테이션을 준비했는지 확인하세요. 가장 중요한 것은 장치에 Microsoft PowerPoint 또는 다른 프레젠테이션 편집 앱이 설치되어 있어야 한다는 것입니다. 이 튜토리얼에서는 Microsoft PowerPoint를 예로 사용하겠습니다. 준비가 되면 오늘의 가이드를 시작하겠습니다.
1단계: 프레젠테이션 열기
차트를 추가하려는 PowerPoint 파일을 찾아 엽니다.
2단계: 슬라이드 선택
원형 차트가 나타나야 할 슬라이드를 선택합니다. 표시하려는 데이터에 맞게 준비되었는지 확인하세요.
3단계: 차트 삽입
상단의 리본 메뉴에서 삽입 탭으로 이동하여 차트를 클릭합니다.
4단계: 원형 차트 선택
차트 삽입 대화 상자의 왼쪽 패널에서 원형을 선택합니다. 여러 유형의 원형 차트가 표시됩니다. 슬라이드에 3D 원형 차트를 만들려면 두 번째 옵션을 선택하세요. 확인을 클릭하여 차트를 삽입합니다.
5단계: 데이터 입력
PowerPoint는 Excel과 유사한 시트에 기본 데이터를 표시합니다. 프레젠테이션 요구 사항에 맞게 자신의 숫자로 바꾸세요.
6단계: 차트 사용자 지정
차트를 클릭하고 리본의 차트 디자인 탭으로 이동합니다. 여기에서 스타일, 색상, 레이블을 변경하거나 다른 차트 유형으로 전환할 수도 있습니다. 슬라이드에 딱 맞게 보일 때까지 여러 가지를 시도해 보세요.
다음은 원형 차트의 최종 모습입니다:
PowerPoint 프레젠테이션에서 자동으로 원형 차트를 만드는 방법
PowerPoint에서 수동으로 원형 차트를 추가하는 방법을 배운 후, 특히 데이터를 업데이트하거나 차트를 사용자 지정할 때 단계가 약간 지루할 수 있다는 것을 눈치채셨을 것입니다. 그렇다면 더 빠른 방법이 있을까요?
코드를 사용하여 차트를 생성하는 것은 훌륭한 해결책입니다. 전문적인 PowerPoint 라이브러리인 Spire.Presentation을 사용하면 파일 설정부터 데이터 입력 및 차트 사용자 지정까지 모든 것을 한 번에 처리하여 자동으로 차트를 쉽게 만들 수 있습니다.
다음은 Spire.Presentation을 사용하여 PowerPoint에서 차트를 만드는 방법에 대한 자세한 가이드입니다:
1단계: Spire.Presentation 설치
이 튜토리얼에서는 Spire.Presentation for Python을 사용합니다. Python 환경(예: VSCode 터미널)을 열고 다음을 실행하여 pip를 통해 설치할 수 있습니다.
pip install spire.presentation
Enter 키를 누르면 라이브러리가 설치됩니다.
2단계: 코드 작성
다음은 Spire.Presentation으로 원형 차트를 만들기 위한 전체적인 논리입니다:
- 파일 가져오기 – 작업하려는 PowerPoint 프레젠테이션을 로드하거나 새 프레젠테이션을 만듭니다.
- 대상 슬라이드에 액세스 – 원형 차트가 삽입될 슬라이드를 선택합니다.
- 원형 차트 삽입 – 슬라이드에 원형 차트 개체를 추가합니다.
- 차트 제목 설정 – 원형 차트에 제목을 지정합니다.
- 차트에 데이터 추가 – 데이터 세트로 원형 차트를 채웁니다.
- 차트 색상 사용자 지정 – 차트를 시각적으로 매력적으로 만들기 위해 색상을 조정합니다.
다음은 새 PowerPoint 프레젠테이션을 만들면서 원형 차트를 만드는 방법을 보여주는 전체 Python 코드입니다:
from spire.presentation.common import *
from spire.presentation import *

# Create a Presentation instance
presentation = Presentation()

# Add a pie chart at a specified location on the first slide
rect = RectangleF.FromLTRB (40, 100, 590, 420)
chart = presentation.Slides[0].Shapes.AppendChartInit (ChartType.Pie, rect, False)

# Set and format chart title
chart.ChartTitle.TextProperties.Text = "Sales by Quarter (2024)"
chart.ChartTitle.TextProperties.IsCentered = True
chart.ChartTitle.Height = 30
chart.HasTitle = True

# Define some data
quarters = ["1st Qtr", "2nd Qtr", "3rd Qtr", "4th Qtr"]
sales = [210, 320, 180, 460]

# Append data to ChartData, which represents a data table where the chart data is stored
chart.ChartData[0,0].Text = "Quarters"
chart.ChartData[0,1].Text = "Sales"
i = 0
while i < len(quarters):
    chart.ChartData[i + 1,0].Text = quarters[i]
    chart.ChartData[i + 1,1].NumberValue = sales[i]
    i += 1

# Set series labels and category labels
chart.Series.SeriesLabel = chart.ChartData["B1","B1"]
chart.Categories.CategoryLabels = chart.ChartData["A2","A5"]

# Set values for series
chart.Series[0].Values = chart.ChartData["B2","B5"]

# Add data points to series
for i, unusedItem in enumerate(chart.Series[0].Values):
    cdp = ChartDataPoint(chart.Series[0])
    cdp.Index = i
    chart.Series[0].DataPoints.Add(cdp)

# Fill each data point with a different color
chart.Series[0].DataPoints[0].Fill.FillType = FillFormatType.Solid
chart.Series[0].DataPoints[0].Fill.SolidColor.Color = Color.get_Honeydew()
chart.Series[0].DataPoints[1].Fill.FillType = FillFormatType.Solid
chart.Series[0].DataPoints[1].Fill.SolidColor.Color = Color.get_LightBlue()
chart.Series[0].DataPoints[2].Fill.FillType = FillFormatType.Solid
chart.Series[0].DataPoints[2].Fill.SolidColor.Color = Color.get_LightPink()
chart.Series[0].DataPoints[3].Fill.FillType = FillFormatType.Solid
chart.Series[0].DataPoints[3].Fill.SolidColor.Color = Color.get_AliceBlue()

# Set the data labels to display label value and percentage value
chart.Series[0].DataLabels.LabelValueVisible = True
chart.Series[0].DataLabels.PercentValueVisible = True

# Save the result file
presentation.SaveToFile("E:/Administrator/Python1/output/CreatePieChart.pptx", FileFormat.Pptx2016)
presentation.Dispose()
다음은 Spire.Presentation으로 만든 원형 차트입니다:
Spire.Presentation을 사용하면 단순히 원형 차트를 만드는 것 이상의 훨씬 더 많은 작업을 수행할 수 있습니다. 또한 슬라이드에서 직접 세로 막대형 차트, 꺾은선형 차트, 가로 막대형 차트 및 기타 여러 유형의 시각 자료를 생성할 수 있습니다. 또한 이 라이브러리는 여러 프로그래밍 언어를 지원합니다. C#, Java, Python 또는 JavaScript 중 어떤 것을 선호하든 몇 줄의 코드만으로 쉽게 차트를 만들고 사용자 지정할 수 있습니다.
결론
이 가이드에서는 차트를 수동으로 삽입하는 것부터 스타일과 색상을 사용자 지정하는 것까지 PowerPoint에서 원형 차트를 만드는 방법을 단계별로 살펴보았습니다. 수동 방법은 간단한 작업에는 잘 작동하지만 복잡한 상황에서는 Spire.Presentation이 더 잘 작동합니다. 이 전문 라이브러리를 사용하면 차트 추가 및 데이터 입력부터 모양 사용자 지정까지 전체 프로세스를 자동화할 수 있습니다. 30일 임시 라이선스를 받아 즉시 사용해 보세요. 차트 생성이 그 어느 때보다 빠르고 효율적으로 이루어집니다.
PowerPoint에서 원형 차트 만들기에 대한 자주 묻는 질문
1. PowerPoint에서 단계별로 원형 차트를 어떻게 만드나요?
삽입 → 차트 → 원형으로 이동한 다음 샘플 데이터를 자신의 데이터로 바꾸고 차트 디자인에서 차트 스타일을 조정합니다.
2. 원형 차트에 백분율을 어떻게 표시하나요?
차트를 클릭하고 데이터 레이블 → 추가 옵션을 선택한 다음 백분율을 선택하여 값을 백분율로 표시합니다.
3. PowerPoint에서 진행률 원형 차트를 어떻게 만드나요?
진행률과 나머지 두 가지 값이 있는 원형 또는 도넛형 차트를 사용하고 조각을 다른 색상으로 서식 지정합니다.
4. 원형 차트 생성을 자동화할 수 있나요?
예. 임시 라이선스를 받은 후 Spire.Presentation을 사용하여 차트를 자동으로 생성하고 편집할 수 있습니다.
함께 읽기
Comment créer un graphique en secteurs dans PowerPoint étape par étape
Table des matières
Installer avec Pypi
pip install spire.presentation
Liens connexes
Rendre vos données faciles à comprendre peut être délicat, surtout si vous ne savez pas comment transformer des chiffres en visuels. Si vous avez déjà ouvert PowerPoint en vous demandant comment créer rapidement un graphique, vous êtes au bon endroit. Dans ce guide, vous apprendrez comment créer un graphique en secteurs dans PowerPoint, étape par étape. Nous couvrirons tout, de l'ajout d'un graphique à la personnalisation des couleurs et des étiquettes, pour que vos diapositives aient l'air claires et professionnelles. À la fin, vous serez capable de présenter vos données d'une manière simple, attrayante et facile à comprendre pour tout le monde.
- Créer un graphique en secteurs manuellement
- Créer un graphique en secteurs automatiquement
- La conclusion
- FAQ
Comment créer un graphique en secteurs dans PowerPoint manuellement
Faire un graphique en secteurs dans PowerPoint est plus facile que vous ne le pensez. Dans ce chapitre, nous vous guiderons étape par étape à travers le processus. Tout d'abord, assurez-vous d'avoir vos données prêtes ainsi qu'une présentation PowerPoint. Plus important encore, vous aurez besoin de Microsoft PowerPoint ou d'une autre application d'édition de présentations installée sur votre appareil. Dans ce tutoriel, nous utiliserons Microsoft PowerPoint comme exemple. Une fois que vous êtes prêt, plongeons dans le guide d'aujourd'hui.
Étape 1 : Ouvrez votre présentation
Commencez par localiser et ouvrir le fichier PowerPoint où vous souhaitez ajouter votre graphique.
Étape 2 : Choisissez la diapositive
Sélectionnez la diapositive où le graphique en secteurs doit apparaître. Assurez-vous qu'elle est prête pour les données que vous voulez montrer.
Étape 3 : Insérez le graphique
Allez à l'onglet Insertion sur le Ruban en haut et cliquez sur Graphique.
Étape 4 : Choisissez votre graphique en secteurs
Dans la boîte de dialogue Insérer un graphique, sélectionnez Secteurs dans le panneau de gauche. Vous verrez plusieurs types de graphiques en secteurs. Si vous voulez créer un graphique en secteurs 3D sur la diapositive, choisissez la deuxième option. Cliquez sur OK pour insérer le graphique.
Étape 5 : Saisissez vos données
PowerPoint affichera des données par défaut dans une feuille de type Excel. Remplacez-les par vos propres chiffres pour correspondre aux besoins de votre présentation.
Étape 6 : Personnalisez le graphique
Cliquez sur le graphique et allez à l'onglet Création de graphique sur le Ruban. Ici, vous pouvez changer le style, les couleurs, les étiquettes, ou même passer à un autre type de graphique. Jouez avec les options jusqu'à ce qu'il ait l'air parfait pour votre diapositive.
Voici l'aspect final du graphique en secteurs :
Comment créer un graphique en secteurs dans une présentation PowerPoint automatiquement
Après avoir appris à ajouter un graphique en secteurs manuellement dans PowerPoint, vous avez probablement remarqué que les étapes peuvent être un peu fastidieuses, surtout lors de la mise à jour des données ou de la personnalisation du graphique. Alors, y a-t-il un moyen plus rapide ?
Utiliser du code pour générer des graphiques est une excellente solution. Avec Spire.Presentation, une bibliothèque PowerPoint professionnelle, vous pouvez facilement créer des graphiques automatiquement, gérant tout, de la configuration du fichier à la saisie des données et à la personnalisation du graphique en une seule fois.
Voici un guide détaillé sur la façon de créer un graphique dans PowerPoint en utilisant Spire.Presentation :
Étape 1 : Installez Spire.Presentation
Dans ce tutoriel, nous utiliserons Spire.Presentation for Python. Vous pouvez l'installer via pip en ouvrant votre environnement Python (par exemple, le terminal de VSCode) et en exécutant :
pip install spire.presentation
Appuyez sur Entrée, et la bibliothèque sera installée.
Étape 2 : Écrivez le code
Voici la logique globale pour créer un graphique en secteurs avec Spire.Presentation :
- Importer le fichier �?Chargez la présentation PowerPoint avec laquelle vous voulez travailler ou créez une nouvelle présentation.
- Accéder à la diapositive cible �?Sélectionnez la diapositive où le graphique en secteurs sera inséré.
- Insérer le graphique en secteurs �?Ajoutez un objet graphique en secteurs à la diapositive.
- Définir le titre du graphique �?Donnez un titre à votre graphique en secteurs.
- Ajouter des données au graphique �?Remplissez le graphique en secteurs avec votre jeu de données.
- Personnaliser les couleurs du graphique �?Ajustez les couleurs pour rendre le graphique visuellement attrayant.
Ci-dessous se trouve le code Python complet montrant comment créer un graphique en secteurs tout en créant une nouvelle présentation PowerPoint :
from spire.presentation.common import *
from spire.presentation import *

# Create a Presentation instance
presentation = Presentation()

# Add a pie chart at a specified location on the first slide
rect = RectangleF.FromLTRB (40, 100, 590, 420)
chart = presentation.Slides[0].Shapes.AppendChartInit (ChartType.Pie, rect, False)

# Set and format chart title
chart.ChartTitle.TextProperties.Text = "Sales by Quarter (2024)"
chart.ChartTitle.TextProperties.IsCentered = True
chart.ChartTitle.Height = 30
chart.HasTitle = True

# Define some data
quarters = ["1st Qtr", "2nd Qtr", "3rd Qtr", "4th Qtr"]
sales = [210, 320, 180, 460]

# Append data to ChartData, which represents a data table where the chart data is stored
chart.ChartData[0,0].Text = "Quarters"
chart.ChartData[0,1].Text = "Sales"
i = 0
while i < len(quarters):
    chart.ChartData[i + 1,0].Text = quarters[i]
    chart.ChartData[i + 1,1].NumberValue = sales[i]
    i += 1

# Set series labels and category labels
chart.Series.SeriesLabel = chart.ChartData["B1","B1"]
chart.Categories.CategoryLabels = chart.ChartData["A2","A5"]

# Set values for series
chart.Series[0].Values = chart.ChartData["B2","B5"]

# Add data points to series
for i, unusedItem in enumerate(chart.Series[0].Values):
    cdp = ChartDataPoint(chart.Series[0])
    cdp.Index = i
    chart.Series[0].DataPoints.Add(cdp)

# Fill each data point with a different color
chart.Series[0].DataPoints[0].Fill.FillType = FillFormatType.Solid
chart.Series[0].DataPoints[0].Fill.SolidColor.Color = Color.get_Honeydew()
chart.Series[0].DataPoints[1].Fill.FillType = FillFormatType.Solid
chart.Series[0].DataPoints[1].Fill.SolidColor.Color = Color.get_LightBlue()
chart.Series[0].DataPoints[2].Fill.FillType = FillFormatType.Solid
chart.Series[0].DataPoints[2].Fill.SolidColor.Color = Color.get_LightPink()
chart.Series[0].DataPoints[3].Fill.FillType = FillFormatType.Solid
chart.Series[0].DataPoints[3].Fill.SolidColor.Color = Color.get_AliceBlue()

# Set the data labels to display label value and percentage value
chart.Series[0].DataLabels.LabelValueVisible = True
chart.Series[0].DataLabels.PercentValueVisible = True

# Save the result file
presentation.SaveToFile("E:/Administrator/Python1/output/CreatePieChart.pptx", FileFormat.Pptx2016)
presentation.Dispose()
Voici le graphique en secteurs créé par Spire.Presentation :
Avec Spire.Presentation, vous pouvez faire bien plus que simplement créer des graphiques en secteurs. Il vous permet également de générer des histogrammes, des graphiques linéaires, des diagrammes à barres et de nombreux autres types de visuels directement dans vos diapositives. De plus, la bibliothèque prend en charge plusieurs langages de programmation. Que vous préfériez C#, Java, Python ou JavaScript, vous pouvez facilement créer et personnaliser des graphiques avec seulement quelques lignes de code.
La conclusion
Dans ce guide, nous avons expliqué comment créer un graphique en secteurs dans PowerPoint étape par étape, de l'insertion manuelle du graphique à la personnalisation de son style et de ses couleurs. Bien que la méthode manuelle fonctionne bien pour des tâches simples, Spire.Presentation est plus efficace dans des situations complexes. Avec cette bibliothèque professionnelle, vous pouvez automatiser tout le processus, de l'ajout de graphiques et de la saisie de données à la personnalisation de leur apparence. Essayez-le immédiatement en obtenant une licence temporaire de 30 jours, rendant la création de graphiques plus rapide et plus efficace que jamais.
FAQ sur la création d'un graphique en secteurs dans PowerPoint
1. Comment créer un graphique en secteurs étape par étape dans PowerPoint ?
Allez dans Insertion �?Graphique �?Secteurs, puis remplacez les données d'exemple par les vôtres et ajustez le style du graphique sous Création de graphique.
2. Comment puis-je afficher des pourcentages dans un graphique en secteurs ?
Cliquez sur le graphique, sélectionnez Étiquettes de données �?Autres options, et cochez Pourcentage pour afficher les valeurs en pourcentages.
3. Comment faire un graphique en secteurs de progression dans PowerPoint ?
Utilisez un graphique en secteurs ou en anneau avec deux valeurs �?progression et restant �?et formatez les parts avec des couleurs différentes.
4. Puis-je automatiser la création de graphiques en secteurs ?
Oui. Vous pouvez utiliser Spire.Presentation pour générer et modifier des graphiques automatiquement après avoir obtenu une licence temporaire.
À LIRE AUSSI
- Comment créer un graphique à bulles dans PowerPoint en C#, VB.NET
- Comment supprimer un graphique d'une diapositive PowerPoint en C#, VB.NET
- Python : Créer ou modifier des tableaux dans des présentations PowerPoint
- Comment créer un graphique en utilisant des données Excel dans PowerPoint en C#, VB.NET
Cómo crear un gráfico circular en PowerPoint paso a paso
Tabla de Contenidos
Instalar con Pypi
pip install spire.presentation
Enlaces Relacionados
Hacer que tus datos sean fáciles de entender puede ser complicado, especialmente si no estás seguro de cómo convertir números en elementos visuales. Si alguna vez has abierto PowerPoint y te has preguntado cómo hacer un gráfico rápidamente, estás en el lugar correcto. En esta guía, aprenderás cómo crear un gráfico circular en PowerPoint, paso a paso. Cubriremos todo, desde agregar un gráfico hasta personalizar colores y etiquetas, para que tus diapositivas se vean claras y profesionales. Al final, podrás mostrar tus datos de una manera que sea simple, atractiva y fácil de entender para cualquiera.
- Crear Gráfico Circular Manualmente
- Crear Gráfico Circular Automáticamente
- La Conclusión
- Preguntas Frecuentes
Cómo Crear un Gráfico Circular en PowerPoint Manualmente
Hacer un gráfico circular en PowerPoint es más fácil de lo que piensas. En este capítulo, te guiaremos paso a paso a través del proceso. Primero, asegúrate de tener tus datos listos junto con una presentación de PowerPoint. Lo más importante es que necesitarás Microsoft PowerPoint u otra aplicación de edición de presentaciones instalada en tu dispositivo. En este tutorial, usaremos Microsoft PowerPoint como nuestro ejemplo. Una vez que estés listo, vamos a sumergirnos en la guía de hoy.
Paso 1: Abre Tu Presentación
Comienza por localizar y abrir el archivo de PowerPoint donde quieres agregar tu gráfico.
Paso 2: Elige la Diapositiva
Selecciona la diapositiva donde debe aparecer el gráfico circular. Asegúrate de que esté lista para los datos que quieres mostrar.
Paso 3: Inserta el Gráfico
Ve a la pestaña Insertar en la Cinta de opciones en la parte superior y haz clic en Gráfico.
Paso 4: Elige Tu Gráfico Circular
En el cuadro de diálogo Insertar Gráfico, selecciona Circular en el panel izquierdo. Verás varios tipos de gráficos circulares; si quieres crear un gráfico circular 3D en la diapositiva, elige la segunda opción. Haz clic en Aceptar para insertar el gráfico.
Paso 5: Ingresa Tus Datos
PowerPoint mostrará datos predeterminados en una hoja similar a Excel. Reemplázalos con tus propios números para que coincidan con las necesidades de tu presentación.
Paso 6: Personaliza el Gráfico
Haz clic en el gráfico y ve a la pestaña Diseño de Gráfico en la Cinta de opciones. Aquí, puedes cambiar el estilo, los colores, las etiquetas o incluso cambiar a otro tipo de gráfico. Juega con las opciones hasta que se vea perfecto para tu diapositiva.
Aquí está el aspecto final del gráfico circular:
Cómo Crear un Gráfico Circular en una Presentación de PowerPoint Automáticamente
Después de aprender a agregar un gráfico circular manualmente en PowerPoint, probablemente hayas notado que los pasos pueden ser un poco tediosos, especialmente al actualizar datos o personalizar el gráfico. Entonces, ¿hay una manera más rápida?
Usar código para generar gráficos es una gran solución. Con Spire.Presentation, una biblioteca profesional de PowerPoint, puedes crear gráficos fácilmente de forma automática, manejando todo, desde la configuración del archivo hasta la entrada de datos y la personalización del gráfico, todo de una vez.
Aquí tienes una guía detallada sobre cómo crear un gráfico en PowerPoint usando Spire.Presentation:
Paso 1: Instala Spire.Presentation
En este tutorial, usaremos Spire.Presentation for Python. Puedes instalarlo a través de pip abriendo tu entorno de Python (por ejemplo, la terminal de VSCode) y ejecutando:
pip install spire.presentation
Presiona Enter, y la biblioteca se instalará.
Paso 2: Escribe el Código
Aquí está la lógica general para crear un gráfico circular con Spire.Presentation:
- Importar el archivo �?Carga la presentación de PowerPoint con la que quieres trabajar o crea una nueva presentación.
- Acceder a la diapositiva de destino �?Selecciona la diapositiva donde se insertará el gráfico circular.
- Insertar el gráfico circular �?Agrega un objeto de gráfico circular a la diapositiva.
- Establecer el título del gráfico �?Dale un título a tu gráfico circular.
- Agregar datos al gráfico �?Rellena el gráfico circular con tu conjunto de datos.
- Personalizar los colores del gráfico �?Ajusta los colores para que el gráfico sea visualmente atractivo.
A continuación se muestra el código completo de Python que muestra cómo crear un gráfico circular al hacer una nueva presentación de PowerPoint:
from spire.presentation.common import *
from spire.presentation import *

# Create a Presentation instance
presentation = Presentation()

# Add a pie chart at a specified location on the first slide
rect = RectangleF.FromLTRB (40, 100, 590, 420)
chart = presentation.Slides[0].Shapes.AppendChartInit (ChartType.Pie, rect, False)

# Set and format chart title
chart.ChartTitle.TextProperties.Text = "Sales by Quarter (2024)"
chart.ChartTitle.TextProperties.IsCentered = True
chart.ChartTitle.Height = 30
chart.HasTitle = True

# Define some data
quarters = ["1st Qtr", "2nd Qtr", "3rd Qtr", "4th Qtr"]
sales = [210, 320, 180, 460]

# Append data to ChartData, which represents a data table where the chart data is stored
chart.ChartData[0,0].Text = "Quarters"
chart.ChartData[0,1].Text = "Sales"
i = 0
while i < len(quarters):
    chart.ChartData[i + 1,0].Text = quarters[i]
    chart.ChartData[i + 1,1].NumberValue = sales[i]
    i += 1

# Set series labels and category labels
chart.Series.SeriesLabel = chart.ChartData["B1","B1"]
chart.Categories.CategoryLabels = chart.ChartData["A2","A5"]

# Set values for series
chart.Series[0].Values = chart.ChartData["B2","B5"]

# Add data points to series
for i, unusedItem in enumerate(chart.Series[0].Values):
    cdp = ChartDataPoint(chart.Series[0])
    cdp.Index = i
    chart.Series[0].DataPoints.Add(cdp)

# Fill each data point with a different color
chart.Series[0].DataPoints[0].Fill.FillType = FillFormatType.Solid
chart.Series[0].DataPoints[0].Fill.SolidColor.Color = Color.get_Honeydew()
chart.Series[0].DataPoints[1].Fill.FillType = FillFormatType.Solid
chart.Series[0].DataPoints[1].Fill.SolidColor.Color = Color.get_LightBlue()
chart.Series[0].DataPoints[2].Fill.FillType = FillFormatType.Solid
chart.Series[0].DataPoints[2].Fill.SolidColor.Color = Color.get_LightPink()
chart.Series[0].DataPoints[3].Fill.FillType = FillFormatType.Solid
chart.Series[0].DataPoints[3].Fill.SolidColor.Color = Color.get_AliceBlue()

# Set the data labels to display label value and percentage value
chart.Series[0].DataLabels.LabelValueVisible = True
chart.Series[0].DataLabels.PercentValueVisible = True

# Save the result file
presentation.SaveToFile("E:/Administrator/Python1/output/CreatePieChart.pptx", FileFormat.Pptx2016)
presentation.Dispose()
Aquí está el gráfico circular hecho por Spire.Presentation:
Con Spire.Presentation, puedes hacer mucho más que solo crear gráficos circulares. También te permite generar gráficos de columnas, gráficos de líneas, gráficos de barras y muchos otros tipos de elementos visuales directamente en tus diapositivas. Además, la biblioteca admite múltiples lenguajes de programación; ya sea que prefieras C#, Java, Python o JavaScript, puedes crear y personalizar gráficos fácilmente con solo unas pocas líneas de código.
La Conclusión
En esta guía, hemos recorrido cómo crear un gráfico circular en PowerPoint paso a paso, desde insertar el gráfico manualmente hasta personalizar su estilo y colores. Si bien el método manual funciona bien para tareas simples, Spire.Presentation funciona mejor en situaciones complicadas. Con esta biblioteca profesional, puedes automatizar todo el proceso, desde agregar gráficos e ingresar datos hasta personalizar su apariencia. Pruébalo de inmediato obteniendo una licencia temporal por 30 días, haciendo que la creación de gráficos sea más rápida y eficiente que nunca.
Preguntas Frecuentes sobre la Creación de un Gráfico Circular en PowerPoint
1. ¿Cómo creo un gráfico circular paso a paso en PowerPoint?
Ve a Insertar �?Gráfico �?Circular, luego reemplaza los datos de muestra con los tuyos y ajusta el estilo del gráfico en Diseño de Gráfico.
2. ¿Cómo puedo mostrar porcentajes en un gráfico circular?
Haz clic en el gráfico, selecciona Etiquetas de Datos �?Más Opciones, y marca Porcentaje para mostrar los valores como porcentajes.
3. ¿Cómo hago un gráfico circular de progreso en PowerPoint?
Usa un gráfico Circular o de Anillo con dos valores: progreso y restante, y formatea las porciones con diferentes colores.
4. ¿Puedo automatizar la creación de gráficos circulares?
Sí. Puedes usar Spire.Presentation para generar y editar gráficos automáticamente después de obtener una licencia temporal.
TAMBIÉN LEA
Wie man ein Kuchendiagramm in PowerPoint Schritt für Schritt erstellt
Inhaltsverzeichnis
Mit Pypi installieren
pip install spire.presentation
Verwandte Links
Daten verständlich darzustellen, kann knifflig sein, besonders wenn Sie nicht sicher sind, wie Sie Zahlen in visuelle Darstellungen umwandeln können. Wenn Sie jemals PowerPoint geöffnet und sich gefragt haben, wie man schnell ein Diagramm erstellt, sind Sie hier genau richtig. In dieser Anleitung lernen Sie Schritt für Schritt, wie Sie ein Kreisdiagramm in PowerPoint erstellen. Wir behandeln alles, vom Hinzufügen eines Diagramms bis zur Anpassung von Farben und Beschriftungen, damit Ihre Folien klar und professionell aussehen. Am Ende werden Sie in der Lage sein, Ihre Daten auf eine Weise darzustellen, die einfach, ansprechend und für jeden leicht verständlich ist.
- Kreisdiagramm manuell erstellen
- Kreisdiagramm automatisch erstellen
- Das Fazit
- Häufig gestellte Fragen
Wie man ein Kreisdiagramm in PowerPoint manuell erstellt
Ein Kreisdiagramm in PowerPoint zu erstellen, ist einfacher, als Sie vielleicht denken. In diesem Kapitel führen wir Sie Schritt für Schritt durch den Prozess. Stellen Sie zunächst sicher, dass Sie Ihre Daten und eine PowerPoint-Präsentation bereit haben. Am wichtigsten ist, dass Sie Microsoft PowerPoint oder eine andere Präsentationsbearbeitungs-App auf Ihrem Gerät installiert haben. In diesem Tutorial verwenden wir Microsoft PowerPoint als Beispiel. Sobald Sie bereit sind, tauchen wir in die heutige Anleitung ein.
Schritt 1: Öffnen Sie Ihre Präsentation
Beginnen Sie damit, die PowerPoint-Datei zu suchen und zu öffnen, in der Sie Ihr Diagramm hinzufügen möchten.
Schritt 2: Wählen Sie die Folie
Wählen Sie die Folie aus, auf der das Kreisdiagramm erscheinen soll. Stellen Sie sicher, dass sie für die Daten, die Sie zeigen möchten, bereit ist.
Schritt 3: Fügen Sie das Diagramm ein
Gehen Sie zum Tab Einfügen im Menüband oben und klicken Sie auf Diagramm.
Schritt 4: Wählen Sie Ihr Kreisdiagramm
Im Dialogfeld Diagramm einfügen wählen Sie im linken Bereich Kreis aus. Sie sehen verschiedene Arten von Kreisdiagrammen �?wenn Sie ein 3D-Kreisdiagramm auf der Folie erstellen möchten, wählen Sie die zweite Option. Klicken Sie auf OK, um das Diagramm einzufügen.
Schritt 5: Geben Sie Ihre Daten ein
PowerPoint zeigt Standarddaten in einem Excel-ähnlichen Blatt an. Ersetzen Sie sie durch Ihre eigenen Zahlen, um sie an die Anforderungen Ihrer Präsentation anzupassen.
Schritt 6: Passen Sie das Diagramm an
Klicken Sie auf das Diagramm und gehen Sie zum Tab Diagrammentwurf im Menüband. Hier können Sie den Stil, die Farben, die Beschriftungen ändern oder sogar zu einem anderen Diagrammtyp wechseln. Probieren Sie es aus, bis es genau richtig für Ihre Folie aussieht.
Hier ist das endgültige Aussehen des Kreisdiagramms:
Wie man ein Kreisdiagramm in einer PowerPoint-Präsentation automatisch erstellt
Nachdem Sie gelernt haben, wie man ein Kreisdiagramm manuell in PowerPoint hinzufügt, haben Sie wahrscheinlich bemerkt, dass die Schritte etwas mühsam sein können, insbesondere beim Aktualisieren von Daten oder Anpassen des Diagramms. Gibt es also einen schnelleren Weg?
Die Verwendung von Code zur Erstellung von Diagrammen ist eine großartige Lösung. Mit Spire.Presentation, einer professionellen PowerPoint-Bibliothek, können Sie Diagramme einfach automatisch erstellen und alles von der Dateieinrichtung über die Dateneingabe bis hin zur Diagrammanpassung in einem Arbeitsgang erledigen.
Hier ist eine detaillierte Anleitung, wie Sie ein Diagramm in PowerPoint mit Spire.Presentation erstellen:
Schritt 1: Installieren Sie Spire.Presentation
In diesem Tutorial verwenden wir Spire.Presentation for Python. Sie können es über pip installieren, indem Sie Ihre Python-Umgebung (zum Beispiel das VSCode-Terminal) öffnen und Folgendes ausführen:
pip install spire.presentation
Drücken Sie Enter, und die Bibliothek wird installiert.
Schritt 2: Schreiben Sie den Code
Hier ist die allgemeine Logik zur Erstellung eines Kreisdiagramms mit Spire.Presentation:
- Importieren Sie die Datei �?Laden Sie die PowerPoint-Präsentation, mit der Sie arbeiten möchten, oder erstellen Sie eine neue Präsentation.
- Greifen Sie auf die Ziel-Folie zu �?Wählen Sie die Folie aus, auf der das Kreisdiagramm eingefügt werden soll.
- Fügen Sie das Kreisdiagramm ein �?Fügen Sie ein Kreisdiagramm-Objekt zur Folie hinzu.
- Legen Sie den Diagrammtitel fest �?Geben Sie Ihrem Kreisdiagramm einen Titel.
- Fügen Sie Daten zum Diagramm hinzu �?Füllen Sie das Kreisdiagramm mit Ihrem Datensatz.
- Passen Sie die Diagrammfarben an �?Passen Sie die Farben an, um das Diagramm visuell ansprechend zu gestalten.
Unten finden Sie den vollständigen Python-Code, der zeigt, wie man ein Kreisdiagramm erstellt, während man eine neue PowerPoint-Präsentation anlegt:
from spire.presentation.common import *
from spire.presentation import *

# Create a Presentation instance
presentation = Presentation()

# Add a pie chart at a specified location on the first slide
rect = RectangleF.FromLTRB (40, 100, 590, 420)
chart = presentation.Slides[0].Shapes.AppendChartInit (ChartType.Pie, rect, False)

# Set and format chart title
chart.ChartTitle.TextProperties.Text = "Sales by Quarter (2024)"
chart.ChartTitle.TextProperties.IsCentered = True
chart.ChartTitle.Height = 30
chart.HasTitle = True

# Define some data
quarters = ["1st Qtr", "2nd Qtr", "3rd Qtr", "4th Qtr"]
sales = [210, 320, 180, 460]

# Append data to ChartData, which represents a data table where the chart data is stored
chart.ChartData[0,0].Text = "Quarters"
chart.ChartData[0,1].Text = "Sales"
i = 0
while i < len(quarters):
    chart.ChartData[i + 1,0].Text = quarters[i]
    chart.ChartData[i + 1,1].NumberValue = sales[i]
    i += 1

# Set series labels and category labels
chart.Series.SeriesLabel = chart.ChartData["B1","B1"]
chart.Categories.CategoryLabels = chart.ChartData["A2","A5"]

# Set values for series
chart.Series[0].Values = chart.ChartData["B2","B5"]

# Add data points to series
for i, unusedItem in enumerate(chart.Series[0].Values):
    cdp = ChartDataPoint(chart.Series[0])
    cdp.Index = i
    chart.Series[0].DataPoints.Add(cdp)

# Fill each data point with a different color
chart.Series[0].DataPoints[0].Fill.FillType = FillFormatType.Solid
chart.Series[0].DataPoints[0].Fill.SolidColor.Color = Color.get_Honeydew()
chart.Series[0].DataPoints[1].Fill.FillType = FillFormatType.Solid
chart.Series[0].DataPoints[1].Fill.SolidColor.Color = Color.get_LightBlue()
chart.Series[0].DataPoints[2].Fill.FillType = FillFormatType.Solid
chart.Series[0].DataPoints[2].Fill.SolidColor.Color = Color.get_LightPink()
chart.Series[0].DataPoints[3].Fill.FillType = FillFormatType.Solid
chart.Series[0].DataPoints[3].Fill.SolidColor.Color = Color.get_AliceBlue()

# Set the data labels to display label value and percentage value
chart.Series[0].DataLabels.LabelValueVisible = True
chart.Series[0].DataLabels.PercentValueVisible = True

# Save the result file
presentation.SaveToFile("E:/Administrator/Python1/output/CreatePieChart.pptx", FileFormat.Pptx2016)
presentation.Dispose()
Hier ist das mit Spire.Presentation erstellte Kreisdiagramm:
Mit Spire.Presentation können Sie viel mehr als nur Kreisdiagramme erstellen. Es ermöglicht Ihnen auch, Säulendiagramme zu generieren, Liniendiagramme, Balkendiagramme und viele andere Arten von visuellen Darstellungen direkt in Ihren Folien. Außerdem unterstützt die Bibliothek mehrere Programmiersprachen �?egal ob Sie C#, Java, Python oder JavaScript bevorzugen, Sie können Diagramme einfach mit nur wenigen Codezeilen erstellen und anpassen.
Das Fazit
In dieser Anleitung haben wir Schritt für Schritt gezeigt, wie man ein Kreisdiagramm in PowerPoint erstellt, vom manuellen Einfügen des Diagramms bis zur Anpassung von Stil und Farben. Während die manuelle Methode für einfache Aufgaben gut funktioniert, ist Spire.Presentation in komplexeren Situationen besser geeignet. Mit dieser professionellen Bibliothek können Sie den gesamten Prozess automatisieren �?vom Hinzufügen von Diagrammen und der Eingabe von Daten bis zur Anpassung ihres Erscheinungsbildes. Probieren Sie es sofort aus, indem Sie eine temporäre Lizenz für 30 Tage erhalten, was die Erstellung von Diagrammen schneller und effizienter als je zuvor macht.
Häufig gestellte Fragen zum Erstellen eines Kreisdiagramms in PowerPoint
1. Wie erstelle ich Schritt für Schritt ein Kreisdiagramm in PowerPoint?
Gehen Sie zu Einfügen �?Diagramm �?Kreis, ersetzen Sie dann die Beispieldaten durch Ihre eigenen und passen Sie den Diagrammstil unter Diagrammentwurf an.
2. Wie kann ich Prozentsätze in einem Kreisdiagramm anzeigen?
Klicken Sie auf das Diagramm, wählen Sie Datenbeschriftungen �?Weitere Optionen und aktivieren Sie Prozent, um Werte als Prozentsätze anzuzeigen.
3. Wie erstelle ich ein Fortschritts-Kreisdiagramm in PowerPoint?
Verwenden Sie ein Kreis- oder Ringdiagramm mit zwei Werten �?Fortschritt und verbleibend �?und formatieren Sie die Segmente mit unterschiedlichen Farben.
4. Kann ich die Erstellung von Kreisdiagrammen automatisieren?
Ja. Sie können Spire.Presentation verwenden, um Diagramme automatisch zu generieren und zu bearbeiten, nachdem Sie eine temporäre Lizenz erhalten haben.
AUCH LESEN
Как создать круговую диаграмму в PowerPoint пошагово
Содержание
Установить с помощью Pypi
pip install spire.presentation
Похожие ссылки
Сделать ваши данные легкими для понимания может быть непросто, особенно если вы не знаете, как превратить цифры в визуальные образы. Если вы когда-либо открывали PowerPoint и задавались вопросом, как быстро создать диаграмму, вы попали по адресу. В этом руководстве вы шаг за шагом узнаете, как создать круговую диаграмму в PowerPoint. Мы рассмотрим все: от добавления диаграммы до настройки цветов и меток, чтобы ваши слайды выглядели четкими и профессиональными. К концу вы сможете представлять свои данные в простой, привлекательной и понятной для всех форме.
- Создать круговую диаграмму вручную
- Создать круговую диаграмму автоматически
- Заключение
- Часто задаваемые вопросы
Как создать круговую диаграмму в PowerPoint вручную
Создать круговую диаграмму в PowerPoint проще, чем вы думаете. В этой главе мы пошагово проведем вас через этот процесс. Сначала убедитесь, что у вас готовы данные и презентация PowerPoint. Самое главное, на вашем устройстве должен быть установлен Microsoft PowerPoint или другое приложение для редактирования презентаций. В этом руководстве мы будем использовать Microsoft PowerPoint в качестве примера. Как только вы будете готовы, давайте приступим к сегодняшнему руководству.
Шаг 1: Откройте вашу презентацию
Начните с поиска и открытия файла PowerPoint, в который вы хотите добавить диаграмму.
Шаг 2: Выберите слайд
Выберите слайд, на котором должна появиться круговая диаграмма. Убедитесь, что он готов для данных, которые вы хотите показать.
Шаг 3: Вставьте диаграмму
Перейдите на вкладку Вставка на Ленте вверху и нажмите Диаграмма.
Шаг 4: Выберите круговую диаграмму
В диалоговом окне Вставка диаграммы выберите Круговая на левой панели. Вы увидите несколько типов круговых диаграмм �?если вы хотите создать объемную круговую диаграмму на слайде, выберите второй вариант. Нажмите OK, чтобы вставить диаграмму.
Шаг 5: Введите ваши данные
PowerPoint покажет данные по умолчанию в листе, похожем на Excel. Замените их своими собственными цифрами в соответствии с потребностями вашей презентации.
Шаг 6: Настройте диаграмму
Нажмите на диаграмму и перейдите на вкладку Конструктор диаграмм на Ленте. Здесь вы можете изменить стиль, цвета, метки или даже переключиться на другой тип диаграммы. Поэкспериментируйте, пока она не будет выглядеть идеально для вашего слайда.
Вот окончательный вид круговой диаграммы:
Как создать круговую диаграмму в презентации PowerPoint автоматически
После того, как вы научились добавлять круговую диаграмму в PowerPoint вручную, вы, вероятно, заметили, что шаги могут быть немного утомительными, особенно при обновлении данных или настройке диаграммы. Итак, есть ли более быстрый способ?
Использование кода для создания диаграмм �?отличное решение. С помощью Spire.Presentation, профессиональной библиотеки для PowerPoint, вы можете легко создавать диаграммы автоматически, управляя всем: от настройки файла до ввода данных и настройки диаграммы за один раз.
Вот подробное руководство о том, как создать диаграмму в PowerPoint с использованием Spire.Presentation:
Шаг 1: Установите Spire.Presentation
В этом руководстве мы будем использовать Spire.Presentation for Python. Вы можете установить его через pip, открыв свою среду Python (например, терминал VSCode) и выполнив:
pip install spire.presentation
Нажмите Enter, и библиотека будет установлена.
Шаг 2: Напишите код
Вот общая логика создания круговой диаграммы с помощью Spire.Presentation:
- Импортируйте файл �?Загрузите презентацию PowerPoint, с которой вы хотите работать, или создайте новую.
- Доступ к целевому слайду �?Выберите слайд, на который будет вставлена круговая диаграмма.
- Вставьте круговую диаграмму �?Добавьте объект круговой диаграммы на слайд.
- Установите заголовок диаграммы �?Дайте вашей круговой диаграмме заголовок.
- Добавьте данные в диаграмму �?Заполните круговую диаграмму вашим набором данных.
- Настройте цвета диаграммы �?Настройте цвета, чтобы сделать диаграмму визуально привлекательной.
Ниже приведен полный код на Python, показывающий, как создать круговую диаграмму при создании новой презентации PowerPoint:
from spire.presentation.common import *
from spire.presentation import *

# Create a Presentation instance
presentation = Presentation()

# Add a pie chart at a specified location on the first slide
rect = RectangleF.FromLTRB (40, 100, 590, 420)
chart = presentation.Slides[0].Shapes.AppendChartInit (ChartType.Pie, rect, False)

# Set and format chart title
chart.ChartTitle.TextProperties.Text = "Sales by Quarter (2024)"
chart.ChartTitle.TextProperties.IsCentered = True
chart.ChartTitle.Height = 30
chart.HasTitle = True

# Define some data
quarters = ["1st Qtr", "2nd Qtr", "3rd Qtr", "4th Qtr"]
sales = [210, 320, 180, 460]

# Append data to ChartData, which represents a data table where the chart data is stored
chart.ChartData[0,0].Text = "Quarters"
chart.ChartData[0,1].Text = "Sales"
i = 0
while i < len(quarters):
    chart.ChartData[i + 1,0].Text = quarters[i]
    chart.ChartData[i + 1,1].NumberValue = sales[i]
    i += 1

# Set series labels and category labels
chart.Series.SeriesLabel = chart.ChartData["B1","B1"]
chart.Categories.CategoryLabels = chart.ChartData["A2","A5"]

# Set values for series
chart.Series[0].Values = chart.ChartData["B2","B5"]

# Add data points to series
for i, unusedItem in enumerate(chart.Series[0].Values):
    cdp = ChartDataPoint(chart.Series[0])
    cdp.Index = i
    chart.Series[0].DataPoints.Add(cdp)

# Fill each data point with a different color
chart.Series[0].DataPoints[0].Fill.FillType = FillFormatType.Solid
chart.Series[0].DataPoints[0].Fill.SolidColor.Color = Color.get_Honeydew()
chart.Series[0].DataPoints[1].Fill.FillType = FillFormatType.Solid
chart.Series[0].DataPoints[1].Fill.SolidColor.Color = Color.get_LightBlue()
chart.Series[0].DataPoints[2].Fill.FillType = FillFormatType.Solid
chart.Series[0].DataPoints[2].Fill.SolidColor.Color = Color.get_LightPink()
chart.Series[0].DataPoints[3].Fill.FillType = FillFormatType.Solid
chart.Series[0].DataPoints[3].Fill.SolidColor.Color = Color.get_AliceBlue()

# Set the data labels to display label value and percentage value
chart.Series[0].DataLabels.LabelValueVisible = True
chart.Series[0].DataLabels.PercentValueVisible = True

# Save the result file
presentation.SaveToFile("E:/Administrator/Python1/output/CreatePieChart.pptx", FileFormat.Pptx2016)
presentation.Dispose()
Вот круговая диаграмма, созданная с помощью Spire.Presentation:
С помощью Spire.Presentation вы можете делать гораздо больше, чем просто создавать круговые диаграммы. Он также позволяет создавать столбчатые диаграммы, линейные диаграммы, гистограммы и многие другие типы визуализаций прямо в ваших слайдах. Кроме того, библиотека поддерживает несколько языков программирования �?предпочитаете ли вы C#, Java, Python или JavaScript, вы можете легко создавать и настраивать диаграммы всего несколькими строками кода.
Заключение
В этом руководстве мы пошагово рассмотрели, как создать круговую диаграмму в PowerPoint, от ручной вставки диаграммы до настройки ее стиля и цветов. Хотя ручной метод хорошо подходит для простых задач, Spire.Presentation работает лучше в сложных ситуациях. С помощью этой профессиональной библиотеки вы можете автоматизировать весь процесс �?от добавления диаграмм и ввода данных до настройки их внешнего вида. Попробуйте его немедленно, получив временную лицензию на 30 дней, что сделает создание диаграмм быстрее и эффективнее, чем когда-либо.
Часто задаваемые вопросы о создании круговой диаграммы в PowerPoint
1. Как мне пошагово создать круговую диаграмму в PowerPoint?
Перейдите в Вставка �?Диаграмма �?Круговая, затем замените образцы данных своими собственными и настройте стиль диаграммы в разделе Конструктор диаграмм.
2. Как я могу показать проценты в круговой диаграмме?
Нажмите на диаграмму, выберите Метки данных �?Дополнительные параметры и установите флажок Проценты, чтобы отображать значения в виде процентов.
3. Как мне сделать круговую диаграмму прогресса в PowerPoint?
Используйте круговую или кольцевую диаграмму с двумя значениями �?прогресс и оставшаяся часть �?и отформатируйте секторы разными цветами.
4. Могу ли я автоматизировать создание круговой диаграммы?
Да. Вы можете использовать Spire.Presentation для автоматического создания и редактирования диаграмм после получения временной лицензии.
ЧИТАЙТЕ ТАКЖЕ