
Knowledgebase (2370)
Children categories
Margins in a PDF document refer to the blank spaces surrounding the content on each page. They act as a buffer zone between the text or images and the edges of the page. Changing the margins of a PDF document can be a useful task when you want to adjust the layout, accommodate annotations or comments, or prepare the document for printing or presentation.
This article introduces how to modify the margins of a PDF document using the Spire.PDF for Python library. You will discover techniques to both increase and reduce the margins of your PDFs, enabling you to customize the layout according to your specific requirements.
Install Spire.PDF for Python
This scenario requires Spire.PDF for Python and plum-dispatch v1.7.4. They can be easily installed in your Windows through the following pip command.
pip install Spire.PDF
If you are unsure how to install, please refer to this tutorial: How to Install Spire.PDF for Python on Windows
Increase the Margins of a PDF Document in Python
In Spire.PDF for Python, there isn't a direct method to modify the margins of an existing PDF document. However, you can increase the margins by creating a new PDF document with a page size equal to the original document's page size plus the increased margin values. Then, copy and paste (draw) each page of the original document into the appropriate place on the new document page.
The following are the steps to increase the margins of a PDF document using Python.
- Create a PdfDocument object called "originalPdf" and load the original PDF document.
- Create another PdfDocument object called "newPdf" for creating a new PDF document.
- Specify the desired increase values for the top, bottom, left, and right margins.
- Calculate the new page size by adding the margin increase values to the original page dimensions.
- Create a template based on the original PDF page using PdfPageBase.CreateTemplate() method.
- Add a new page to the "newPdf" document with the calculated page size using PdfDocument.Pages.Add() method.
- Draw the template onto the new page at the appropriate location to using PdfTemplate.Draw() method.
- Repeat steps 5-7 for each page in the original PDF document.
- Save the "newPdf" object to a PDF file.
- Python
from spire.pdf.common import *
from spire.pdf import *

# Create a PdfDocument object
originalPdf = PdfDocument()

# Load a PDF file
originalPdf.LoadFromFile("C:\\Users\\Administrator\\Desktop\\Input.pdf")

# Get the first page
"firstPage = originalPdf.Pages.get_Item(0)

# Create another PdfDocument object for creating new document
newPdf = PdfDocument()

# Set the increase values of the margins
marginsToAdd = newPdf.PageSettings.Margins
marginsToAdd.Top = 40
marginsToAdd.Bottom = 40
marginsToAdd.Left = 40
marginsToAdd.Right = 40

# Calculate the new page size
sizeF = SizeF(firstPage.Size.Width + marginsToAdd.Left + marginsToAdd.Right, firstPage.Size.Height + marginsToAdd.Top + marginsToAdd.Bottom)

# Iterate through the pages in the original document
for i in range(originalPdf.Pages.Count):

    # Create a template based on a specific page
    pdfTemplate = originalPdf.Pages.get_Item(i).CreateTemplate()"

    # Add a page to the new PDF
    page = newPdf.Pages.Add(sizeF)

    # Draw template on the page
    pdfTemplate.Draw(page, 0.0, 0.0)

# Save the new document
newPdf.SaveToFile("Output/IncreaseMargins.pdf", FileFormat.PDF)

# Dispose resources
originalPdf.Dispose()
newPdf.Dispose()
Reduce the Margins of a PDF Document in Python
Similarly, you can reduce the margins by creating a new PDF document with a page size equal to the page size of the original document minus the margin value to be reduced. Then, copy and paste (draw) each page of the original document into the appropriate place on the new document page.
To reduce the margins of a PDF document using Python, follow these steps:
- Create a PdfDocument object called "originalPdf" and load the original PDF document.
- Create another PdfDocument object called "newPdf" for creating a new PDF document.
- Specify the desired reduction values for the top, bottom, left, and right margins.
- Calculate the new page size by subtracting the margin value to be reduced from the original page size.
- Create a template based on the original PDF page using PdfPageBase.CreateTemplate() method.
- Add a new page to the "newPdf" document with the calculated page size using PdfDocument.Pages.Add() method.
- Draw the template onto the new page at the appropriate location using PdfTemplate.Draw() method.
- Repeat steps 5-7 for each page in the original PDF document.
- Save the "newPdf" object to a PDF file.
- Python
from spire.pdf.common import *
from spire.pdf import *

# Create a PdfDocument object
originalPdf = PdfDocument()

# Load a PDF file
originalPdf.LoadFromFile(""C:\\Users\\Administrator\\Desktop\\Input.pdf"")

# Get the first page
firstPage = originalPdf.Pages.get_Item(0)

# Create another PdfDocument object
newPdf = PdfDocument()

# Set the reduction value of the margins
topToReduce = 20.0
bottomToReduce = 20.0
leftToReduce = 20.0
rightToReduce = 20.0

# Calculate the new page size
sizeF = SizeF(firstPage.Size.Width - leftToReduce - rightToReduce, firstPage.Size.Height - topToReduce - bottomToReduce)

# Iterate through the pages in the original document
for i in range(originalPdf.Pages.Count):

    # Create a template based on a specific page
    pdfTemplate = originalPdf.Pages.get_Item(i).CreateTemplate()

    # Add a page to the new PDF
    page = newPdf.Pages.Add(sizeF, PdfMargins(0.0))

    # Draw template on the page
    pdfTemplate.Draw(page, -leftToReduce, -topToReduce)

# Save the new document
newPdf.SaveToFile(""Output/ReduceMargins.pdf"", FileFormat.PDF)

# Dispose resources
originalPdf.Dispose()
newPdf.Dispose()
Apply for a Temporary License
If you'd like to remove the evaluation message from the generated documents, or to get rid of the function limitations, please request a 30-day trial license for yourself.
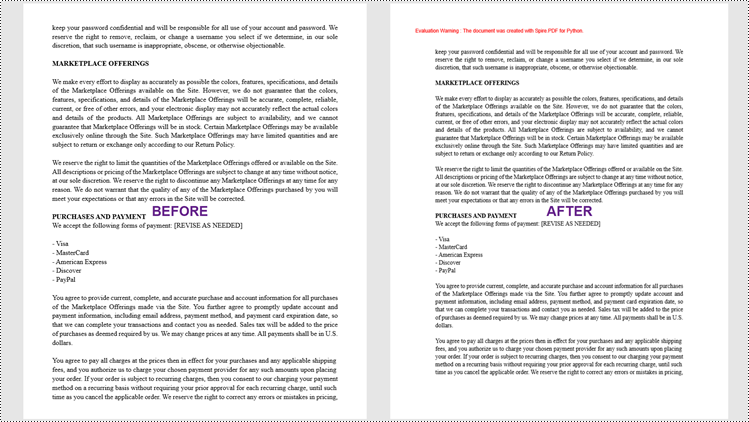
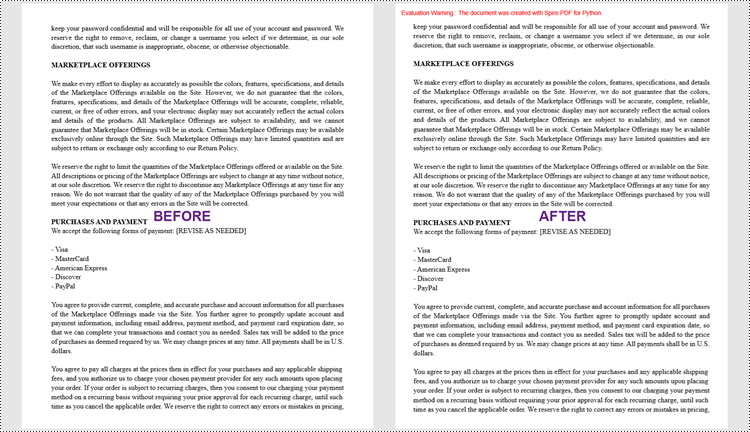
Paragraph spacing and line spacing are crucial formatting options in Microsoft Word that greatly influence the visual presentation and readability of your documents. Paragraph spacing determines the vertical space between paragraphs, creating a distinct separation between each paragraph. Line spacing, on the other hand, controls the vertical distance between lines within a paragraph, directly impacting the density and readability of the text. By appropriately setting paragraph spacing and line spacing, you can easily create visually appealing and easy-to-read documents. In this article, we will explain how to set paragraph spacing and line spacing in Word documents in Python using Spire.Doc for Python.
Install Spire.Doc for Python
This scenario requires Spire.Doc for Python and plum-dispatch v1.7.4. They can be easily installed in your Windows through the following pip commands.
pip install Spire.Doc
If you are unsure how to install, please refer to this tutorial: How to Install Spire.Doc for Python on Windows
Set Paragraph Spacing in Word in Python
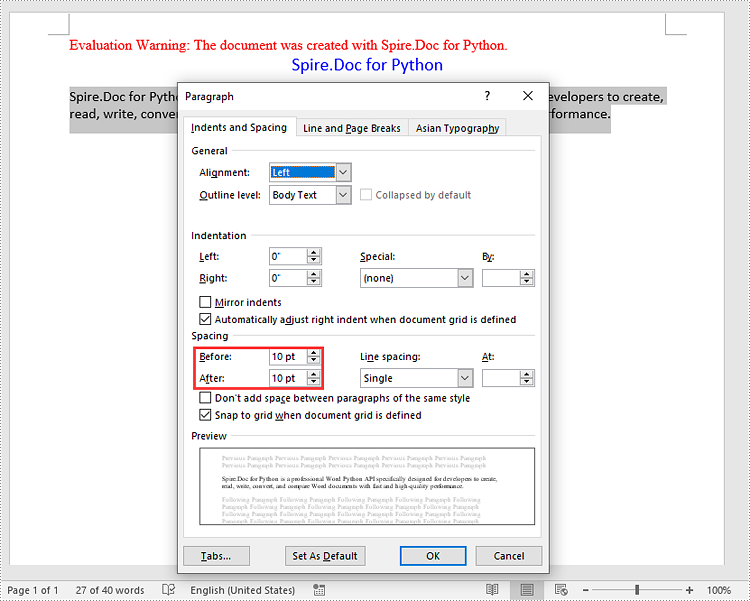
Spire.Doc for Python provides the Paragraph.Format.BeforeSpacing and Paragraph.Format.AfterSpacing properties to adjust the spacing before and after a paragraph. The detailed steps are as follows.
- Create an object of the Document class.
- Add a section to the document using Document.AddSection() method.
- Add two paragraphs to the section using Section.AddParagraph() methods.
- Set the spacing before and after the paragraphs using Paragraph.Format.BeforeSpacing and Paragraph.Format.AfterSpacing properties.
- Save the result document using Document.SaveToFile() method.
- Python
from spire.doc import *
from spire.doc.common import *

# Create an object of the Document class
document = Document()
# Add a section to the document
section = document.AddSection()

# Add two paragraphs to the section
para1 = section.AddParagraph()
para1.Format.HorizontalAlignment = HorizontalAlignment.Center
textRange1 = para1.AppendText("Spire.Doc for Python")
textRange1.CharacterFormat.TextColor = Color.get_Blue()
textRange1.CharacterFormat.FontName = "Calibri"
textRange1.CharacterFormat.FontSize = 15

para2 = section.AddParagraph()
textRange2 = para2.AppendText("Spire.Doc for Python is a professional Word Python API specifically designed for developers to create, read, write, convert, and compare Word documents with fast and high-quality performance.")
textRange2.CharacterFormat.FontName = "Calibri"
textRange2.CharacterFormat.FontSize = 12

# Set the spacing after the first paragraph
para1.Format.AfterAutoSpacing = False
para1.Format.AfterSpacing = 10

# Set the spacing before and after the second paragraph
para2.Format.BeforeAutoSpacing = False
para2.Format.BeforeSpacing = 10
para2.Format.AfterAutoSpacing = False
para2.Format.AfterSpacing = 10

# Save the result file
document.SaveToFile("SetParagraphSpacing.docx", FileFormat.Docx2013)
document.Close()
Set Line Spacing in Word in Python
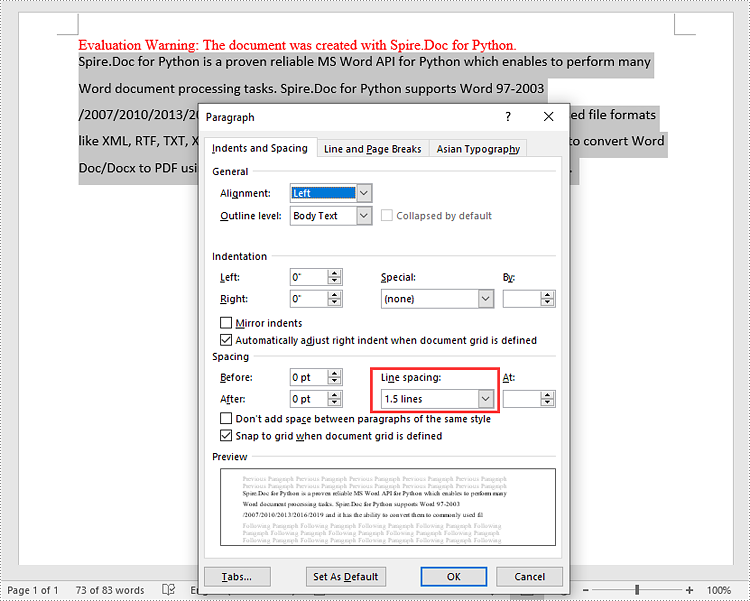
To set the pacing between lines in a paragraph, you can use the Paragraph.Format.LineSpacing property. The detailed steps are as follows.
- Create an object of the Document class.
- Add a section to the document using Document.AddSection() method.
- Add a paragraph to the section using Section.AddParagraph() methods.
- Set the spacing between lines in the paragraph using Paragraph.Format.LineSpacing property.
- Save the result document using Document.SaveToFile() method.
- Python
from spire.doc import *
from spire.doc.common import *

# Create an object of the Document class
document = Document()
# Add a section
section = document.AddSection()

# Add a paragraph to the section
para = section.AddParagraph()
textRange = para.AppendText("Spire.Doc for Python is a proven reliable MS Word API for Python which enables to perform many Word document processing tasks. Spire.Doc for Python supports Word 97-2003 /2007/2010/2013/2016/2019 and it has the ability to convert them to commonly used file formats like XML, RTF, TXT, XPS, EPUB, EMF, HTML and vice versa. Furthermore, it supports to convert Word Doc/Docx to PDF using Python, Word to SVG, and Word to PostScript in high quality.")
textRange.CharacterFormat.FontName = "Calibri"
textRange.CharacterFormat.FontSize = 12

# Set line spacing rule
para.Format.LineSpacingRule = LineSpacingRule.Multiple
# Set line spacing value (The line spacing rule "Multiple" with value 18 sets the line spacing to "1.5 lines", value 12 sets the line spacing to "Single")
para.Format.LineSpacing = 18

# Save the result file
document.SaveToFile("SetLineSpacing.docx", FileFormat.Docx2013)
document.Close()
Apply for a Temporary License
If you'd like to remove the evaluation message from the generated documents, or to get rid of the function limitations, please request a 30-day trial license for yourself.
PDF is an ideal file format for sharing and archiving. If you are working with text files, you may find it beneficial to convert them to PDF files for enhanced portability, security and format preservation. In this article, you will learn how to convert TXT files to PDF in Python using Spire.PDF for Python.
Install Spire.PDF for Python
This scenario requires Spire.PDF for Python and plum-dispatch v1.7.4. They can be easily installed in your Windows through the following pip command.
pip install Spire.PDF
If you are unsure how to install, please refer to this tutorial: How to Install Spire.PDF for Python on Windows
Convert TXT to PDF with Python
Spire.PDF for Python allows to convert text files to PDF by reading the text content from the input TXT file, and then drawing it onto the pages of a PDF document. Some of the core classes and methods used are listed below:
- PdfDocument class: Represents a PDF document model.
- PdfTextWidget class: Represents the text area with the ability to span several pages.
- File.ReadAllText() method: Reads the text in the text file into a string object.
- PdfDocument.Pages.Add() method: Adds a page to a PDF document.
- PdfTextWidget.Draw() method: Draws the text widget at a specified location on the page.
The following are the detailed steps to convert TXT to PDF in Python:
- Read text from the TXT file using File.ReadAllText() method.
- Create a PdfDocument instance and add a page to the PDF file.
- Create a PDF font and brush objects.
- Set the text format and layout.
- Create a PdfTextWidget object to hold the text content.
- Draw the text widget at a specified location on the PDF page using PdfTextWidget.Draw() method.
- Save the PDF file using PdfDocument.SaveToFile() method.
- Python
from spire.pdf.common import *
from spire.pdf import *
def ReadFromTxt(fname: str) -> str:
with open(fname, 'r') as f:
text = f.read()
return text
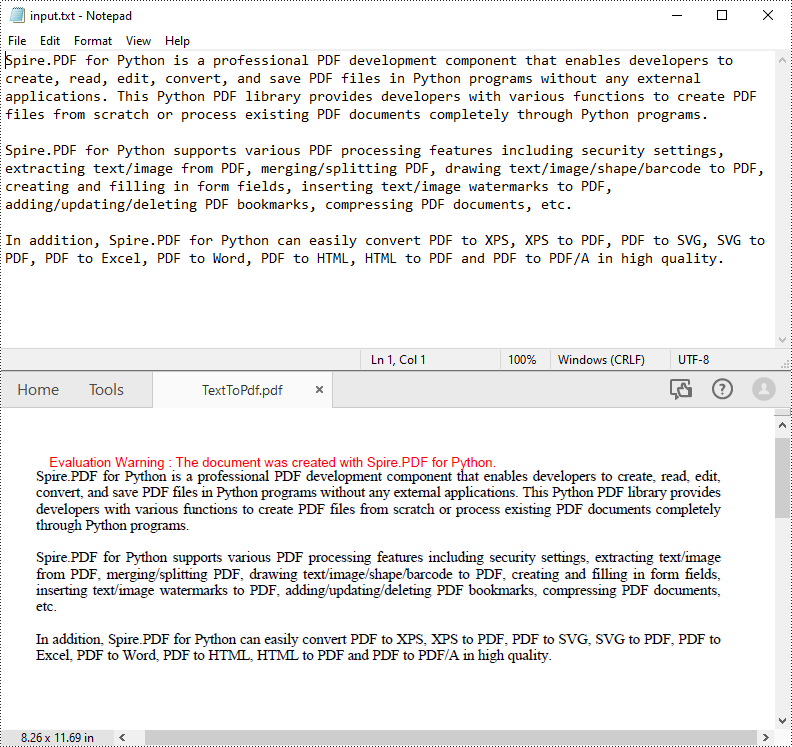
inputFile = "input.txt"
outputFile = "TextToPdf.pdf"
# Get text from the txt file
text = ReadFromTxt(inputFile)
# Create a PdfDocument instance
pdf = PdfDocument()
# Add a page
page = pdf.Pages.Add()
# Create a PDF font and PDF brush
font = PdfFont(PdfFontFamily.TimesRoman, 11.0)
brush = PdfBrushes.get_Black()
# Set the text alignment and line spacing
strformat = PdfStringFormat()
strformat.LineSpacing = 10.0
strformat.Alignment = PdfTextAlignment.Justify
# Set the text layout
textLayout = PdfTextLayout()
textLayout.Break = PdfLayoutBreakType.FitPage
textLayout.Layout = PdfLayoutType.Paginate
# Create a PdfTextWidget instance to hold the text content
textWidget = PdfTextWidget(text, font, brush)
# Set the text format
textWidget.StringFormat = strformat
# Draw the text at the specified location on the page
bounds = RectangleF(PointF(0.0, 20.0), page.Canvas.ClientSize)
textWidget.Draw(page, bounds, textLayout)
# Save the result file
pdf.SaveToFile(outputFile, FileFormat.PDF)
pdf.Close()
Apply for a Temporary License
If you'd like to remove the evaluation message from the generated documents, or to get rid of the function limitations, please request a 30-day trial license for yourself.
