
Knowledgebase (2370)
Children categories
Formulas in Excel are equations or expressions that perform calculations on data within a spreadsheet. They allow you to perform basic arithmetic operations like addition, subtraction, multiplication, and division, as well as more advanced functions like statistical analysis, date and time calculations, and logical evaluations. By incorporating formulas into your Excel spreadsheets, you can save time, eliminate errors, and gain valuable insights from your data. In this article, we will demonstrate how to add or read formulas in Excel in Python using Spire.XLS for Python.
Install Spire.XLS for Python
This scenario requires Spire.XLS for Python and plum-dispatch v1.7.4. They can be easily installed in your Windows through the following pip command.
pip install Spire.XLS
If you are unsure how to install, please refer to this tutorial: How to Install Spire.XLS for Python on Windows
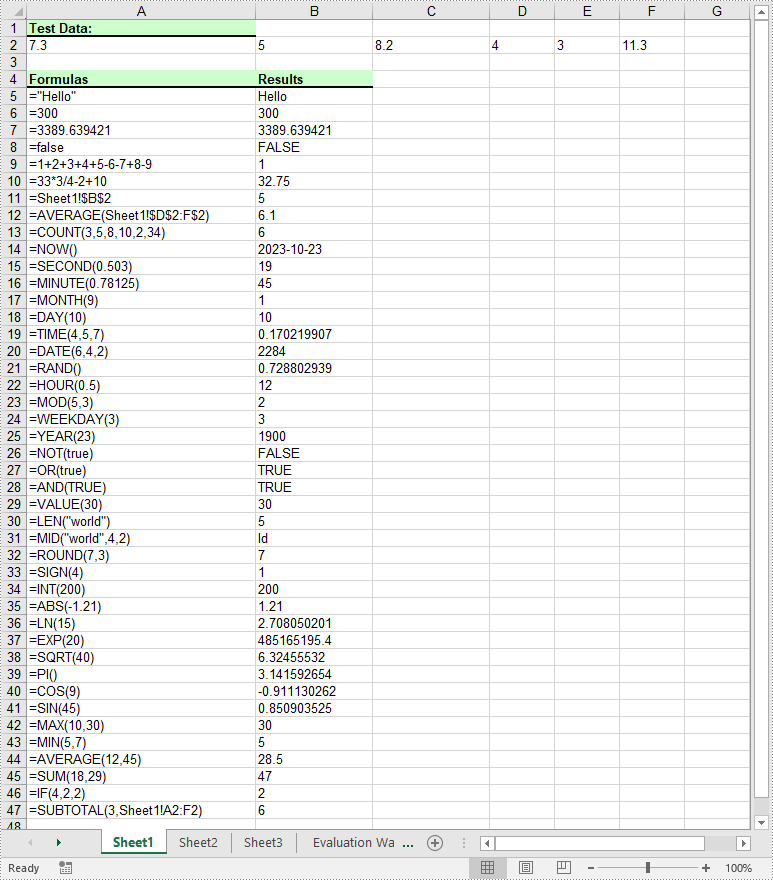
Add Formulas to Excel in Python
Spire.XLS for Python offers the Worksheet.Range[rowIndex, columnIndex].Formula property to add formulas to specific cells in an Excel worksheet. The detailed steps are as follows.
- Create an object of the Workbook class.
- Get a specific worksheet by its index using the Workbook.Worksheets[sheetIndex] property.
- Add some text and numeric data to specific cells of the worksheet using the Worksheet.Range[rowIndex, columnIndex].Text and Worksheet.Range[rowIndex, columnIndex].NumberValue properties.
- Add text and formulas to specific cells of the worksheet using the Worksheet.Range[rowIndex, columnIndex].Text and Worksheet.Range[rowIndex, columnIndex].Formula properties.
- Save the result file using the Workbook.SaveToFile() method.
- Python
from spire.xls import *
from spire.xls.common import *

# Create an object of the Workbook class
workbook = Workbook()

# Get the first worksheet
sheet = workbook.Worksheets[0]

# Declare two variables: currentRow, currentFormula
currentRow = 1
currentFormula = ""

# Add text to the worksheet and set cell style
sheet.Range[currentRow, 1].Text = "Test Data:"
sheet.Range[currentRow, 1].Style.Font.IsBold = True
sheet.Range[currentRow, 1].Style.FillPattern = ExcelPatternType.Solid
sheet.Range[currentRow, 1].Style.KnownColor = ExcelColors.LightGreen1
sheet.Range[currentRow, 1].Style.Borders[BordersLineType.EdgeBottom].LineStyle = LineStyleType.Medium
currentRow += 1

# Add some numeric data to the worksheet
sheet.Range[currentRow, 1].NumberValue = 7.3
sheet.Range[currentRow, 2].NumberValue = 5
sheet.Range[currentRow, 3].NumberValue = 8.2
sheet.Range[currentRow, 4].NumberValue = 4
sheet.Range[currentRow, 5].NumberValue = 3
sheet.Range[currentRow, 6].NumberValue = 11.3
currentRow += 2

# Add text to the worksheet and set cell style
sheet.Range[currentRow, 1].Text = "Formulas"
sheet.Range[currentRow, 2].Text = "Results"
sheet.Range[currentRow, 1, currentRow, 2].Style.Font.IsBold = True
sheet.Range[currentRow, 1, currentRow, 2].Style.KnownColor = ExcelColors.LightGreen1
sheet.Range[currentRow, 1, currentRow, 2].Style.FillPattern = ExcelPatternType.Solid
sheet.Range[currentRow, 1, currentRow, 2].Style.Borders[BordersLineType.EdgeBottom].LineStyle = LineStyleType.Medium
currentRow += 1

# Add text and formulas to the worksheet
# Str
currentFormula = "=\"Hello\""
sheet.Range[currentRow, 1].Text = "'" + currentFormula
sheet.Range[currentRow, 2].Formula = currentFormula
currentRow += 1

# Int
currentFormula = "=300"
sheet.Range[currentRow, 1].Text = "'" + currentFormula
sheet.Range[currentRow, 2].Formula = currentFormula
currentRow += 1

# Float
currentFormula = "=3389.639421"
sheet.Range[currentRow, 1].Text = "'" + currentFormula
sheet.Range[currentRow, 2].Formula = currentFormula
currentRow += 1

# Bool
currentFormula = "=false"
sheet.Range[currentRow, 1].Text = "'" + currentFormula
sheet.Range[currentRow, 2].Formula = currentFormula
currentRow += 1

# Expressions
currentFormula = "=1+2+3+4+5-6-7+8-9"
sheet.Range[currentRow, 1].Text = "'" + currentFormula
sheet.Range[currentRow, 2].Formula = currentFormula
currentRow += 1

currentFormula = "=33*3/4-2+10"
sheet.Range[currentRow, 1].Text = "'" + currentFormula
sheet.Range[currentRow, 2].Formula = currentFormula
currentRow += 1

# Cell reference
currentFormula = "=Sheet1!$B$2"
sheet.Range[currentRow, 1].Text = "'" + currentFormula
sheet.Range[currentRow, 2].Formula = currentFormula
currentRow += 1

# Functions
# AVERAGE
currentFormula = "=AVERAGE(Sheet1!$D$2:F$2)"
sheet.Range[currentRow, 1].Text = "'" + currentFormula
sheet.Range[currentRow, 2].Formula = currentFormula
currentRow += 1

# COUNT
currentFormula = "=COUNT(3,5,8,10,2,34)"
sheet.Range[currentRow, 1].Text = "'" + currentFormula
sheet.Range[currentRow, 2].Formula = currentFormula
currentRow += 1

# NOW
currentFormula = "=NOW()"
sheet.Range[currentRow, 1].Text = "'" + currentFormula
sheet.Range[currentRow, 2].Formula = currentFormula
sheet.Range[currentRow, 2].Style.NumberFormat = "yyyy-MM-DD"
currentRow += 1

# SECOND
currentFormula = "=SECOND(0.503)"
sheet.Range[currentRow, 1].Text = "'" + currentFormula
sheet.Range[currentRow, 2].Formula = currentFormula
currentRow += 1

# MINUTE
currentFormula = "=MINUTE(0.78125)"
sheet.Range[currentRow, 1].Text = "'" + currentFormula
sheet.Range[currentRow, 2].Formula = currentFormula
currentRow += 1

# MONTH
currentFormula = "=MONTH(9)"
sheet.Range[currentRow, 1].Text = "'" + currentFormula
sheet.Range[currentRow, 2].Formula = currentFormula
currentRow += 1

# DAY
currentFormula = "=DAY(10)"
sheet.Range[currentRow, 1].Text = "'" + currentFormula
sheet.Range[currentRow, 2].Formula = currentFormula
currentRow += 1

# TIME
currentFormula = "=TIME(4,5,7)"
sheet.Range[currentRow, 1].Text = "'" + currentFormula
sheet.Range[currentRow, 2].Formula = currentFormula
currentRow += 1

# DATE
currentFormula = "=DATE(6,4,2)"
sheet.Range[currentRow, 1].Text = "'" + currentFormula
sheet.Range[currentRow, 2].Formula = currentFormula
currentRow += 1

# RAND
currentFormula = "=RAND()"
sheet.Range[currentRow, 1].Text = "'" + currentFormula
sheet.Range[currentRow, 2].Formula = currentFormula
currentRow += 1

# HOUR
currentFormula = "=HOUR(0.5)"
sheet.Range[currentRow, 1].Text = "'" + currentFormula
sheet.Range[currentRow, 2].Formula = currentFormula
currentRow += 1

# MOD
currentFormula = "=MOD(5,3)"
sheet.Range[currentRow, 1].Text = "'" + currentFormula
sheet.Range[currentRow, 2].Formula = currentFormula
currentRow += 1

# WEEKDAY
currentFormula = "=WEEKDAY(3)"
sheet.Range[currentRow, 1].Text = "'" + currentFormula
sheet.Range[currentRow, 2].Formula = currentFormula
currentRow += 1

# YEAR
currentFormula = "=YEAR(23)"
sheet.Range[currentRow, 1].Text = "'" + currentFormula
sheet.Range[currentRow, 2].Formula = currentFormula
currentRow += 1

# NOT
currentFormula = "=NOT(true)"
sheet.Range[currentRow, 1].Text = "'" + currentFormula
sheet.Range[currentRow, 2].Formula = currentFormula
currentRow += 1

# OR
currentFormula = "=OR(true)"
sheet.Range[currentRow, 1].Text = "'" + currentFormula
sheet.Range[currentRow, 2].Formula = currentFormula
currentRow += 1

# AND
currentFormula = "=AND(TRUE)"
sheet.Range[currentRow, 1].Text = "'" + currentFormula
sheet.Range[currentRow, 2].Formula = currentFormula
currentRow += 1

# VALUE
currentFormula = "=VALUE(30)"
sheet.Range[currentRow, 1].Text = "'" + currentFormula
sheet.Range[currentRow, 2].Formula = currentFormula
currentRow += 1

# LEN
currentFormula = "=LEN(\"world\")"
sheet.Range[currentRow, 1].Text = "'" + currentFormula
sheet.Range[currentRow, 2].Formula = currentFormula
currentRow += 1

# MID
currentFormula = "=MID(\"world\",4,2)"
sheet.Range[currentRow, 1].Text = "'" + currentFormula
sheet.Range[currentRow, 2].Formula = currentFormula
currentRow += 1

# ROUND
currentFormula = "=ROUND(7,3)"
sheet.Range[currentRow, 1].Text = "'" + currentFormula
sheet.Range[currentRow, 2].Formula = currentFormula
currentRow += 1

# SIGN
currentFormula = "=SIGN(4)"
sheet.Range[currentRow, 1].Text = "'" + currentFormula
sheet.Range[currentRow, 2].Formula = currentFormula
currentRow += 1

# INT
currentFormula = "=INT(200)"
sheet.Range[currentRow, 1].Text = "'" + currentFormula
sheet.Range[currentRow, 2].Formula = currentFormula
currentRow += 1

# ABS
currentFormula = "=ABS(-1.21)"
sheet.Range[currentRow, 1].Text = "'" + currentFormula
sheet.Range[currentRow, 2].Formula = currentFormula
currentRow += 1

# LN
currentFormula = "=LN(15)"
sheet.Range[currentRow, 1].Text = "'" + currentFormula
sheet.Range[currentRow, 2].Formula = currentFormula
currentRow += 1

# EXP
currentFormula = "=EXP(20)"
sheet.Range[currentRow, 1].Text = "'" + currentFormula
sheet.Range[currentRow, 2].Formula = currentFormula
currentRow += 1

# SQRT
currentFormula = "=SQRT(40)"
sheet.Range[currentRow, 1].Text = "'" + currentFormula
sheet.Range[currentRow, 2].Formula = currentFormula
currentRow += 1

# PI
currentFormula = "=PI()"
sheet.Range[currentRow, 1].Text = "'" + currentFormula
sheet.Range[currentRow, 2].Formula = currentFormula
currentRow += 1

# COS
currentFormula = "=COS(9)"
sheet.Range[currentRow, 1].Text = "'" + currentFormula
sheet.Range[currentRow, 2].Formula = currentFormula
currentRow += 1

# SIN
currentFormula = "=SIN(45)"
sheet.Range[currentRow, 1].Text = "'" + currentFormula
sheet.Range[currentRow, 2].Formula = currentFormula
currentRow += 1

# MAX
currentFormula = "=MAX(10,30)"
sheet.Range[currentRow, 1].Text = "'" + currentFormula
sheet.Range[currentRow, 2].Formula = currentFormula
currentRow += 1

# MIN
currentFormula = "=MIN(5,7)"
sheet.Range[currentRow, 1].Text = "'" + currentFormula
sheet.Range[currentRow, 2].Formula = currentFormula
currentRow += 1

# AVERAGE
currentFormula = "=AVERAGE(12,45)"
sheet.Range[currentRow, 1].Text = "'" + currentFormula
sheet.Range[currentRow, 2].Formula = currentFormula
currentRow += 1

# SUM
currentFormula = "=SUM(18,29)"
sheet.Range[currentRow, 1].Text = "'" + currentFormula
sheet.Range[currentRow, 2].Formula = currentFormula
currentRow += 1

# IF
currentFormula = "=IF(4,2,2)"
sheet.Range[currentRow, 1].Text = "'" + currentFormula
sheet.Range[currentRow, 2].Formula = currentFormula
currentRow += 1

# SUBTOTAL
currentFormula = "=SUBTOTAL(3,Sheet1!A2:F2)"
sheet.Range[currentRow, 1].Text = "'" + currentFormula
sheet.Range[currentRow, 2].Formula = currentFormula
currentRow += 1

# Set width of the 1st, 2nd and 3rd columns
sheet.SetColumnWidth(1, 32)
sheet.SetColumnWidth(2, 16)
sheet.SetColumnWidth(3, 16)

# Create a cell style
style = workbook.Styles.Add("Style")
# Set the horizontal alignment as left
style.HorizontalAlignment = HorizontalAlignType.Left
# Apply the style to the worksheet
sheet.ApplyStyle(style)

# Save the result file
workbook.SaveToFile("AddFormulas.xlsx", ExcelVersion.Version2016)
workbook.Dispose()
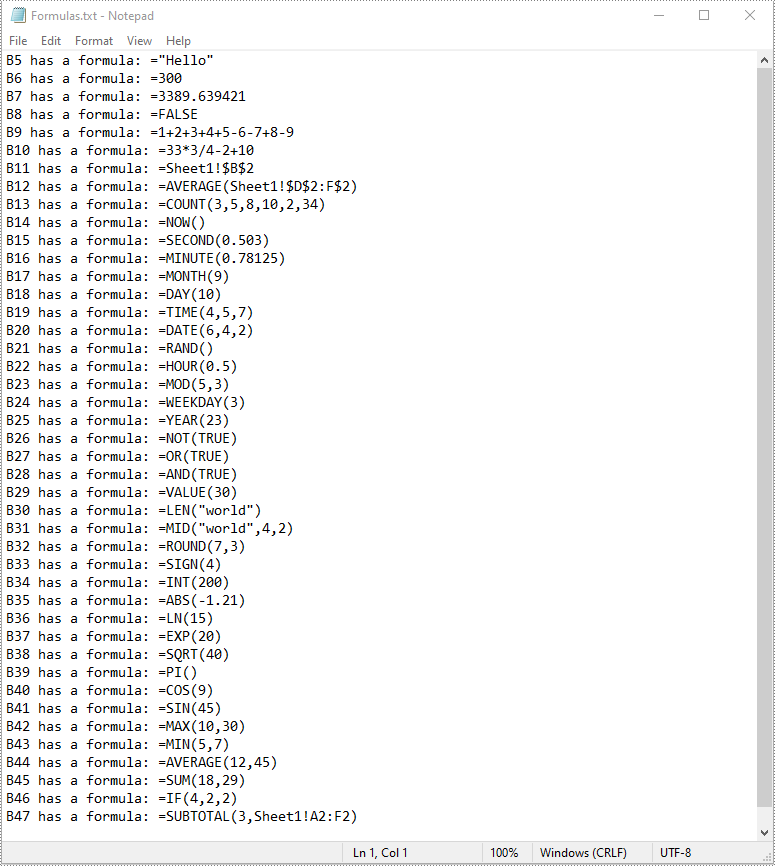
Read Formulas in Excel in Python
To read formulas in an Excel worksheet, you need to loop through all the cells in the worksheet, after that, find the cells containing formulas using the Cell.HasFormula property, and then get the formulas of the cells using the CellRange.Formula property. The detailed steps are as follows.
- Create an object of the Workbook class.
- Load an Excel file using the Workbook.LoadFromFile() method.
- Get a specific worksheet by its index using the Workbook.Worksheets[sheetIndex] property.
- Get the used range of the worksheet using the Worksheet.AllocatedRange property.
- Create an empty list.
- Loop through all the cells in the used range.
- Find the cells containing formulas using the Cell.HasFormula property.
- Get the names and the formulas of the cells using the CellRange.RangeAddressLocal and CellRange.Formula properties.
- Append the cell names and formulas to the list.
- Write the items in the list into a text file.
- Python
from spire.xls import *
from spire.xls.common import *

# Create an object of the Workbook class
workbook = Workbook()
# Load an Excel file
workbook.LoadFromFile("AddFormulas.xlsx")

# Get the first worksheet
sheet = workbook.Worksheets[0]

# Get the used range of the worksheet
usedRange = sheet.AllocatedRange

# Create an empty list
list = []

# Loop through the cells in the used range
for cell in usedRange:
    # Check if the cell has a formula
    if(cell.HasFormula):
        # Get the cell name
        cellName = cell.RangeAddressLocal
        # Get the formula
        formula = cell.Formula
        # Append the cell name and formula to the list
        list.append(cellName + " has a formula: " + formula)

# Write the items in the list into a text file
with open("Formulas.txt", "w", encoding = "utf-8") as text_file:
    for item in list:
        text_file.write(item + "\n")

workbook.Dispose()
Apply for a Temporary License
If you'd like to remove the evaluation message from the generated documents, or to get rid of the function limitations, please request a 30-day trial license for yourself.
Images have the power to captivate audiences and enhance their understanding of your content. By adding relevant and visually appealing images to your PowerPoint presentations, you can effectively convey complex ideas and make your presentations more memorable and impactful. In this article, we will explain how to add images to PowerPoint presentations in Python using Spire.Presentation for Python.
Install Spire.Presentation for Python
This scenario requires Spire.Presentation for Python and plum-dispatch v1.7.4. They can be easily installed in your Windows through the following pip command.
pip install Spire.Presentation
If you are unsure how to install, please refer to this tutorial: How to Install Spire.Presentation for Python on Windows
Add an Image to a Slide in Python
Spire.Presentation for Python offers the ISlide.Shapes.AppendEmbedImageByPath() method to add an image to a specific slide. The detailed steps are as follows.
- Create an object of the Presentation class.
- Load a PowerPoint presentation using Presentation.LoadFromFile() method.
- Get a specific slide by its index through Presentation.Slides[index] property.
- Add an image to the slide using ISlide.Shapes.AppendEmbedImageByPath() method.
- Save the resulting presentation using Presentation.SaveToFile() method.
- Python
from spire.presentation.common import *
import math
from spire.presentation import *

inputFile = "Input.pptx"
outputFile = "AddImageToSlide.pptx"

# Create an object of the Presentation class
presentation = Presentation()
# Load a PowerPoint presentation
presentation.LoadFromFile(inputFile)

# Get the first slide
slide = presentation.Slides[0]

# Insert an image into the slide
imageFile = "Image.png"
left = math.trunc(presentation.SlideSize.Size.Width / float(2)) - 280
rect1 = RectangleF.FromLTRB (left, 140, 120 + left, 260)
image = slide.Shapes.AppendEmbedImageByPath (ShapeType.Rectangle, imageFile, rect1)
image.Line.FillType = FillFormatType.none

# Save the resulting presentation
presentation.SaveToFile(outputFile, FileFormat.Pptx2010)
presentation.Dispose()
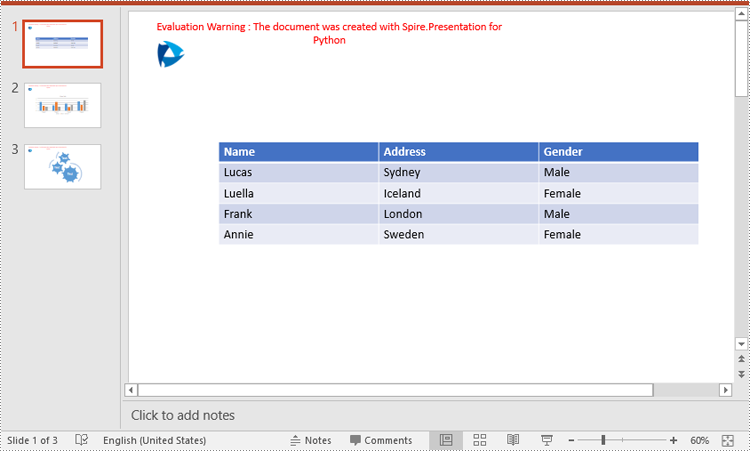
Add an Image to a Slide Master in Python
A slide master is the top-level slide that governs the formatting and styling of all other slides within the presentation. When you make changes to the slide master, such as adding a logo, modifying the background or changing the font styles, those changes are automatically applied to all slides based on that slide master. If you want an image to appear on all your slides, you can add it to the slide master.
Spire.Presentation for Python offers the IMasterSlide.Shapes.AppendEmbedImageByPath() method to add an image to a slide master. The detailed steps are as follows.
- Create an object of the Presentation class.
- Load a PowerPoint presentation using Presentation.LoadFromFile() method.
- Get a specific slide master by its index through Presentation.Masters[index] property.
- Add an image to the slide master using IMasterSlide.Shapes.AppendEmbedImageByPath() method.
- Save the resulting presentation using Presentation.SaveToFile() method.
- Python
from spire.presentation.common import *
import math
from spire.presentation import *

inputFile = "Input1.pptx"
outputFile = "AddImageToSlideMaster.pptx"

# Create an object of the Presentation class
presentation = Presentation()
# Load a PowerPoint presentation
presentation.LoadFromFile(inputFile)

# Get the first slide master
master = presentation.Masters[0]

# Insert an image into the slide master
imageFile = "Logo.png"
rect1 = RectangleF.FromLTRB (40, 40, 80, 80)
image = master.Shapes.AppendEmbedImageByPath (ShapeType.Rectangle, imageFile, rect1)
image.Line.FillType = FillFormatType.none

# Save the resulting presentation
presentation.SaveToFile(outputFile, FileFormat.Pptx2010)
presentation.Dispose()
Apply for a Temporary License
If you'd like to remove the evaluation message from the generated documents, or to get rid of the function limitations, please request a 30-day trial license for yourself.
A page break is a formatting element used in documents to indicate the end of one page and the beginning of a new page. It is typically represented by a horizontal line or other visual indicator that separates content into different pages. This feature is commonly used when creating lengthy documents such as reports, essays, or books to enhance the overall layout and readability. In this article, you will learn how to how to insert page break into Word documents in Python using Spire.Doc for Python.
Install Spire.Doc for Python
This scenario requires Spire.Doc for Python and plum-dispatch v1.7.4. They can be easily installed in your Windows through the following pip command.
pip install Spire.Doc
If you are unsure how to install, please refer to this tutorial: How to Install Spire.Doc for Python on Windows
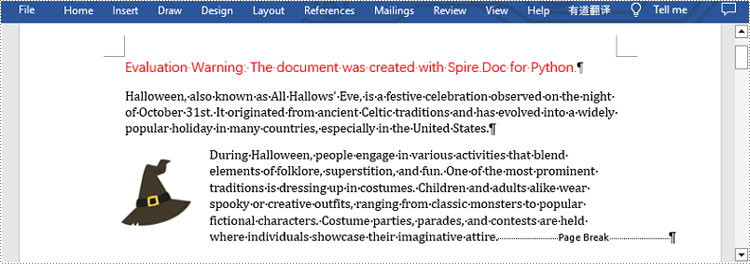
Insert Page Break after a Specific Paragraph
Spire.Doc for Python provides Paragraph.AppendBreak(BreakType.PageBreak) method to insert a page break after a specific paragraph. The following are detailed steps.
- Create an object of Document class.
- Load a sample file from disk using Document.LoadFromFile() method.
- Get the first section of this file by Document.Sections[sectionIndex] property.
- Get the second paragraph in the section by Section.Paragraphs[paragraphIndex] property.
- Insert a page break after this paragraph using Paragraph.AppendBreak(BreakType.PageBreak) method.
- Save the result file using Document.SaveToFile() method.
- Python
from spire.doc import *
from spire.doc.common import *

inputFile =  "sample.docx"
outputFile = "InsertPageBreak.docx"

#Create an object of Document class
document = Document()

#Load a sample file from disk
document.LoadFromFile(inputFile)

#Insert a page break after this paragraph
paragraph.AppendBreak(BreakType.PageBreak)

#Save the result file
document.SaveToFile(outputFile, FileFormat.Docx2013)
document.Close()
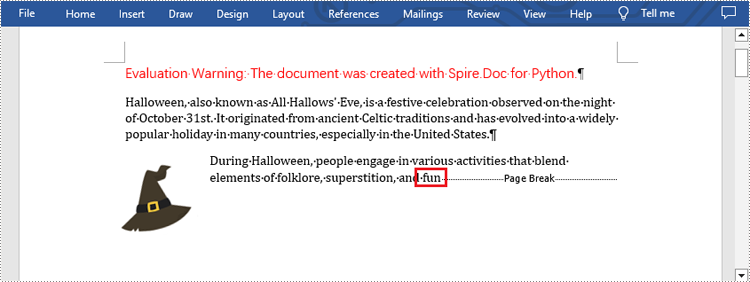
Insert Page Break after a Specific Text
What's more, you are also allowed to insert page break after a specific text by using Paragraph.ChildObjects.Insert() method provided by this library. The following are detailed steps.
- Create an object of Document class.
- Load a sample file from disk using Document.LoadFromFile() method.
- Find a specific text using Document.FindAllString() method.
- Loop through all searched text and access the text range of it by calling TextSelection.GetAsOneRange() method.
- Get the paragraph where the text range is located by ParagraphBase.OwnerParagraph property.
- Get the position index of the text range in the paragraph using Paragraph.ChildObjects.IndexOf() method.
- Create an object of Break class to create a page break.
- Insert page break after the searched text using Paragraph.ChildObjects.Insert() method.
- Save the result file using Document.SaveToFile() method.
- Python
from spire.doc import *
from spire.doc.common import *

inputFile = "sample.docx"
outputFile =  "InsertPageBreakAfterText.docx"

#Create an object of Document class
document = Document()

#Load a sample file from disk
document.LoadFromFile(inputFile)

#Find the specified text
selection = document.FindAllString("fun", True, True)

#Loop through all searched text
for ts in selection:

    #Get the text range of the searched text
    range = ts.GetAsOneRange()

    #Get the paragraph where the text range is located
    paragraph = range.OwnerParagraph

    #Get the position index of the text range in the paragraph
    index = paragraph.ChildObjects.IndexOf(range)

    #Create an object of Break class
    pageBreak = Break(document, BreakType.PageBreak)

    #Insert page break after the searched text
    paragraph.ChildObjects.Insert(index + 1, pageBreak)

#Save the result file
document.SaveToFile(outputFile, FileFormat.Docx2013)
document.Close()
Apply for a Temporary License
If you'd like to remove the evaluation message from the generated documents, or to get rid of the function limitations, please request a 30-day trial license for yourself.
