Knowledgebase (2370)
Children categories
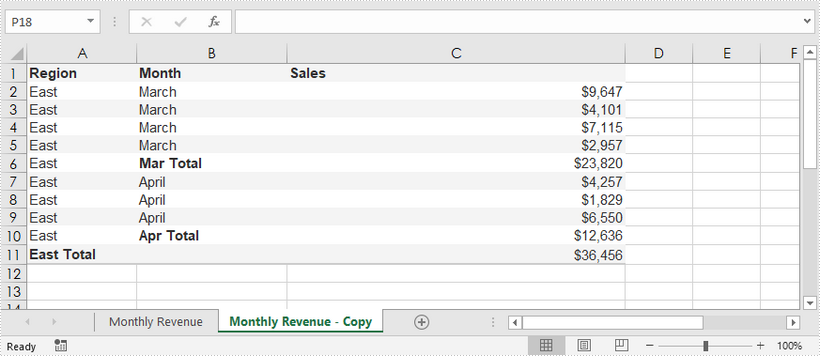
This article shows you how to duplicate a worksheet inside a workbook using Spire.XLS for Java.
import com.spire.xls.Workbook;
import com.spire.xls.Worksheet;

public class DuplicateSheetWithinWorkbook {
    public static void main(String[] args) {

        //Create a Workbook object
        Workbook workbook = new Workbook();

        //Load the sample Excel file
        workbook.loadFromFile("C:\\Users\\Administrator\\Desktop\\sample.xlsx");

        //Get the first worksheet
        Worksheet originalSheet = workbook.getWorksheets().get(0);

        //Add a new worksheet
        Worksheet newSheet = workbook.getWorksheets().add(originalSheet.getName()+" - Copy");

        //Copy the worksheet to new sheet
        newSheet.copyFrom(originalSheet);

        //Save to file
        workbook.saveToFile("DuplicateSheet.xlsx");
    }
}
A PDF portfolio allows multiple files to be assembled into a single interactive PDF container. The files in a PDF portfolio can be text documents, spreadsheets, presentations, images, videos, audio files, and more. By creating PDF portfolios, you can consolidate all of the relevant materials for a project into one unified package, making it easier to manage and distribute files. This article will demonstrate how to programmatically create a PDF portfolio and add files and folders to it using Spire.PDF for Java.
Install Spire.PDF for Java
First of all, you're required to add the Spire.Pdf.jar file as a dependency in your Java program. The JAR file can be downloaded from this link. If you use Maven, you can easily import the JAR file in your application by adding the following code to your project's pom.xml file.
<repositories>
    <repository>
        <id>com.e-iceblue</id>
        <name>e-iceblue</name>
        <url>https://repo.e-iceblue.com/nexus/content/groups/public/</url>
    </repository>
</repositories>
<dependencies>
    <dependency>
        <groupId>e-iceblue</groupId>
        <artifactId>spire.pdf</artifactId>
        <version>12.7.0</version>
    </dependency>
</dependencies>
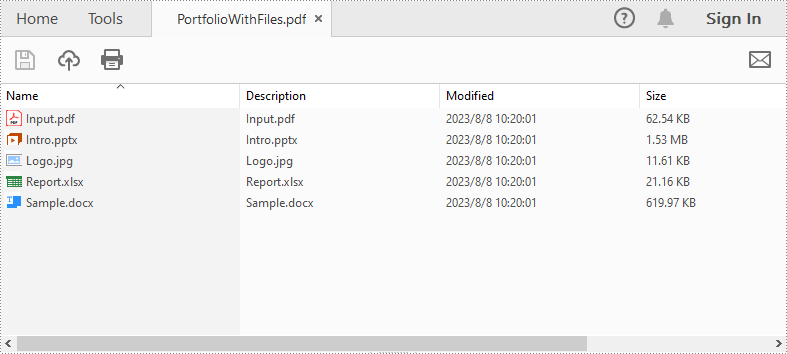
Create a PDF Portfolio and Add Files to It in Java
As a PDF portfolio is a collection of files, Spire.PDF for Java allows you to create it easily using the PdfDocument.getCollection() method. Then you can add files to the PDF portfolio using the PdfCollection.addFile() method. The detailed steps are as follows:
- Specify the files that need to be added to the PDF portfolio.
- Create a PdfDocument instance.
- Create a PDF portfolio and add files to it using PdfDocument.getCollection().addFile() method.
- Save the result file using PdfDocument.saveToFile() method.
- Java
import com.spire.pdf.FileFormat;
import com.spire.pdf.PdfDocument;

public class CreatePortfolioWithFiles {
    public static void main(String []args){

        // Specify the files
        String[] files = new String[] { "Input.pdf", "Sample.docx", "Report.xlsx","Intro.pptx","Logo.jpg" };

        //Create a PdfDocument instance
        PdfDocument pdf = new PdfDocument();

        //Create a PDF Portfolio and add files to it
        for (int i = 0; i < files.length; i++)
        {
            pdf.getCollection().addFile(files[i]);
        }

        //Save the result file
        pdf.saveToFile("PortfolioWithFiles.pdf", FileFormat.PDF);
        pdf.dispose();
    }
}
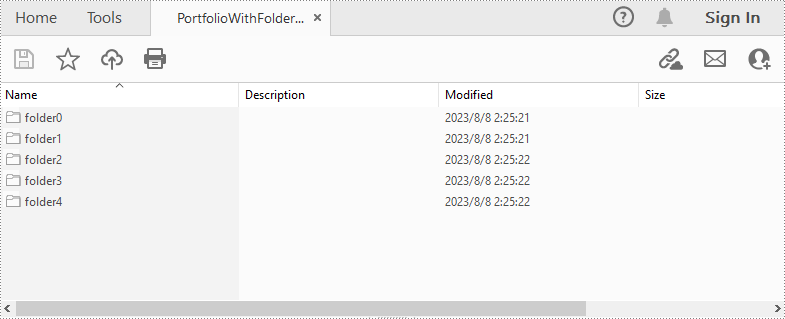
Create a PDF Portfolio and Add Folders to It in Java
After creating a PDF portfolio, Spire.PDF for Java also allows you to create folders within the PDF portfolio to further manage the files. The detailed steps are as follows:
- Specify the files that need to be added to the PDF portfolio.
- Create PdfDocument instance.
- Create a PDF portfolio using PdfDocument.getCollection() method.
- Add folders to the PDF portfolio using PdfCollection.getFolders().createSubfolder() method, and then add files to the folders using PdfFolder.addFile() method.
- Save the result file using PdfDocument.saveToFile() method.
- Java
import com.spire.pdf.FileFormat;
import com.spire.pdf.PdfDocument;
import com.spire.pdf.collections.PdfFolder;

public class CreatePortfolioWithFolders {
    public static void main(String []args){

        // Specify the files
        String[] files = new String[] { "Input.pdf", "Sample.docx", "Report.xlsx","Intro.pptx","Logo.jpg" };

        //Create a PdfDocument instance
        PdfDocument pdf = new PdfDocument();

        //Create a portfolio and add folders to it
        for (int i = 0; i < files.length; i++)
        {
            PdfFolder folder = pdf.getCollection().getFolders().createSubfolder("folder" + i);

            //Add files to the folders
            folder.addFile(files[i]);
        }

        //Save the result file
        pdf.saveToFile("PortfolioWithFolders.pdf", FileFormat.PDF);
        pdf.dispose();
    }
}
Apply for a Temporary License
If you'd like to remove the evaluation message from the generated documents, or to get rid of the function limitations, please request a 30-day trial license for yourself.
Invisiblize Textual Data When Creating Barcode&QR code in Java
2021-07-02 02:27:06 Written by KoohjiIn this tutorial, we are going to introduce how to invisiblize the textual data in the middle of creating a Barcode&QR code using Spire.Barcode for Java and its settings.setShowText(false); method.
Invisiblize the Textual Data When Creating a Barcode
import com.spire.barcode.BarCodeGenerator;
import com.spire.barcode.BarCodeType;
import com.spire.barcode.BarcodeSettings;

import javax.imageio.ImageIO;
import java.awt.*;
import java.awt.image.BufferedImage;
import java.io.File;
import java.io.IOException;

public class CreateBarcode {
    public static void main(String[] args) throws IOException {
        BarcodeSettings settings = new BarcodeSettings();//Instantiate BarcodeSettings object
        settings.setType(BarCodeType.Codabar);//Set the Barcode type
        settings.setData("123456789");//Set the Barcode data
        settings.setShowText(false);//Make the textual data invisible
        settings.setShowTextOnBottom(true);//Make the textual data visible at the bottom of the Barcode
        settings.setX(0.8f);//Set width for the black and white stripes
        settings.setImageHeight(50);//Set height for the created Barcode image
        settings.setImageWidth(70);//Set width for the created Barcode image
        settings.hasBorder(true);//Make the border visible
        settings.setBorderColor(new Color(135,206,250));//Set the border color
        settings.setBorderWidth(1);//Set the border width
        settings.setBackColor(new Color(240,255,255));//Set background color for the Barcode

        BarCodeGenerator barCodeGenerator = new BarCodeGenerator(settings);//Instantiage BarCodeGenerator object
        BufferedImage bufferedImage = barCodeGenerator.generateImage();//Generate image data based on settings and save it to BufferedImage instance
        ImageIO.write(bufferedImage, "png", new File("Codabar.png"));//Save the Barcode as PNG
    }
}
Output

Invisiblize the Textual Data When Creating a QR code
import com.spire.barcode.*;

import javax.imageio.ImageIO;
import java.awt.image.BufferedImage;
import java.io.File;
import java.io.IOException;

public class CreateQR {
    public static void main(String[] args) throws IOException {

               BarcodeSettings settings = new BarcodeSettings();//Instantiate BarcodeSettings object
        settings.setType(BarCodeType.QR_Code);//Set Barcode type as QR code
        settings.setData("Hello 123456789");//Set the data
        settings.setShowText(false);// Make the textual data invisible
        settings.setQRCodeDataMode(QRCodeDataMode.Alpha_Number);//Set data mode
        settings.setImageWidth(50);// Set widthfor the created QR code image
        settings.setImageHeight(50);// Set height for the created QR code image
        settings.setX(3.0f);//Set width for QR code model
        settings.setQRCodeECL(QRCodeECL.H);//Set QR code ECL
        settings.hasBorder(false);//make the border invisible

        BarCodeGenerator barCodeGenerator = new BarCodeGenerator(settings);//Instantiage BarCodeGenerator object

        BufferedImage bufferedImage = barCodeGenerator.generateImage();//Generate image data based on settings and save it to BufferedImage instance
        ImageIO.write(bufferedImage, "png", new File("QRCode.png"));//Save the QR code as PNG
    }
}
Output