A chart makes the trend behind one set of numbers visible, but it is far less good at showing the trends behind dozens of sets at once. Sparklines are built for exactly that: each one compresses a trend into a single cell, with no axes and no legend, so a whole column of trends can be taken in at a glance. Give every region's quarterly sales figures their own sparkline and you can see which row is climbing and which one turned back long before you could read it out of a column of numbers. Spire.XLS for JavaScript performs this directly in the browser through WebAssembly, managing input and output files with a virtual file system (VFS) and requiring no backend service.
This article covers three feature points:
- Add line sparklines
- Add column sparklines and highlight the high and low points
- Clear sparklines from a worksheet
For installation and project setup, see Integrating Spire.XLS for JavaScript in a React Project. The examples below assume Spire.XLS is installed and the WebAssembly module has been initialized.
Add Line Sparklines
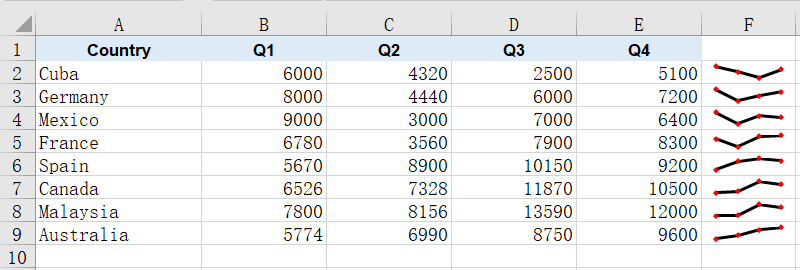
A line sparkline joins a row of values in order into a single thin line, making the rise and fall of the trend immediately readable. It occupies no cell of its own and hides none of the numbers underneath, so a single narrow column can carry the trends of dozens of rows at once, and which one is climbing and which one turned back is there at a glance. A sparkline cannot exist outside a sparkline group, and the group decides the type, colors and marker settings shared by the whole batch. The steps are:
- Load the font and the sample data file into the VFS.
- Load the workbook and get the first worksheet.
- Create a line sparkline group with
SparklineGroups.AddGroup()and set the line weight and marker color. - Get the group's sparkline collection with
Add()and add one sparkline per data row in column F. - Save the workbook.
The following is the complete code example, showing how to add line sparklines to Excel data in React:
function App() {
  const addLineSparkline = async () => {
    // Get the Spire.XLS WASM module
    const xlsModule = window.wasmModule?.spirexls;

    // Check if the module is ready
    if (!xlsModule) {
      alert('Spire.Xls is not ready yet');
      return;
    }

    // Load the font and the sample data file into the VFS
    await window.spire.FetchFileToVFS('ARIAL.TTF', '/Library/Fonts/', `${process.env.PUBLIC_URL}/font/`);
    const inputFileName = 'SparklineData.xlsx';
    await window.spire.FetchFileToVFS(inputFileName, '', `${process.env.PUBLIC_URL}data/`);

    // Load the workbook and get the first worksheet
    const workbook = new xlsModule.Workbook();
    workbook.LoadFromFile({ fileName: inputFileName });
    const sheet = workbook.Worksheets.get(0);

    // Create a line sparkline group on the worksheet
    const sparklineGroup = sheet.SparklineGroups.AddGroup({ sparklineType: xlsModule.SparklineType.Line });

    // Style the line: thicker stroke and visible data point markers
    sparklineGroup.LineWeight = 1.5;
    sparklineGroup.ShowMarkers = true;
    sparklineGroup.MarkersColor = xlsModule.Color.get_Red();

    // Get the sparkline collection of the group
    const sparklines = sparklineGroup.Add();

    // Add one sparkline per data row in column F
    for (let row = 2; row <= 9; row++) {
      sparklines.Add({
        dataRange: sheet.Range.get(`B${row}:E${row}`),
        referenceRange: sheet.Range.get(`F${row}`),
      });
    }

    // Save the workbook
    const outputFileName = 'AddLineSparkline.xlsx';
    workbook.SaveToFile({ fileName: outputFileName });

    // Dispose of the workbook object to free resources
    workbook.Dispose();

    // Read the result file from the VFS and trigger the download
    const fileArray = window.dotnetRuntime.Module.FS.readFile(outputFileName);
    const blob = new Blob([fileArray], { type: 'application/vnd.openxmlformats-officedocument.spreadsheetml.sheet' });
    const url = URL.createObjectURL(blob);
    const a = document.createElement('a');
    a.href = url;
    a.download = outputFileName;
    a.click();
    URL.revokeObjectURL(url);
  };

  return (
    <div style={{ textAlign: 'center', height: '300px' }}>
      <h1>Line Sparkline</h1>
      <button onClick={addLineSparkline}>Start</button>
    </div>
  );
}

export default App;
After running, the effect of adding line sparklines:
Add Column Sparklines and Highlight the High and Low Points
A column sparkline represents values as a row of thin bars, which reads more directly than a line when you are comparing several numbers within the same row. It works the same way as the line sparkline, except that the color lands on each bar itself rather than on a connecting stroke.
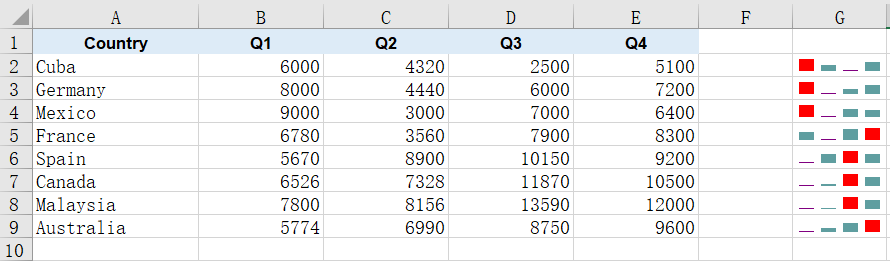
What really makes column sparklines useful is the high and low point markers: the strongest and the weakest quarter in each row are picked out and colored on their own, so you no longer have to compare the numbers by eye to see where a row peaked and where it fell away. The steps are:
- Load the font and the sample data file into the VFS.
- Load the workbook and get the first worksheet.
- Create a column sparkline group with
SparklineGroups.AddGroup()(passingSparklineType.Column) and set the series color withSparklineColor. - Turn on
ShowHighPointandShowLowPoint, and give each its own color withHighPointColorandLowPointColor. - Get the group's sparkline collection with
Add(), add one sparkline per data row in column G and save the workbook.
The following is the complete code example, showing how to add column sparklines to Excel data and highlight the high and low points in React:
function App() {
  const addColumnSparkline = async () => {
    // Get the Spire.XLS WASM module
    const xlsModule = window.wasmModule?.spirexls;

    // Check if the module is ready
    if (!xlsModule) {
      alert('Spire.Xls is not ready yet');
      return;
    }

    // Load the font and the sample data file into the VFS
    await window.spire.FetchFileToVFS('ARIAL.TTF', '/Library/Fonts/', `${process.env.PUBLIC_URL}/font/`);
    const inputFileName = 'SparklineData.xlsx';
    await window.spire.FetchFileToVFS(inputFileName, '', `${process.env.PUBLIC_URL}data/`);

    // Load the workbook and get the first worksheet
    const workbook = new xlsModule.Workbook();
    workbook.LoadFromFile({ fileName: inputFileName });
    const sheet = workbook.Worksheets.get(0);

    // Create a column sparkline group
    const sparklineGroup = sheet.SparklineGroups.AddGroup({ sparklineType: xlsModule.SparklineType.Column });

    // Set the color of the sparkline itself
    sparklineGroup.SparklineColor = xlsModule.Color.get_CadetBlue();

    // Turn on the high and low point markers and give each its own color
    sparklineGroup.ShowHighPoint = true;
    sparklineGroup.HighPointColor = xlsModule.Color.get_Red();
    sparklineGroup.ShowLowPoint = true;
    sparklineGroup.LowPointColor = xlsModule.Color.get_Purple();

    const sparklines = sparklineGroup.Add();

    // Add one sparkline per data row in column G
    for (let row = 2; row <= 9; row++) {
      sparklines.Add({
        dataRange: sheet.Range.get(`B${row}:E${row}`),
        referenceRange: sheet.Range.get(`G${row}`),
      });
    }

    // Save the workbook
    const outputFileName = 'AddColumnSparkline.xlsx';
    workbook.SaveToFile({ fileName: outputFileName });

    // Dispose of the workbook object to free resources
    workbook.Dispose();

    // Read the result file from the VFS and trigger the download
    const fileArray = window.dotnetRuntime.Module.FS.readFile(outputFileName);
    const blob = new Blob([fileArray], { type: 'application/vnd.openxmlformats-officedocument.spreadsheetml.sheet' });
    const url = URL.createObjectURL(blob);
    const a = document.createElement('a');
    a.href = url;
    a.download = outputFileName;
    a.click();
    URL.revokeObjectURL(url);
  };

  return (
    <div style={{ textAlign: 'center', height: '300px' }}>
      <h1>Column Sparkline</h1>
      <button onClick={addColumnSparkline}>Start</button>
    </div>
  );
}

export default App;
After running, the effect of adding column sparklines and highlighting the high and low points:
Clear Sparklines from a Worksheet
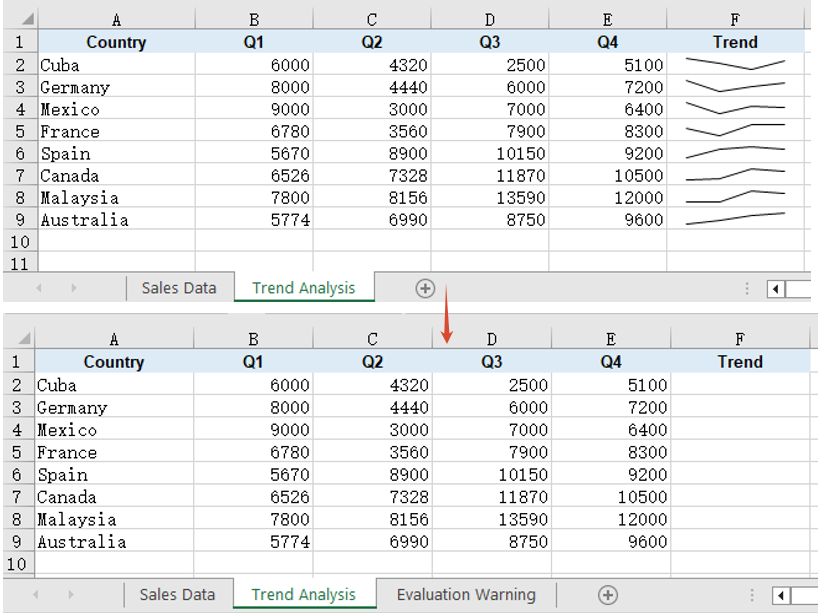
When a report is revised or the figures are restated, the sparklines drawn beside the old numbers may no longer apply and need to be removed and drawn again. Sparkline groups are held by the worksheet, and once they are gone the cells return to their ordinary state, with their data and other formatting untouched. The steps are:
- Load the font and the sample data file into the VFS.
- Load the workbook and get the second worksheet, which already carries a line sparkline group.
- Clear all sparkline groups on that worksheet with
SparklineGroups.Clear(). - Save the workbook.
The following is the complete code example, showing how to clear sparklines from a worksheet in React:
function App() {
  const clearSparklines = async () => {
    // Get the Spire.XLS WASM module
    const xlsModule = window.wasmModule?.spirexls;

    // Check if the module is ready
    if (!xlsModule) {
      alert('Spire.Xls is not ready yet');
      return;
    }

    // Load the font and the sample data file into the VFS
    await window.spire.FetchFileToVFS('ARIAL.TTF', '/Library/Fonts/', `${process.env.PUBLIC_URL}/font/`);
    const inputFileName = 'SparklineData.xlsx';
    await window.spire.FetchFileToVFS(inputFileName, '', `${process.env.PUBLIC_URL}data/`);

    // Load the workbook and get the second worksheet
    const workbook = new xlsModule.Workbook();
    workbook.LoadFromFile({ fileName: inputFileName });
    const sheet = workbook.Worksheets.get(1);

    // Clear all sparkline groups on that worksheet
    sheet.SparklineGroups.Clear();

    // Save the workbook
    const outputFileName = 'ClearSparklines.xlsx';
    workbook.SaveToFile({ fileName: outputFileName });

    // Dispose of the workbook object to free resources
    workbook.Dispose();

    // Read the result file from the VFS and trigger the download
    const fileArray = window.dotnetRuntime.Module.FS.readFile(outputFileName);
    const blob = new Blob([fileArray], { type: 'application/vnd.openxmlformats-officedocument.spreadsheetml.sheet' });
    const url = URL.createObjectURL(blob);
    const a = document.createElement('a');
    a.href = url;
    a.download = outputFileName;
    a.click();
    URL.revokeObjectURL(url);
  };

  return (
    <div style={{ textAlign: 'center', height: '300px' }}>
      <h1>Clear Sparklines</h1>
      <button onClick={clearSparklines}>Start</button>
    </div>
  );
}

export default App;
After running, the effect of clearing sparklines from a worksheet:
FAQ
Reading the cells back does not show the sparklines
Cause: A sparkline is not cell content. It belongs to a sparkline group on the worksheet and is drawn over its anchor cell, while its data and settings are written into the worksheet's extension block, so walking the cells returns an empty value for the anchor column and no cell-level call can tell you whether a sparkline is there.
Solution: Read it from the worksheet-level SparklineGroups instead. get_Item(0) returns the first group, and its SparklineType tells you whether the batch is a line or a column one; the color settings are read from the same place:
const group = sheet.SparklineGroups.get_Item(0);
console.log(group.SparklineType);   // SparklineType.Line or SparklineType.Column
Setting the line weight and markers on a column sparkline has no effect
Cause: LineWeight and ShowMarkers apply to line sparklines only. A column sparkline represents values as bars, so it has neither a connecting stroke nor data point markers, and although the assignment succeeds, neither property is written to the result file.
Solution: If you need a stroke and markers, create the sparkline group as a line type and set them there:
const sparklineGroup = sheet.SparklineGroups.AddGroup({ sparklineType: xlsModule.SparklineType.Line });
sparklineGroup.LineWeight = 1.5;
sparklineGroup.ShowMarkers = true;
sparklineGroup.MarkersColor = xlsModule.Color.get_Red();
Get a Free License
Spire.XLS for JavaScript offers a 30-day full-featured free trial license with no functional limitations. Apply here to evaluate before purchasing.
