A pivot chart is a graphical representation of the summarized results of a pivot table, making data comparisons and trends immediately visible. It is an essential tool for data analysis and report presentation. Spire.XLS for JavaScript runs entirely in the browser via WebAssembly, using a virtual file system (VFS) to manage input and output files — no backend server required. It provides a complete API for creating pivot charts based on pivot tables, controlling the display of pivot chart field buttons, and customizing the appearance of pivot chart series.
This article covers three core features:
- Create a Pivot Chart in Excel
- Show or Hide Field Buttons of an Excel Pivot Chart
- Set the Format of Excel Pivot Chart Series
For installation and project setup, refer to Integrating Spire.XLS for JavaScript in a React Project. The examples below assume Spire.XLS is installed and the WebAssembly module is initialized.
Create a Pivot Chart in Excel
A pivot chart must be created based on a pivot table. With Spire.XLS for JavaScript, you can first create a pivot table in a worksheet, and then use the Charts.Add() method with the pivotChartType and pivotTable parameters to generate a corresponding pivot chart directly from the pivot table. The steps are as follows:
- Create a
Workbookobject and get the default worksheet. - Populate the worksheet with the source data required for the pivot table.
- Create a pivot table cache using
PivotCaches.Add(). - Add a pivot table using
PivotTables.Add(), and drag fields to the row area and the data area. - Add a chart using
sheet.Charts.Add(), and create a pivot chart based on the pivot table via thepivotChartTypeandpivotTableparameters. - Set the position and title of the pivot chart.
- Save the workbook to an Excel file using
SaveToFile().
Below is a complete code example demonstrating how to create a pivot chart based on a pivot table in React:
function App() {
  const createPivotChart = async () => {
    // Get the Spire.XLS WASM module
    const xlsModule = window.wasmModule?.spirexls;

    // Check if the module is ready
    if (!xlsModule) {
      alert('Spire.Xls is not ready yet');
      return;
    }

    // Load the font into the virtual file system (VFS)
    await window.spire.FetchFileToVFS('ARIAL.TTF', '/Library/Fonts/', `${process.env.PUBLIC_URL}/font/`);

    // Create a new workbook and get the default worksheet
    const workbook = new xlsModule.Workbook();
    let sheet = workbook.Worksheets.get(0);

    // Populate the source data for the pivot table
    sheet.Range.get('A1').Value = 'Product';
    sheet.Range.get('B1').Value = 'Month';
    sheet.Range.get('C1').Value = 'Sales';

    sheet.Range.get('A2').Value = 'Apple';
    sheet.Range.get('A3').Value = 'Apple';
    sheet.Range.get('A4').Value = 'Banana';
    sheet.Range.get('A5').Value = 'Apple';
    sheet.Range.get('A6').Value = 'Banana';
    sheet.Range.get('A7').Value = 'Banana';

    sheet.Range.get('B2').Value = 'January';
    sheet.Range.get('B3').Value = 'February';
    sheet.Range.get('B4').Value = 'January';
    sheet.Range.get('B5').Value = 'January';
    sheet.Range.get('B6').Value = 'February';
    sheet.Range.get('B7').Value = 'February';

    sheet.Range.get('C2').Value = '10';
    sheet.Range.get('C3').Value = '15';
    sheet.Range.get('C4').Value = '9';
    sheet.Range.get('C5').Value = '7';
    sheet.Range.get('C6').Value = '8';
    sheet.Range.get('C7').Value = '10';

    // Create a pivot table
    let dataRange = sheet.Range.get('A1:C7');
    let cache = workbook.PivotCaches.Add({ range: dataRange });
    let pivotTable = sheet.PivotTables.Add('Pivot Table', sheet.Range.get({ row: 1, column: 5 }), cache);

    // Drag fields to the row area
    let pf = pivotTable.PivotFields.get_Item('Product');
    pf.Axis = xlsModule.AxisTypes.Row;
    let pf2 = pivotTable.PivotFields.get_Item('Month');
    pf2.Axis = xlsModule.AxisTypes.Row;

    // Drag a field to the data area
    pivotTable.DataFields.Add(pivotTable.PivotFields.get_Item('Sales'), 'Sum of Sales', xlsModule.SubtotalTypes.Sum);

    // Set the pivot table style and calculate the data
    pivotTable.BuiltInStyle = xlsModule.PivotBuiltInStyles.PivotStyleMedium12;
    pivotTable.CalculateData();

    // Create a clustered column chart based on the pivot table
    let chart = sheet.Charts.Add({ pivotChartType: xlsModule.ExcelChartType.ColumnClustered, pivotTable: pivotTable });
    // Set the pivot chart position
    chart.TopRow = 9;
    chart.LeftColumn = 1;
    chart.RightColumn = 9;
    chart.BottomRow = 25;
    // Set the pivot chart title
    chart.ChartTitle = "Pivot Chart";

    // Save the workbook
    const outputFileName = 'PivotChart.xlsx';
    workbook.SaveToFile(outputFileName);
    workbook.Dispose();

    // Read the file from VFS and trigger download
    const fileArray = window.dotnetRuntime.Module.FS.readFile(outputFileName);
    const blob = new Blob([fileArray], { type: 'application/vnd.openxmlformats-officedocument.spreadsheetml.sheet' });
    const url = URL.createObjectURL(blob);
    const a = document.createElement('a');
    a.href = url;
    a.download = outputFileName;
    a.click();
    URL.revokeObjectURL(url);
  };

  return (
    <div style={{ textAlign: 'center', height: '300px' }}>
      <h1>Create Pivot Chart</h1>
      <button onClick={createPivotChart}>
        Generate
      </button>
    </div>
  );
}

export default App;
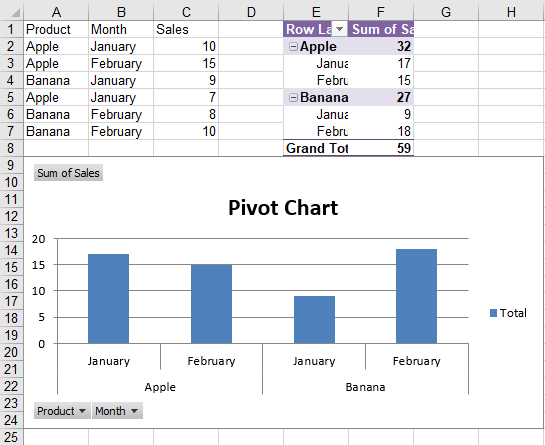
Pivot chart created in Excel with Spire.XLS for JavaScript
Show or Hide Field Buttons of an Excel Pivot Chart
By default, a pivot chart displays field buttons, allowing users to interactively filter and switch field data. When generating reports, you may want to hide some or all of the field buttons to make the chart cleaner. Spire.XLS for JavaScript provides properties such as DisplayEntireFieldButtons, DisplayValueFieldButtons, DisplayAxisFieldButtons, DisplayLegendFieldButtons, and ShowReportFilterFieldButtons to flexibly control the display of each type of field button. The steps are as follows:
- Create a
Workbookobject and load an existing Excel file containing a pivot chart. - Get the worksheet via
workbook.Worksheets.get(). - Get the pivot chart object using
sheet.Charts.get(). - Control whether to display all field buttons via
DisplayEntireFieldButtons. - Control the display of each type of field button via
DisplayValueFieldButtons,DisplayAxisFieldButtons,DisplayLegendFieldButtons, andShowReportFilterFieldButtons. - Save the workbook to an Excel file using
SaveToFile().
Below is a complete code example demonstrating how to show or hide pivot chart field buttons in React (the example loads the PivotChart.xlsx file generated in the previous section):
function App() {
  const showHideFieldButtons = async () => {
    // Get the Spire.XLS WASM module
    const xlsModule = window.wasmModule?.spirexls;

    // Check if the module is ready
    if (!xlsModule) {
      alert('Spire.Xls is not ready yet');
      return;
    }

    // Load the sample file containing a pivot chart into the virtual file system (VFS)
    let excelFileName = 'PivotChart.xlsx';
    await window.spire.FetchFileToVFS(excelFileName, '', `${process.env.PUBLIC_URL}data/`);

    // Create a workbook object and load the existing file
    const workbook = new xlsModule.Workbook();
    workbook.LoadFromFile({ fileName: excelFileName });

    // Get the first worksheet
    let sheet = workbook.Worksheets.get(0);

    // Get the pivot chart
    let chart = sheet.Charts.get(0);

    // Control the display of all field buttons
    chart.DisplayEntireFieldButtons = true;

    // Hide the value field buttons
    chart.DisplayValueFieldButtons = false;
    // Hide the axis field buttons
    chart.DisplayAxisFieldButtons = false;
    // Hide the legend field buttons
    //chart.DisplayLegendFieldButtons = false;
    // Show the report filter field buttons
    //chart.ShowReportFilterFieldButtons = true;

    // Save the workbook
    const outputFileName = 'PivotChartFieldButtons.xlsx';
    workbook.SaveToFile(outputFileName);
    workbook.Dispose();

    // Read the file from VFS and trigger download
    const fileArray = window.dotnetRuntime.Module.FS.readFile(outputFileName);
    const blob = new Blob([fileArray], { type: 'application/vnd.openxmlformats-officedocument.spreadsheetml.sheet' });
    const url = URL.createObjectURL(blob);
    const a = document.createElement('a');
    a.href = url;
    a.download = outputFileName;
    a.click();
    URL.revokeObjectURL(url);
  };

  return (
    <div style={{ textAlign: 'center', height: '300px' }}>
      <h1>Show/Hide PivotChart Field Buttons</h1>
      <button onClick={showHideFieldButtons}>
        Generate
      </button>
    </div>
  );
}

export default App;
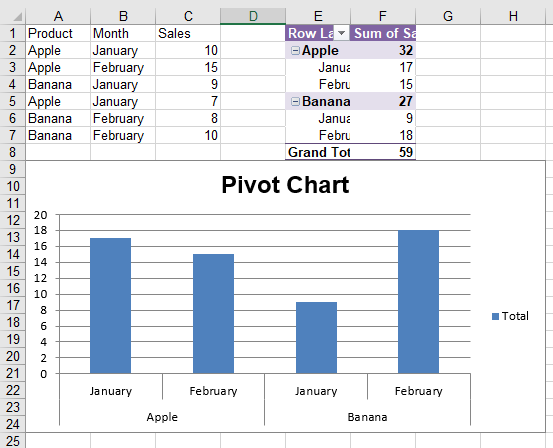
Pivot chart field buttons shown or hidden with Spire.XLS for JavaScript
Set the Format of Excel Pivot Chart Series
Formatting the series of a pivot chart can make the chart more visually appealing and clearly organized, conveying data information more effectively. With Spire.XLS for JavaScript, you can load an Excel file containing a pivot chart, get the pivot chart via the Charts.get() method, then set fill types, colors, and border styles via the series' DataFormat property, and set formats such as the gap width of the data bars via the format object returned by the GetCommonSerieFormat() method. The steps are as follows:
- Create a
Workbookobject. - Load an Excel file containing a pivot chart using the
LoadFromFile()method. - Get a specific worksheet in the Excel file using the
Worksheets.get()method. - Get the pivot chart in the worksheet using the
Charts.get()method. - Set the position and title of the pivot chart.
- Get the data series of the pivot chart using the
Series.get()method. - Set fill types, colors, and border styles via the
DataFormatproperty, and set formats such as the gap width of the data bars via theGetCommonSerieFormat()method. - Save the generated file using the
SaveToFile()method.
Below is a complete code example demonstrating how to set the format of pivot chart series in React (the example loads the PivotChart.xlsx file containing a pivot chart generated in the previous section):
function App() {
  const formatPivotChartSeries = async () => {
    // Get the Spire.XLS WASM module
    const xlsModule = window.wasmModule?.spirexls;

    // Check if the module is ready
    if (!xlsModule) {
      alert('Spire.Xls is not ready yet');
      return;
    }

    // Load the sample file containing a pivot table into the virtual file system (VFS)
    let excelFileName = 'PivotChart.xlsx';
    await window.spire.FetchFileToVFS(excelFileName, '', `${process.env.PUBLIC_URL}data/`);

    // Create a Workbook object
    const workbook = new xlsModule.Workbook();
    // Load the Excel file
    workbook.LoadFromFile({ fileName: excelFileName });

    // Get the first worksheet
    let sheet = workbook.Worksheets.get(0);

    // Get the pivot chart
    let chart = sheet.Charts.get(0);

    // Set the pivot chart position
    chart.TopRow = 1;
    chart.LeftColumn = 8;
    chart.RightColumn = 18;
    chart.BottomRow = 15;

    // Set the chart title
    chart.ChartTitle = "";

    // Add a series to the pivot chart
    let series = chart.Series.get(0);

    // Set the gap width of the data bars
    series.GetCommonSerieFormat().GapWidth = 10;
    // series.GetCommonSerieFormat().Overlap = 100;

    // Set the fill type, foreground color, and background color of the series
    series.DataFormat.Fill.FillType = xlsModule.ShapeFillType.SolidColor;
    series.DataFormat.ForeGroundColor = xlsModule.Color.get_Red();
    series.DataFormat.BackGroundColor = xlsModule.Color.get_White();

    // Set the border color, line style, and line weight of the series
    series.DataFormat.LineProperties.Pattern = xlsModule.ChartLinePatternType.Solid;
    series.DataFormat.LineProperties.Color = xlsModule.Color.get_Blue();
    series.DataFormat.LineProperties.CustomLineWeight = 2.5;

    // Add a shadow effect to the series
    series.DataFormat.IsShadow = true;

    // Save the workbook
    const outputFileName = 'PivotChartSeriesFormat.xlsx';
    workbook.SaveToFile(outputFileName);
    workbook.Dispose();

    // Read the file from VFS and trigger download
    const fileArray = window.dotnetRuntime.Module.FS.readFile(outputFileName);
    const blob = new Blob([fileArray], { type: 'application/vnd.openxmlformats-officedocument.spreadsheetml.sheet' });
    const url = URL.createObjectURL(blob);
    const a = document.createElement('a');
    a.href = url;
    a.download = outputFileName;
    a.click();
    URL.revokeObjectURL(url);
  };

  return (
    <div style={{ textAlign: 'center', height: '300px' }}>
      <h1>Format PivotChart Series</h1>
      <button onClick={formatPivotChartSeries}>
        Generate
      </button>
    </div>
  );
}

export default App;
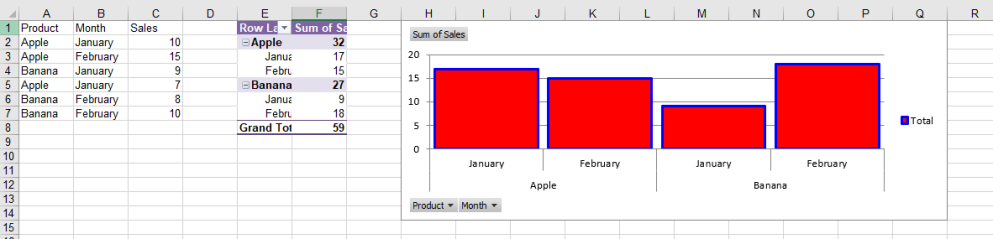
Pivot chart series format set with Spire.XLS for JavaScript
FAQ
How to refresh a pivot chart to show the latest data?
Cause: A pivot chart is created based on a pivot table. After modifying the data source of the pivot table, the chart does not automatically sync the updates.
Solution: After modifying the data source, use the Cache.IsRefreshOnLoad property to make the pivot table refresh automatically when the file opens, so the pivot chart is updated accordingly:
// Get the pivot table
let pivotTable = sheet.PivotTables.get(0);
// Refresh the pivot table automatically when the file opens
pivotTable.Cache.IsRefreshOnLoad = true;
Why does my pivot chart not show any data?
Cause: The series of a pivot chart come from the summarized results of a pivot table. If the pivot table has not been calculated, or the pivot chart was not correctly associated with the pivot table, the chart may appear blank.
Solution: Call the CalculateData() method after creating the pivot table to calculate the results, and correctly associate the pivot table via the pivotTable parameter when creating the pivot chart:
// Calculate the data of the pivot table
pivotTable.CalculateData();

// Create a pivot chart based on the pivot table
let chart = sheet.Charts.Add({ pivotChartType: xlsModule.ExcelChartType.ColumnClustered, pivotTable: pivotTable });
Get a Free License
Spire.XLS for JavaScript offers a 30-day full-featured free trial license with no functional limitations. Apply here to evaluate before purchasing.
