Worksheet data is rarely a tidy rectangle. Detail rows are interrupted by subtotal lines, group headings and notes, and the chart is meant to draw the detail alone; other numbers never reach a cell at all, because they come back from an API, are computed in code, or are simply a set of targets for this one report. Both cases defeat the usual routine of selecting a block and inserting a chart. Spire.XLS for JavaScript does this in the browser on top of WebAssembly, managing input and output files through a virtual file system (VFS), with no backend service required.
This article covers two key features:
For installation and project setup, see Integrating Spire.XLS for JavaScript in a React Project. The examples below assume Spire.XLS is installed and the WebAssembly module has been initialised.
Create a chart from a discontinuous data source
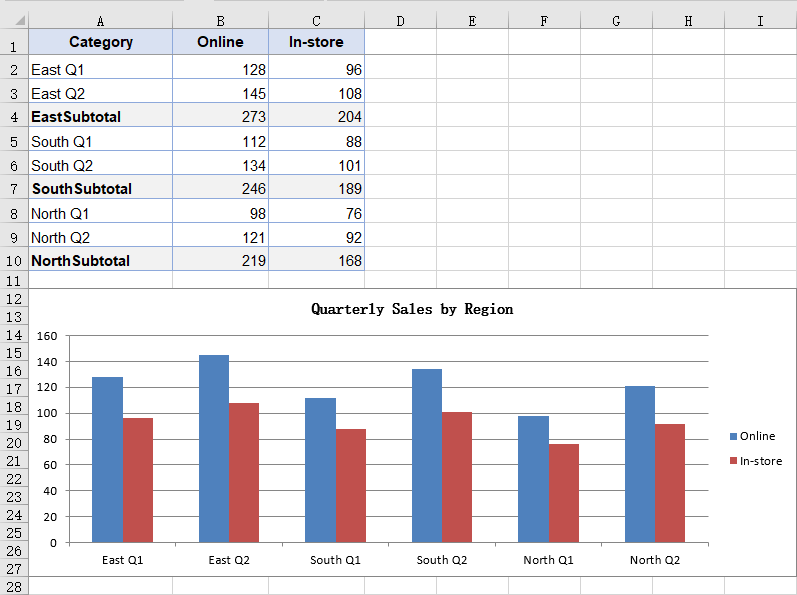
Subtotal rows, group headings and notes all cut a table of details into several blocks. Selecting the whole column and inserting a chart makes no distinction between them and the detail rows, so they are drawn as columns too: in the sample data a subtotal follows every two quarters, and reading the whole column turns six columns into nine and roughly doubles the height of every region. A series can be given its data as several non-adjacent blocks joined into a single reference, so the chart takes only the rows inside those blocks and skips over the rest. The table then needs no rearranging for the sake of the chart, and the subtotal rows can stay where they are. The steps are:
- Load the font and the test data file into the VFS.
- Load the workbook with
workbook.LoadFromFileand get the first worksheet withworkbook.Worksheets.get(0). - Add a column chart with
sheet.Charts.Addand setchart.SeriesDataFromRangetofalse, declaring that the series data is supplied block by block in code rather than taken fromchart.DataRange. - Add a series with
chart.Series.Addand setserie.Nameto theValueof the header cell. - Take each region's quarter rows with
Range.getand join them withAddCombinedRange, producing one reference for the category labels and one for the values. - Repeat the same joins for the second series so both share the same category labels, then save the workbook.
The complete code example below shows how to create a chart from a discontinuous data source in React:
function App() {
  const chartFromDiscontinuousData = async () => {
    // Get the Spire.XLS WASM module
    const xlsModule = window.wasmModule?.spirexls;

    // Check that the module is ready
    if (!xlsModule) {
      alert('Spire.Xls is not ready yet');
      return;
    }

    // Load the font and the sample workbook into the VFS
    await window.spire.FetchFileToVFS('ARIAL.TTF', '/Library/Fonts/', `${process.env.PUBLIC_URL}/font/`);
    const inputFileName = 'ChartSourceData.xlsx';
    await window.spire.FetchFileToVFS(inputFileName, '', `${process.env.PUBLIC_URL}data/`);

    // Load the workbook and get the first worksheet
    const workbook = new xlsModule.Workbook();
    workbook.LoadFromFile({ fileName: inputFileName });
    const sheet = workbook.Worksheets.get(0);

    // Add a column chart; the series data is given block by block in code, not as one range
    const chart = sheet.Charts.Add({ chartType: xlsModule.ExcelChartType.ColumnClustered });
    chart.ChartTitle = "Quarterly Sales by Region";
    chart.ChartTitleArea.Size = 12;
    chart.SeriesDataFromRange = false;

    // Place the chart on the worksheet
    chart.TopRow = 12;
    chart.BottomRow = 28;
    chart.LeftColumn = 1;
    chart.RightColumn = 10;

    // Join the three regions' quarter rows into one reference, skipping the subtotal rows
    const categoryLabels = sheet.Range.get("A2:A3")
      .AddCombinedRange(sheet.Range.get("A5:A6"))
      .AddCombinedRange(sheet.Range.get("A8:A9"));

    // Online series: the name comes from the header, the values are joined the same way
    const onlineSerie = chart.Series.Add();
    onlineSerie.Name = sheet.Range.get("B1").Value;
    onlineSerie.CategoryLabels = categoryLabels;
    onlineSerie.Values = sheet.Range.get("B2:B3")
      .AddCombinedRange(sheet.Range.get("B5:B6"))
      .AddCombinedRange(sheet.Range.get("B8:B9"));

    // In-store series: it shares the same category labels
    const storeSerie = chart.Series.Add();
    storeSerie.Name = sheet.Range.get("C1").Value;
    storeSerie.CategoryLabels = categoryLabels;
    storeSerie.Values = sheet.Range.get("C2:C3")
      .AddCombinedRange(sheet.Range.get("C5:C6"))
      .AddCombinedRange(sheet.Range.get("C8:C9"));

    // Save the workbook
    const outputFileName = "DiscontinuousData.xlsx";
    workbook.SaveToFile({ fileName: outputFileName });

    // Dispose of the workbook object to free resources
    workbook.Dispose();

    // Read the result file from the VFS and trigger the download
    const fileArray = window.dotnetRuntime.Module.FS.readFile(outputFileName);
    const blob = new Blob([fileArray], { type: 'application/vnd.openxmlformats-officedocument.spreadsheetml.sheet' });
    const url = URL.createObjectURL(blob);
    const a = document.createElement('a');
    a.href = url;
    a.download = outputFileName;
    a.click();
    URL.revokeObjectURL(url);
  };

  return (
    <div style={{ textAlign: 'center', height: '300px' }}>
      <h1>Discontinuous Data Chart</h1>
      <button id="discontinuous-data" onClick={chartFromDiscontinuousData}>Create a chart from a discontinuous source</button>
    </div>
  );
}

export default App;
After running, the chart created from a discontinuous data source:
Create a chart without a data source
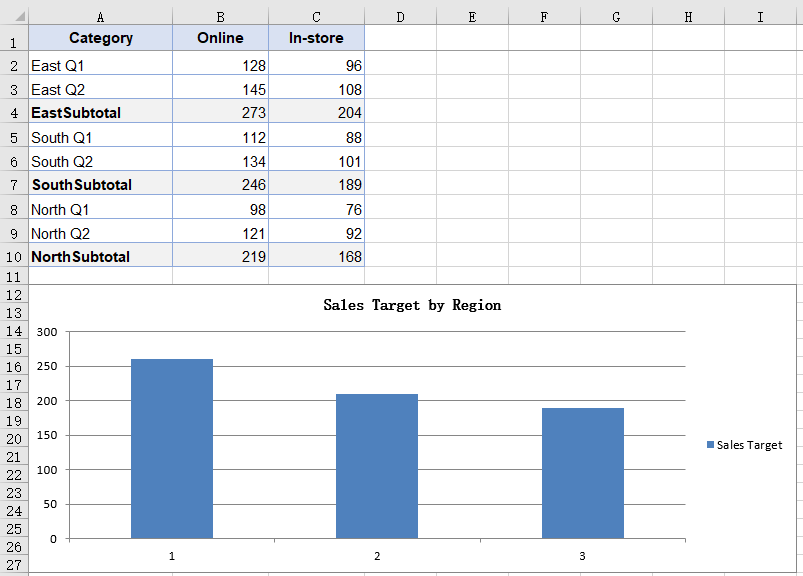
A chart normally takes its data from cells, but not always: a target may live in a configuration file, a summary figure may come back from an API, or the numbers may just be a set of constants for a demonstration. None of them has landed in the worksheet, so there is no range for the chart to point at. A series can carry its values inside itself instead, which lets the chart stand without any worksheet data behind it; the numbers follow the code and are regenerated with it, so no copy has to be maintained in the sheet for the sake of the chart. Because the values come from nowhere on the sheet, the chart carries no text categories either, and the horizontal axis is numbered 1, 2, 3. The steps are:
- Load the font and the test data file into the VFS.
- Load the workbook with
workbook.LoadFromFileand get the first worksheet withworkbook.Worksheets.get(0); the new chart still has to hang on an existing worksheet. - Add a column chart with
sheet.Charts.Add, and set the chart title and position. - Add a series with
chart.Series.Addand setserie.Nameto the series name. - Box each number with
xlsModule.Int32.Create, put them in order intoserie.EnteredDirectlyValues, and save the workbook.
The complete code example below shows how to create a chart without a data source in React:
function App() {
  const chartWithoutSourceData = async () => {
    // Get the Spire.XLS WASM module
    const xlsModule = window.wasmModule?.spirexls;

    // Check that the module is ready
    if (!xlsModule) {
      alert('Spire.Xls is not ready yet');
      return;
    }

    // Load the font and the sample workbook into the VFS
    await window.spire.FetchFileToVFS('ARIAL.TTF', '/Library/Fonts/', `${process.env.PUBLIC_URL}/font/`);
    const inputFileName = 'ChartSourceData.xlsx';
    await window.spire.FetchFileToVFS(inputFileName, '', `${process.env.PUBLIC_URL}data/`);

    // Load the workbook and get the first worksheet
    const workbook = new xlsModule.Workbook();
    workbook.LoadFromFile({ fileName: inputFileName });
    const sheet = workbook.Worksheets.get(0);

    // Add a column chart; this time the numbers come from no cell at all
    const chart = sheet.Charts.Add({ chartType: xlsModule.ExcelChartType.ColumnClustered });
    chart.ChartTitle = "Sales Target by Region";
    chart.ChartTitleArea.Size = 12;

    // Place the chart on the worksheet
    chart.TopRow = 12;
    chart.BottomRow = 28;
    chart.LeftColumn = 1;
    chart.RightColumn = 10;

    // Add a series and write the numbers into EnteredDirectlyValues one by one
    // No category labels are given, so the chart numbers them 1, 2, 3
    const targetSerie = chart.Series.Add();
    targetSerie.Name = "Sales Target";
    targetSerie.EnteredDirectlyValues = [
      xlsModule.Int32.Create(260),
      xlsModule.Int32.Create(210),
      xlsModule.Int32.Create(190),
    ];

    // Save the workbook
    const outputFileName = "NoSourceData.xlsx";
    workbook.SaveToFile({ fileName: outputFileName });

    // Dispose of the workbook object to free resources
    workbook.Dispose();

    // Read the result file from the VFS and trigger the download
    const fileArray = window.dotnetRuntime.Module.FS.readFile(outputFileName);
    const blob = new Blob([fileArray], { type: 'application/vnd.openxmlformats-officedocument.spreadsheetml.sheet' });
    const url = URL.createObjectURL(blob);
    const a = document.createElement('a');
    a.href = url;
    a.download = outputFileName;
    a.click();
    URL.revokeObjectURL(url);
  };

  return (
    <div style={{ textAlign: 'center', height: '300px' }}>
      <h1>Chart Without a Data Source</h1>
      <button id="no-source-data" onClick={chartWithoutSourceData}>Create a chart without a data source</button>
    </div>
  );
}

export default App;
After running, the chart created without a data source:
FAQ
Does the series name have to point at a cell?
Cause: serie.Name takes a plain string. Whatever you assign becomes the series name and is what the legend shows; after saving it sits in the series itself rather than in a reference to a cell. Reading the Value of a header cell is just another way to get there, not a requirement. The values and the category labels still have to come from a range — only the name can stand free of one.
Solution: assign the text straight to serie.Name:
const serie = chart.Series.Add();
serie.Name = "Sales Target";
serie.CategoryLabels = sheet.Range.get("A2:A3").AddCombinedRange(sheet.Range.get("A5:A6")).AddCombinedRange(sheet.Range.get("A8:A9"));
serie.Values = sheet.Range.get("B2:B3").AddCombinedRange(sheet.Range.get("B5:B6")).AddCombinedRange(sheet.Range.get("B8:B9"));
Do both series need their own category labels?
Cause: CategoryLabels belongs to the series itself. When a second series is added it does not pick up the setting from the one before it, so it has to be assigned again.
Solution: join the blocks once, keep the result in a variable and point each series at it, instead of writing AddCombinedRange out twice:
const labels = sheet.Range.get("A2:A3")
  .AddCombinedRange(sheet.Range.get("A5:A6"))
  .AddCombinedRange(sheet.Range.get("A8:A9"));

onlineSerie.CategoryLabels = labels;
storeSerie.CategoryLabels = labels;
Get a Free License
Spire.XLS for JavaScript offers a 30-day full-featured free trial license with no functional limitations. Apply here to evaluate before purchasing.
