Convertir Excel en Markdown : 4 méthodes simples pour tout flux de travail
Table des matières
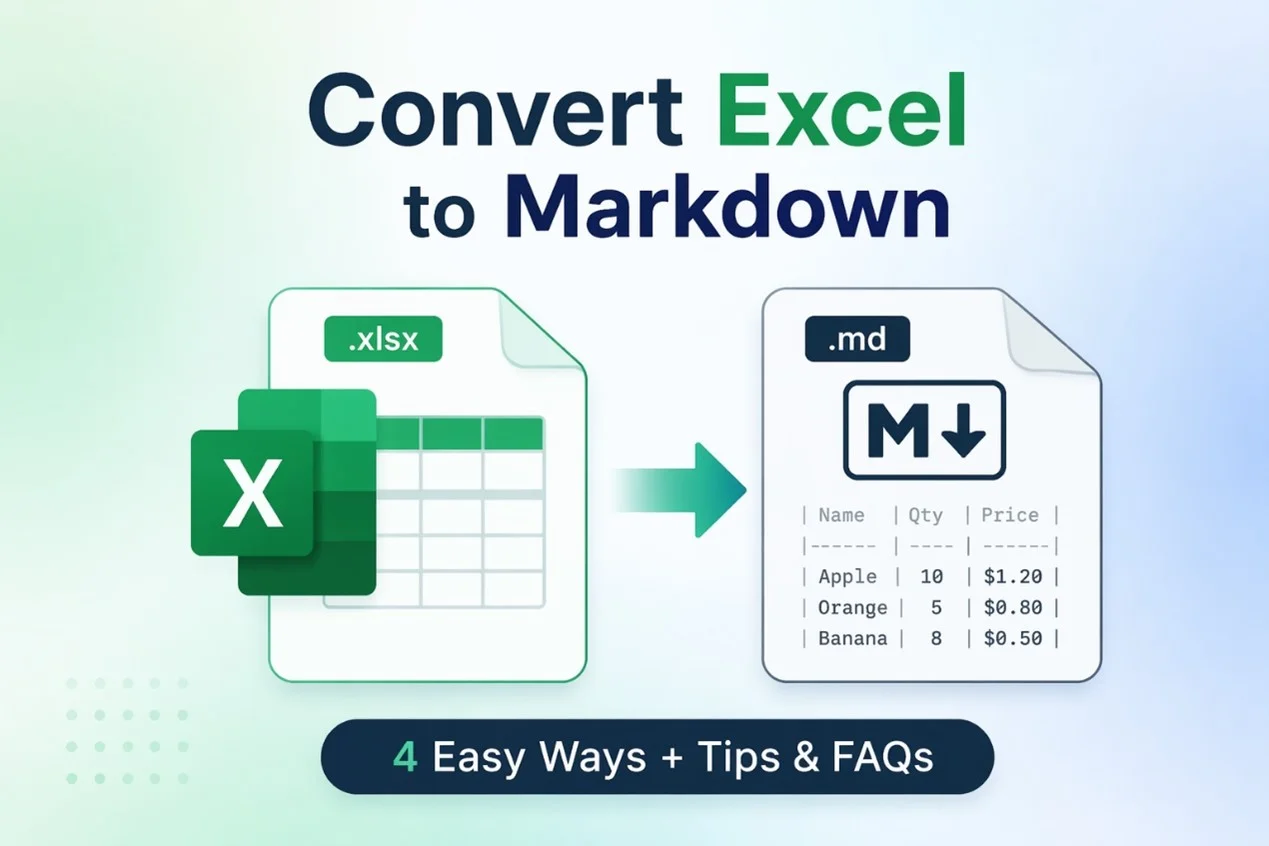
Excel est un outil puissant pour gérer et analyser des données, mais le partage de feuilles de calcul dans des blogs, de la documentation ou des applications de prise de notes multiplateformes pose souvent des problèmes de mise en forme et de compatibilité. La conversion d'Excel en Markdown préserve la structure des tableaux, rendant vos données légères, lisibles et faciles à partager sur différentes plateformes.
Dans ce guide, nous vous présenterons 4 méthodes pratiques pour convertir Excel en Markdown, y compris des outils en ligne, des plugins ou extensions d'éditeurs, et l'automatisation Python. Que vous soyez étudiant, blogueur ou développeur, vous trouverez la méthode qui correspond à votre flux de travail.
Pourquoi convertir Excel en Markdown ?
La conversion d'Excel en Markdown est particulièrement utile lorsque vous devez publier ou partager des données structurées dans un format propre et lisible, sans avoir recours à des fichiers de tableur.
Voici quelques scénarios courants où cette conversion est pertinente :
- Rédaction de blogs techniques : Convertissez des tableaux Excel en Markdown pour intégrer des tableaux propres et formatés directement dans les articles de blog sans captures d'écran ni téléchargements de fichiers.
- Création de fichiers README GitHub : Les tableaux Markdown fonctionnent nativement sur GitHub, ce qui facilite la présentation de jeux de données, de comparaisons ou de configurations.
- Maintenance de la documentation : Utilisez des tableaux Markdown dans les systèmes de documentation ou les bases de connaissances pour une mise en forme cohérente sur toutes les plateformes.
- Travail avec le contrôle de version : Les fichiers Markdown peuvent être suivis dans Git, permettant aux équipes de surveiller les changements de données au fil du temps.
- Partage de données légères : Markdown est du texte brut, ce qui le rend plus facile à partager, modifier et réutiliser par rapport aux fichiers Excel.
Pouvez-vous convertir Excel en Markdown directement ?
Non, Microsoft Excel ne propose pas d'option intégrée pour exporter des données au format Markdown. En effet, les tableaux Markdown utilisent une structure de texte brut basée sur des barres verticales (|) et des lignes de séparation, tandis qu'Excel stocke les données dans un format de feuille de calcul structuré.
Pour convertir Excel en Markdown, vous pouvez utiliser l'une des méthodes suivantes :
- Convertir Excel en Markdown rapidement en ligne (sans installation)
- Utiliser le plugin Obsidian Excel vers Table Markdown
- Convertir Excel en Markdown dans VS Code avec des extensions
- Automatiser la conversion Excel en Markdown avec Python
Maintenant, examinons chaque méthode étape par étape.
Méthode 1 : Convertir Excel en Markdown rapidement en ligne (sans installation)
L'une des méthodes les plus rapides pour convertir Excel en Markdown consiste à utiliser des convertisseurs en ligne. Ces outils fonctionnent sur toutes les plateformes (Windows, Mac, Linux), ne nécessitent aucune installation et sont idéaux pour les utilisateurs qui souhaitent une solution rapide basée sur un navigateur.
Convertisseurs Excel vers Markdown gratuits en ligne populaires :
- TableConvert : Prend en charge le téléchargement de fichiers .xlsx ou le collage de données Excel, avec un éditeur intégré pour la prévisualisation et les modifications.
- Table to Markdown : Une interface simple où vous collez des tableaux Excel copiés pour générer un tableau Markdown formaté.
- CloudxDocs : Utile pour convertir des fichiers Excel entiers en fichiers Markdown téléchargeables.
Étapes pour convertir Excel en Markdown en ligne :
-
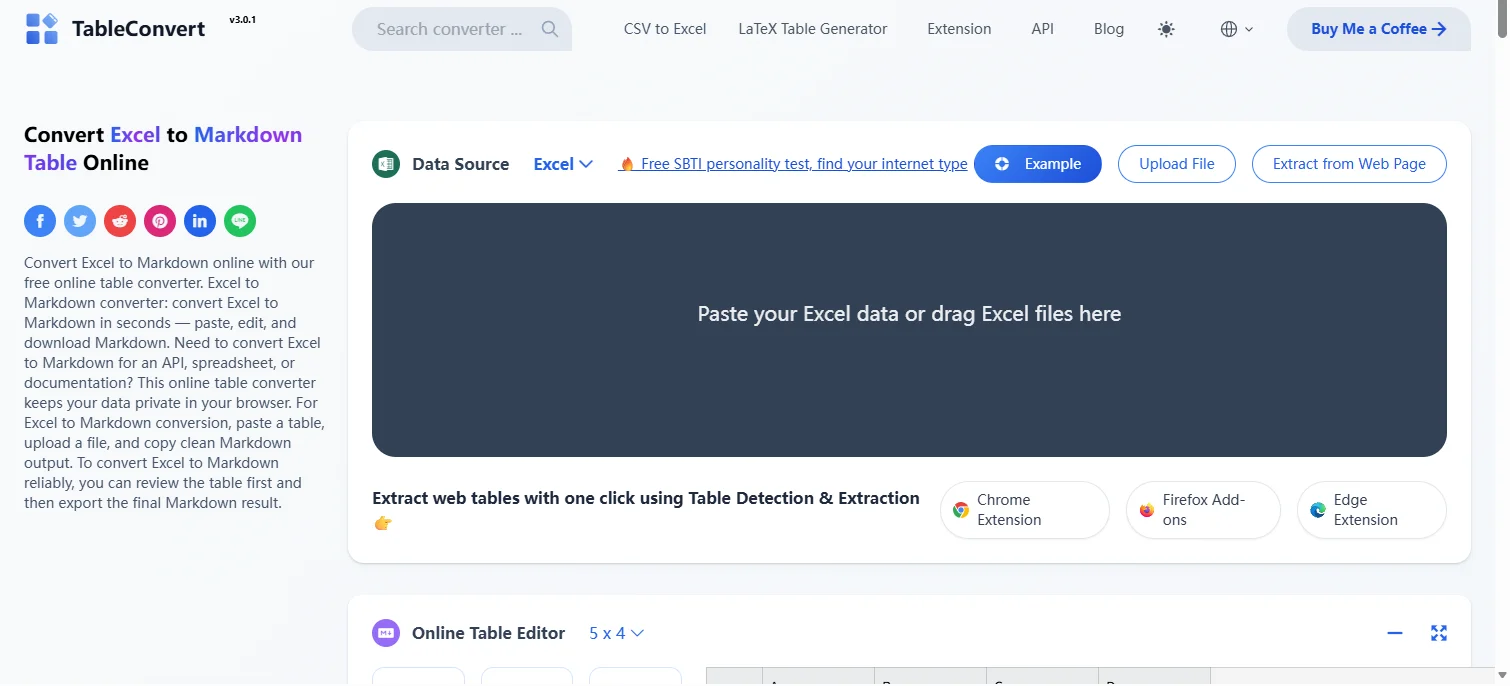
Accédez au site Web du convertisseur en ligne de votre choix, comme TableConvert.
-
Faites glisser votre fichier .xlsx ou collez vos données Excel dans la zone désignée.
-
Sélectionnez Markdown comme format de sortie. L'outil convertira automatiquement votre fichier ou vos données Excel.
-
Copiez le code Markdown généré et collez-le dans votre fichier Markdown.
Après la conversion, vos données Excel apparaîtront sous forme de tableau Markdown comme ceci :
| Produit | Prix | Stock |
|---------|-------|-------|
| Pomme | 1.2 | 50 |
| Orange | 0.8 | 100 |
Astuce : Certains outils en ligne peuvent avoir des limites de taille de fichier ou de longueur de tableau. Si nécessaire, vous pouvez diviser les feuilles Excel en parties plus petites avant de les télécharger.
Avertissement de sécurité : Les outils en ligne Excel vers Markdown nécessitent le téléchargement de vos données sur des serveurs tiers. Évitez de les utiliser pour des données sensibles ou confidentielles – envisagez plutôt une méthode hors ligne.
Quand l'utiliser : Convient pour des conversions rapides, ponctuelles, en particulier pour de petits tableaux ou lorsque aucune installation n'est préférée.
Si vous avez besoin de convertir Markdown en Excel, consultez notre guide sur la façon de convertir Markdown en Excel.
Méthode 2 : Utiliser le plugin Obsidian Excel vers Table Markdown
Obsidian est une application de prise de notes Markdown gratuite et multiplateforme (Windows, macOS et Linux). Avec son plugin communautaire Excel to Markdown Table, vous pouvez rapidement convertir et coller des données Excel sous forme de tableaux Markdown standard pour une intégration transparente dans vos notes.
Guide étape par étape :
-
Téléchargez et installez Obsidian depuis le site officiel pour votre système d'exploitation (Windows, Mac ou Linux).
-
Installez le plugin Excel to Markdown Table :
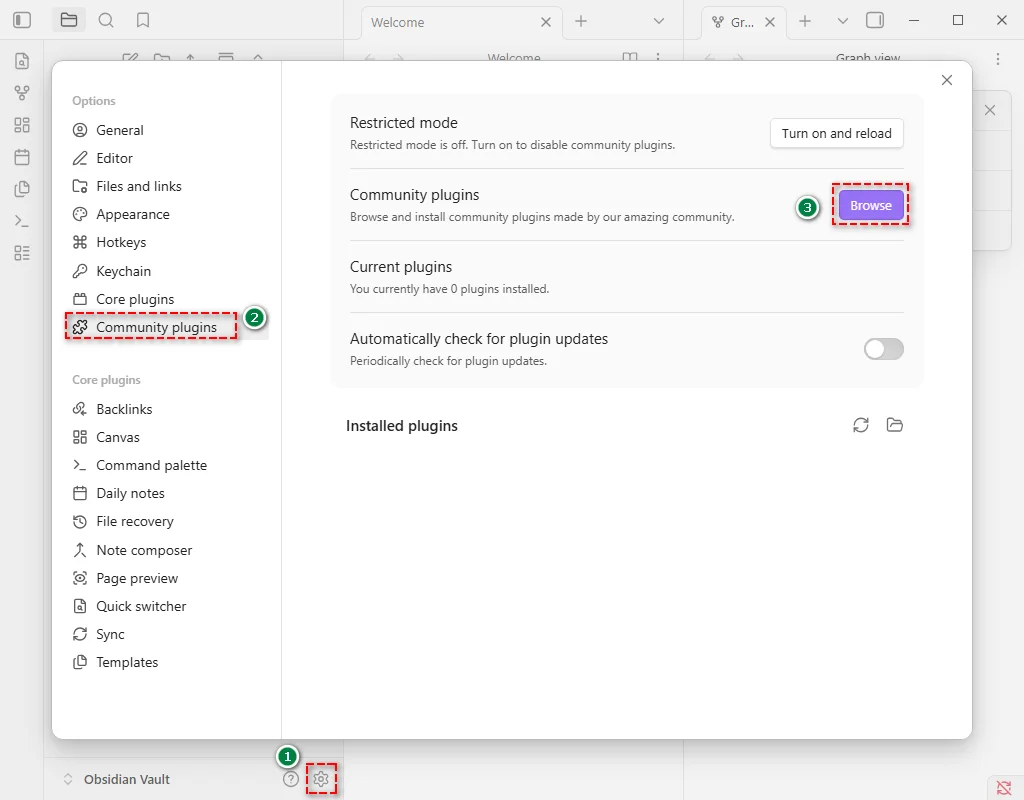
- Ouvrez Obsidian et allez dans Paramètres > Plugins communautaires > Parcourir.
- Recherchez Excel to Markdown Table.
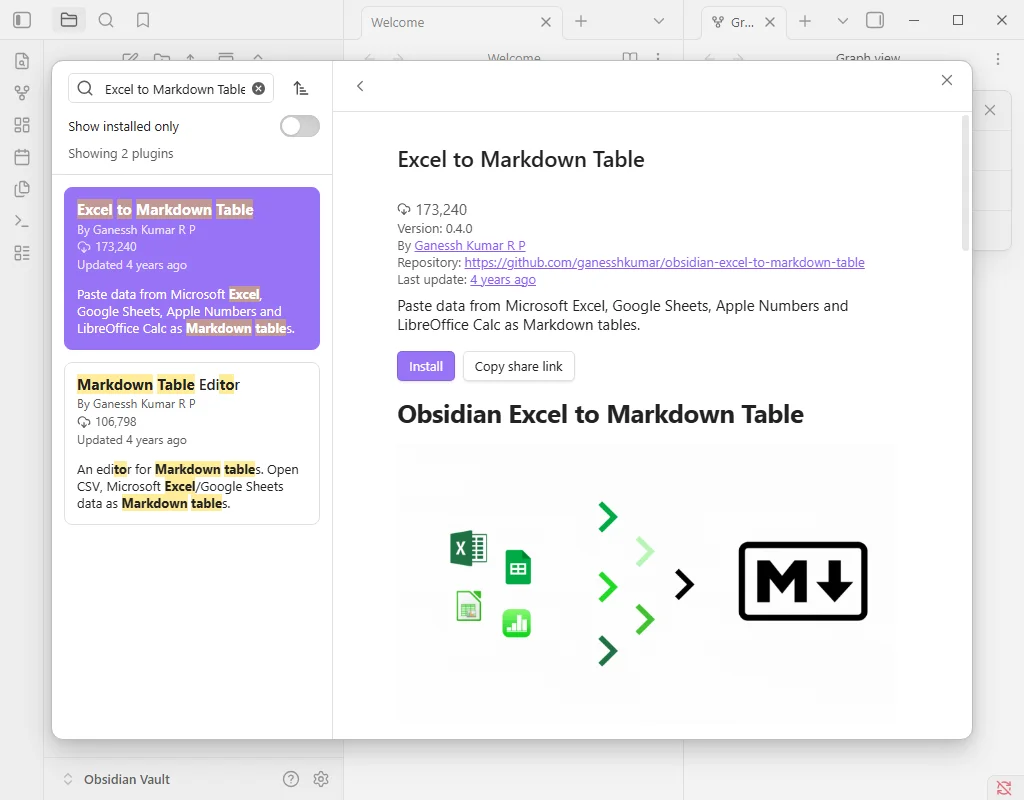
- Cliquez sur Installer, puis sur Activer.
-
Copiez votre tableau Excel en utilisant Ctrl+C (Windows) ou Cmd+C (Mac).
-
Collez dans votre note Obsidian en utilisant Ctrl+V (Windows) ou Cmd+V (Mac). Le plugin le formatera automatiquement en tableau Markdown.
-
Ajustez l'alignement ou la mise en forme dans Obsidian si nécessaire.
Conseils et notes :
- Ce plugin se concentre sur la conversion des structures de tableaux. Il ne peut pas parfaitement conserver la mise en forme complexe à l'intérieur des cellules Excel (comme le gras ou l'italique). Après la conversion, vérifiez et apportez des ajustements manuels si nécessaire.
- Gardez le plugin à jour via le répertoire des plugins communautaires d'Obsidian pour de meilleures performances et une sécurité optimale.
Quand l'utiliser : Idéal pour intégrer des tableaux Excel directement dans des notes Markdown pour des blogs, de la documentation ou des bases de connaissances.
Méthode 3 : Convertir Excel en Markdown dans VS Code avec des extensions
Pour les développeurs ou les utilisateurs avancés utilisant Visual Studio Code (VS Code), l'extension Excel to Markdown Table offre un moyen rapide et intégré de convertir des données Excel en Markdown sans quitter votre environnement de développement.
Instructions étape par étape :
-
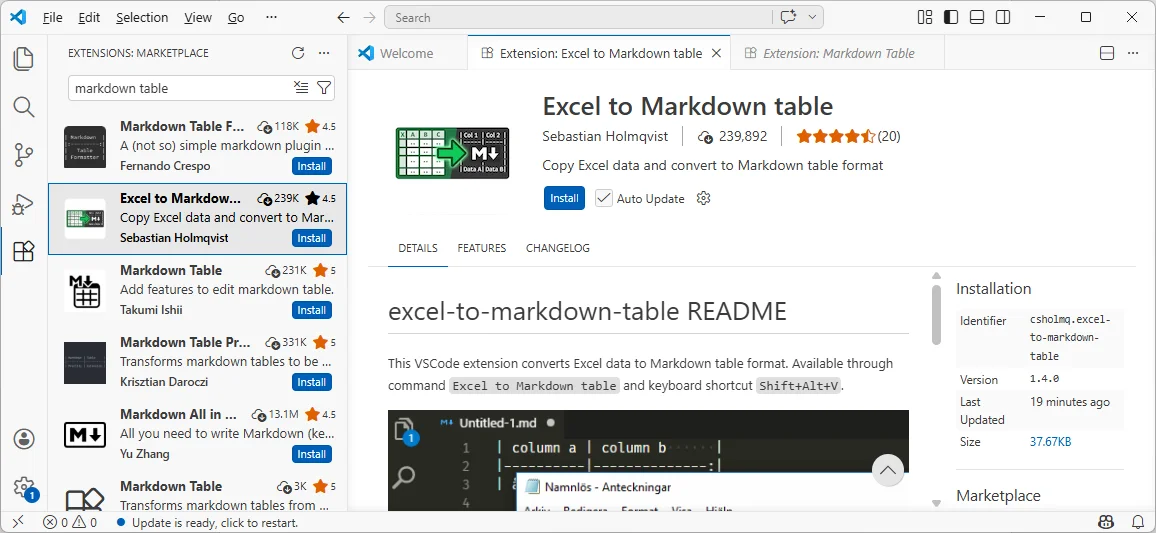
Ouvrez VS Code, allez dans Extensions (Ctrl+Shift+X), recherchez Excel to Markdown Table et cliquez sur Installer.
-
Copiez les données Excel (Ctrl+C / Cmd+C).
-
Ouvrez votre fichier .md dans VS Code et appuyez sur Shift + Alt + V pour coller le tableau au format Markdown.
-
Optionnel : Ajustez l'alignement du tableau en utilisant des préfixes d'en-tête :
- ^l - aligner à gauche
- ^c - centrer
- ^r - aligner à droite
-
Copiez ou utilisez le tableau Markdown selon vos besoins.
Conseils :
- L'extension gère les sauts de ligne dans les cellules Excel en insérant automatiquement des balises <br> dans le tableau Markdown.
- Des ajustements manuels peuvent être nécessaires si la mise en forme des données est incohérente.
Quand l'utiliser : Idéal pour les développeurs ou les utilisateurs avancés travaillant dans VS Code qui souhaitent un flux de travail plus rapide et intégré.
Méthode 4 : Automatiser la conversion Excel en Markdown avec Python
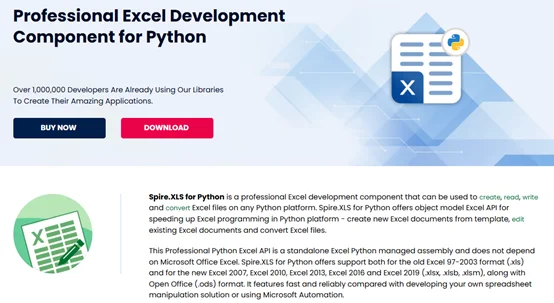
Pour les programmeurs et les entreprises qui ont besoin d'une solution rapide, efficace et par lots, l'automatisation Python offre une solution évolutive pour la conversion d'Excel en Markdown. En utilisant des bibliothèques comme Spire.XLS pour Python, vous pouvez rapidement transformer des dizaines ou des centaines de fichiers Excel en tableaux Markdown propres et structurés tout en préservant la mise en forme.
Pourquoi Spire.XLS pour Python
Spire.XLS est une bibliothèque Python robuste qui simplifie l'automatisation Excel et la conversion Markdown :
- Préserve la mise en forme : Maintient les styles de texte et les liens lors de la conversion d'Excel en Markdown.
- Prend en charge plusieurs formats Excel : Traitez les fichiers .xls, .xlsx et .xlsm de manière transparente.
- Créez et écrivez facilement des fichiers Excel : Créez de nouveaux fichiers Excel ou modifiez-en des existants par programme.
- Multiplateforme : Fonctionne sous Windows, Mac et Linux.
- Indépendance : Ne nécessite pas l'installation de Microsoft Excel sur la machine.
Installation
Pour commencer, installez Spire.XLS pour Python depuis PyPI en exécutant la commande suivante :
pip install spire.xls
Script Python pour la conversion par lots d'Excel en Markdown
Voici un exemple simple de la façon de convertir plusieurs fichiers Excel en tableaux Markdown :
import os
from spire.xls import *

# Spécifiez les chemins des dossiers d'entrée et de sortie
input_folder = "chemin/vers/votre/dossier_excel"  # Remplacez par votre dossier contenant les fichiers Excel
output_folder = "chemin/vers/dossier_markdown_sortie"   # Remplacez par votre dossier de sortie souhaité pour les fichiers Markdown

# Obtenez tous les fichiers Excel du dossier d'entrée
excel_files = [f for f in os.listdir(input_folder) if f.endswith('.xlsx')]

# Vérifiez si le dossier de sortie existe, sinon, créez-le
if not os.path.exists(output_folder):
    os.makedirs(output_folder)

# Traitez chaque fichier Excel du dossier
for file in excel_files:
    input_file_path = os.path.join(input_folder, file)

    # Créez une instance de Workbook et chargez le fichier Excel
    workbook = Workbook()
    workbook.LoadFromFile(input_file_path)

    # Extrayez le nom du fichier sans extension
    file_name_without_extension = os.path.splitext(file)[0]

    # Générez le chemin du fichier Markdown de sortie
    output_file_path = os.path.join(output_folder, f"{file_name_without_extension}.md")

    # Enregistrez le fichier Excel en tant que fichier .md
    workbook.SaveToMarkdown(output_file_path)

    # Libérez l'objet workbook pour libérer les ressources
    workbook.Dispose()
    print(f"Converti {file} en {output_file_path}")
Ce script analyse tous les fichiers .xlsx du dossier d'entrée spécifié et les enregistre sous forme de fichiers Markdown dans le dossier de sortie.
Conseils pour la personnalisation
-
Personnalisation des options de rendu Markdown :
Vous pouvez personnaliser la façon dont le fichier Markdown est converti en ajustant les options de rendu comme ceci :
# Créez MarkdownOptions markdownOptions = MarkdownOptions() # Contrôlez comment les images sont stockées markdownOptions.SavePicInRelativePath = False # Contrôlez comment les hyperliens sont rendus markdownOptions.SaveHyperlinkAsRef = True # Enregistrez en tant que Markdown workbook.SaveToMarkdown(output_file_path, markdownOptions) -
Traitement des fichiers .xls :
Le script peut être modifié pour traiter les fichiers .xls en ajoutant simplement une vérification pour les extensions .xlsx et .xls :
excel_files = [f for f in os.listdir(input_folder) if f.endswith(('.xlsx', '.xls'))]
Quand l'utiliser : Idéal pour les développeurs, les ingénieurs de données ou les équipes ayant besoin d'un traitement par lots automatisé de plusieurs fichiers Excel.
Comparaison des méthodes Excel vers Markdown
Pour vous aider à choisir la bonne méthode pour convertir Excel en Markdown, voici une comparaison rapide des quatre approches :
| Méthode | Idéal pour | Vitesse | Personnalisation | Niveau de compétence |
|---|---|---|---|---|
| Outils en ligne | Conversions rapides, ponctuelles | Rapide | Limité | Débutant |
| Plugin Obsidian | Notes et documentation | Moyen | Moyen | Débutant |
| Extension VS Code | Flux de travail de développeur | Rapide | Moyen | Intermédiaire |
| Automatisation Python | Traitement par lots | Très rapide | Élevé | Avancé |
Recommandations :
- Besoin d'une solution rapide sans configuration ? Les outils en ligne sont l'option la plus rapide.
- Pour les flux de travail de prise de notes, le plugin Obsidian offre une expérience fluide et intuitive.
- Vous travaillez déjà dans un environnement de développement VS Code ? Les extensions VS Code réduisent les frictions et améliorent l'efficacité.
- Pour les grands ensembles de données ou les tâches répétitives, l'automatisation Python est l'approche la plus évolutive.
Dans la plupart des cas, les développeurs et les équipes gérant des conversions fréquentes bénéficieront davantage de l'automatisation, tandis que les utilisateurs occasionnels pourront s'appuyer sur des outils plus simples.
Dépannage des problèmes courants d'Excel vers Markdown
Même si la conversion d'Excel en Markdown est généralement simple, vous pouvez rencontrer certains problèmes courants. Voici des solutions pratiques :
| Problème | Solution |
|---|---|
| Une cellule se transforme en plusieurs lignes | Les sauts de ligne dans les cellules Excel sont traités comme de nouvelles lignes dans Markdown. Remplacez-les par des balises <br> avant la conversion (recherchez Ctrl+J, remplacez par <br>). |
| Les données se décalent après la conversion (colonnes déplacées) | Les cellules fusionnées dans Excel brisent la structure du tableau. Désélectionnez toutes les cellules, puis remplissez les valeurs manquantes pour que chaque ligne soit complète. |
| Les cellules vides s'affichent comme NaN | Certains convertisseurs remplacent les valeurs vides par NaN. Utilisez Rechercher et remplacer après la conversion pour les supprimer ou les remplacer par des blancs. |
| Des lignes ou des colonnes supplémentaires apparaissent de manière inattendue | Les lignes ou colonnes masquées dans Excel sont incluses. Affichez-les ou supprimez-les avant la conversion. |
Astuce Pro : Prévisualisez toujours votre tableau Markdown après la conversion pour vérifier l'alignement et la mise en forme.
Questions fréquemment posées sur Excel vers Markdown
Q1 : Puis-je convertir Excel en Markdown gratuitement ?
R1 : Oui, les outils en ligne comme TableConvert permettent une conversion gratuite d'Excel en Markdown, bien qu'ils puissent avoir des limitations sur la taille des fichiers ou les fonctionnalités.
Q2 : Puis-je convertir des formules Excel en Markdown ?
R2 : Non, Markdown ne prend en charge que les valeurs statiques. Les formules sont converties en leurs résultats calculés.
Q3 : Puis-je convertir plusieurs fichiers Excel à la fois ?
R3 : Oui, vous pouvez utiliser Python avec des bibliothèques comme Spire.XLS pour convertir par lots plusieurs fichiers Excel efficacement.
Q4 : Puis-je conserver les images lors de la conversion d'Excel en Markdown ?
R4 : Markdown utilise des liens d'images au lieu d'intégrer directement des images Excel.
Q5 : Quelle est la méthode la plus simple pour convertir Excel en Markdown ?
R5 : L'utilisation d'un convertisseur en ligne est la méthode la plus simple car elle ne nécessite aucune installation.
Voir aussi
Convertir Excel a Markdown: 4 métodos sencillos para cualquier flujo de trabajo
Tabla de Contenidos
Excel es una herramienta potente para gestionar y analizar datos, pero compartir hojas de cálculo en blogs, documentación o aplicaciones de toma de notas multiplataforma a menudo causa problemas de formato y compatibilidad. Convertir Excel a Markdown preserva la estructura de la tabla, haciendo que sus datos sean ligeros, legibles y fáciles de compartir entre plataformas.
En esta guía, le mostraremos 4 formas prácticas de convertir Excel a Markdown, incluyendo herramientas en línea, plugins o extensiones de editor y automatización con Python. Ya sea estudiante, blogger o desarrollador, encontrará el método que se adapta a su flujo de trabajo.
¿Por qué convertir Excel a Markdown?
Convertir Excel a Markdown es especialmente útil cuando necesita publicar o compartir datos estructurados en un formato limpio y legible, sin depender de archivos de hoja de cálculo.
Aquí hay algunos escenarios comunes donde esta conversión tiene sentido:
- Escribir blogs técnicos: Convierta tablas de Excel a Markdown para incrustar tablas limpias y formateadas directamente en las publicaciones del blog sin capturas de pantalla ni descargas de archivos.
- Crear archivos README de GitHub: Las tablas de Markdown funcionan de forma nativa en GitHub, lo que facilita la presentación de conjuntos de datos, comparaciones o configuraciones.
- Mantener documentación: Utilice tablas de Markdown en sistemas de documentación o bases de conocimiento para un formato consistente en todas las plataformas.
- Trabajar con control de versiones: Los archivos Markdown se pueden rastrear en Git, lo que permite a los equipos monitorear los cambios de datos a lo largo del tiempo.
- Compartir datos ligeros: Markdown es texto plano, lo que facilita compartir, editar y reutilizar en comparación con los archivos de Excel.
¿Se puede convertir Excel a Markdown directamente?
No, Microsoft Excel no proporciona una opción integrada para exportar datos en formato Markdown. Esto se debe a que las tablas de Markdown utilizan una estructura de texto plano basada en barras verticales (|) y filas separadoras, mientras que Excel almacena los datos en un formato de hoja de cálculo estructurada.
Para convertir Excel a Markdown, puede utilizar uno de los siguientes métodos:
- Convertir Excel a Markdown Online Rápidamente (Sin Instalación)
- Usar el Plugin de Obsidian para Tablas de Excel a Markdown
- Convertir Excel a Markdown en VS Code con Extensiones
- Automatizar la Conversión de Excel a Markdown con Python
Ahora, analicemos cada método paso a paso.
Método 1: Convertir Excel a Markdown Online Rápidamente (Sin Instalación)
Uno de los métodos más rápidos para convertir Excel a Markdown es usar convertidores en línea. Estas herramientas funcionan en cualquier plataforma (Windows, Mac, Linux), no requieren instalación y son ideales para usuarios que desean una solución rápida basada en navegador.
Convertidores Gratuitos Populares de Excel a Markdown en Línea:
- TableConvert: Admite la carga de archivos .xlsx o la pegada de datos de Excel, con un editor integrado para previsualización y edición.
- Table to Markdown: Una interfaz simple donde pega tablas de Excel copiadas para generar una tabla de Markdown formateada.
- CloudxDocs: Útil para convertir archivos de Excel completos en archivos Markdown descargables.
Pasos para Convertir Excel a Markdown en Línea:
-
Vaya al sitio web del convertidor en línea elegido, como TableConvert.
-
Arrastre su archivo .xlsx o pegue sus datos de Excel en el área designada.
-
Seleccione Markdown como formato de salida. La herramienta convertirá automáticamente su archivo o datos de Excel.
-
Copie el código Markdown generado y péguelo en su archivo Markdown.
Después de la conversión, sus datos de Excel aparecerán como una tabla de Markdown como esta:
| Producto | Precio | Stock |
|---------|-------|-------|
| Manzana | 1.2 | 50 |
| Naranja | 0.8 | 100 |
Consejo: Algunas herramientas en línea pueden tener límites de tamaño de archivo o longitud de tabla. Si es necesario, puede dividir hojas de Excel en partes más pequeñas antes de subirlas.
Advertencia de Seguridad: Las herramientas en línea de Excel a Markdown requieren subir sus datos a servidores de terceros. Evite usarlas para datos sensibles o confidenciales; considere usar un método sin conexión en su lugar.
Cuándo Usar: Adecuado para conversiones rápidas y únicas, especialmente para tablas pequeñas o cuando no se prefiere la instalación.
Si necesita convertir Markdown de nuevo a Excel, consulte nuestra guía sobre cómo convertir Markdown a Excel.
Método 2: Usar el Plugin de Obsidian para Tablas de Excel a Markdown
Obsidian es una aplicación gratuita de toma de notas en Markdown multiplataforma (Windows, macOS y Linux). Con su plugin comunitario Excel to Markdown Table, puede convertir y pegar rápidamente datos de Excel como tablas de Markdown estándar para una integración perfecta en sus notas.
Guía Paso a Paso:
-
Descargue e instale Obsidian desde el sitio web oficial para su sistema operativo (Windows, Mac o Linux).
-
Instale el plugin Excel to Markdown Table:
- Abra Obsidian y vaya a Configuración > Plugins comunitarios > Explorar.
- Busque Excel to Markdown Table.
- Haga clic en Instalar y luego en Habilitar.
-
Copie su tabla de Excel usando Ctrl+C (Windows) o Cmd+C (Mac).
-
Péguelo en su nota de Obsidian usando Ctrl+V (Windows) o Cmd+V (Mac). El plugin lo formateará automáticamente como una tabla de Markdown.
-
Ajuste la alineación o el formato en Obsidian si es necesario.
Consejos y Notas:
- Este plugin se enfoca en convertir estructuras de tablas. Puede que no conserve perfectamente el formato complejo dentro de las celdas de Excel (como negrita o cursiva). Después de la conversión, verifique y realice ajustes manuales si es necesario.
- Mantenga el plugin actualizado a través del directorio de plugins comunitarios de Obsidian para un mejor rendimiento y seguridad.
Cuándo Usar: Ideal para incrustar tablas de Excel directamente en notas de Markdown para blogs, documentación o bases de conocimiento.
Método 3: Convertir Excel a Markdown en VS Code con Extensiones
Para desarrolladores o usuarios avanzados que utilizan Visual Studio Code (VS Code), la extensión Excel to Markdown Table proporciona una forma rápida e integrada de convertir datos de Excel a Markdown sin salir de su entorno de desarrollo.
Instrucciones Paso a Paso:
-
Abra VS Code, vaya a Extensiones (Ctrl+Shift+X), busque Excel to Markdown Table y haga clic en Instalar.
-
Copie los datos de Excel (Ctrl+C / Cmd+C).
-
Abra su archivo .md en VS Code y presione Shift + Alt + V para pegar la tabla en formato Markdown.
-
Opcional: Ajuste la alineación de la tabla usando prefijos de encabezado:
- ^l - alinear a la izquierda
- ^c - centrar
- ^r - alinear a la derecha
-
Copie o use la tabla de Markdown según sea necesario.
Consejos:
- La extensión maneja los saltos de línea de las celdas de Excel insertando automáticamente etiquetas <br> en la tabla de Markdown.
- Pueden ser necesarios ajustes manuales si el formato de los datos es inconsistente.
Cuándo Usar: Ideal para desarrolladores o usuarios avanzados que trabajan dentro de VS Code y desean un flujo de trabajo más rápido e integrado.
Método 4: Automatizar la Conversión de Excel a Markdown con Python
Para programadores y empresas que necesitan una solución rápida, eficiente y por lotes, la automatización con Python proporciona una solución escalable para la conversión de Excel a Markdown. Al utilizar bibliotecas como Spire.XLS para Python, puede transformar rápidamente docenas o cientos de archivos de Excel en tablas de Markdown limpias y estructuradas, preservando el formato.
¿Por qué Spire.XLS para Python?
Spire.XLS es una biblioteca de Python robusta que simplifica la automatización de Excel y la conversión a Markdown:
- Preserva el formato: Mantiene estilos de texto y enlaces durante la conversión de Excel a Markdown.
- Soporta múltiples formatos de Excel: Maneja archivos .xls, .xlsx y .xlsm sin problemas.
- Crea y escribe archivos de Excel fácilmente: Crea nuevos archivos de Excel o modifica los existentes mediante programación.
- Multiplataforma: Funciona en Windows, Mac y Linux.
- Independencia: No requiere que Microsoft Excel esté instalado en la máquina.
Instalación
Para empezar, instale Spire.XLS para Python desde PyPI ejecutando el siguiente comando:
pip install spire.xls
Script de Python para Conversión por Lotes de Excel a Markdown
Aquí hay un ejemplo simple de cómo convertir varios archivos de Excel a tablas de Markdown:
import os
from spire.xls import *

# Especificar las rutas de las carpetas de entrada y salida
input_folder = "ruta/a/su/carpeta_excel"  # Reemplace con su carpeta que contiene los archivos de Excel
output_folder = "ruta/a/markdown_salida"   # Reemplace con su carpeta deseada para los archivos Markdown

# Obtener todos los archivos de Excel de la carpeta de entrada
excel_files = [f for f in os.listdir(input_folder) if f.endswith('.xlsx')]

# Comprobar si la carpeta de salida existe, si no, crearla
if not os.path.exists(output_folder):
    os.makedirs(output_folder)

# Procesar cada archivo de Excel en la carpeta
for file in excel_files:
    input_file_path = os.path.join(input_folder, file)

    # Crear una instancia de Workbook y cargar el archivo de Excel
    workbook = Workbook()
    workbook.LoadFromFile(input_file_path)

    # Extraer el nombre del archivo sin extensión
    file_name_without_extension = os.path.splitext(file)[0]

    # Generar la ruta del archivo Markdown de salida
    output_file_path = os.path.join(output_folder, f"{file_name_without_extension}.md")

    # Guardar el archivo de Excel como un archivo .md
    workbook.SaveToMarkdown(output_file_path)

    # Liberar el objeto workbook para liberar recursos
    workbook.Dispose()
    print(f"Convertido {file} a {output_file_path}")
Este script escanea todos los archivos .xlsx en la carpeta de entrada especificada y los guarda como archivos Markdown en la carpeta de salida.
Consejos para la Personalización
-
Personalizar Opciones de Renderizado de Markdown:
Puede personalizar cómo se renderiza el archivo Markdown ajustando las opciones de renderizado de esta manera:
# Crear MarkdownOptions markdownOptions = MarkdownOptions() # Controlar cómo se almacenan las imágenes markdownOptions.SavePicInRelativePath = False # Controlar cómo se renderizan los hipervínculos markdownOptions.SaveHyperlinkAsRef = True # Guardar como Markdown workbook.SaveToMarkdown(output_file_path, markdownOptions) -
Procesar Archivos .xls:
El script se puede modificar para procesar archivos .xls simplemente agregando una verificación para ambas extensiones, .xlsx y .xls:
excel_files = [f for f in os.listdir(input_folder) if f.endswith(('.xlsx', '.xls'))]
Cuándo Usar: Lo mejor para desarrolladores, ingenieros de datos o equipos que necesitan procesamiento por lotes automatizado de múltiples archivos de Excel.
Comparación de Métodos de Excel a Markdown
Para ayudarle a elegir el método correcto para convertir Excel a Markdown, aquí tiene una comparación rápida de los cuatro enfoques:
| Método | Mejor Para | Velocidad | Personalización | Nivel de Habilidad |
|---|---|---|---|---|
| Herramientas en Línea | Conversiones rápidas y únicas | Rápido | Limitado | Principiante |
| Plugin de Obsidian | Notas y documentación | Medio | Medio | Principiante |
| Extensión de VS Code | Flujo de trabajo del desarrollador | Rápido | Medio | Intermedio |
| Automatización con Python | Procesamiento por lotes | Muy Rápido | Alto | Avanzado |
Recomendaciones:
- ¿Necesita una solución rápida y sin configuración? Las herramientas en línea son la opción más rápida.
- Para flujos de trabajo de toma de notas, el plugin de Obsidian proporciona una experiencia fluida e intuitiva.
- ¿Ya trabaja en un entorno de desarrollo de VS Code? Las extensiones de VS Code reducen la fricción y mejoran la eficiencia.
- Para grandes conjuntos de datos o tareas repetitivas, la automatización con Python es el enfoque más escalable.
En la mayoría de los casos, los desarrolladores y equipos que manejan conversiones frecuentes se beneficiarán más de la automatización, mientras que los usuarios ocasionales pueden confiar en herramientas más simples.
Solución de Problemas Comunes de Excel a Markdown
Aunque convertir Excel a Markdown suele ser sencillo, puede encontrar algunos problemas comunes. Aquí hay soluciones prácticas:
| Problema | Solución |
|---|---|
| Una celda se convierte en varias filas | Los saltos de línea en las celdas de Excel se tratan como nuevas filas en Markdown. Reemplácelos con etiquetas <br> antes de convertir (buscar Ctrl+J, reemplazar con <br>). |
| Los datos se desplazan después de la conversión (columnas movidas) | Las celdas fusionadas en Excel rompen la estructura de la tabla. Desfusiona todas las celdas primero, luego rellena los valores faltantes para que cada fila esté completa. |
| Las celdas vacías se muestran como NaN | Algunos convertidores reemplazan los valores vacíos con NaN. Use Buscar y Reemplazar después de la conversión para eliminarlos o reemplazarlos con espacios en blanco. |
| Aparecen filas o columnas adicionales inesperadamente | Se incluyen filas o columnas ocultas en Excel. Desocúltelas o elimínelas antes de la conversión. |
Consejo Profesional: Siempre previsualice su tabla de Markdown después de la conversión para verificar la alineación y el formato.
Preguntas Frecuentes sobre Excel a Markdown
P1: ¿Puedo convertir Excel a Markdown gratis?
R1: Sí, las herramientas en línea como TableConvert permiten la conversión gratuita de Excel a Markdown, aunque pueden tener limitaciones en el tamaño del archivo o las funciones.
P2: ¿Puedo convertir fórmulas de Excel a Markdown?
R2: No, Markdown solo admite valores estáticos. Las fórmulas se convierten en sus resultados calculados.
P3: ¿Puedo convertir varios archivos de Excel a la vez?
R3: Sí, puede usar Python con bibliotecas como Spire.XLS para convertir por lotes varios archivos de Excel de manera eficiente.
P4: ¿Puedo mantener las imágenes al convertir Excel a Markdown?
R4: Markdown utiliza enlaces de imágenes en lugar de incrustar imágenes de Excel directamente.
P5: ¿Cuál es la forma más fácil de convertir Excel a Markdown?
R5: Usar un convertidor en línea es el método más fácil, ya que no requiere instalación.
Ver También
Excel in Markdown konvertieren: 4 einfache Methoden für jeden Workflow
Inhaltsverzeichnis
Excel ist ein leistungsstarkes Werkzeug zur Verwaltung und Analyse von Daten. Das Teilen von Tabellenkalkulationen in Blogs, Dokumentationen oder plattformübergreifenden Notiz-Apps führt jedoch oft zu Formatierungsproblemen und Kompatibilitätsproblemen. Die Konvertierung von Excel in Markdown bewahrt die Tabellenstruktur und macht Ihre Daten leichtgewichtig, lesbar und einfach plattformübergreifend teilbar.
In dieser Anleitung führen wir Sie durch 4 praktische Möglichkeiten, Excel in Markdown zu konvertieren, darunter Online-Tools, Editor-Plugins oder -Erweiterungen und Python-Automatisierung. Egal, ob Sie Student, Blogger oder Entwickler sind, Sie werden die Methode finden, die zu Ihrem Workflow passt.
Warum Excel in Markdown konvertieren?
Die Konvertierung von Excel in Markdown ist besonders nützlich, wenn Sie strukturierte Daten in einem sauberen, lesbaren Format veröffentlichen oder teilen müssen – ohne auf Tabellenkalkulationsdateien angewiesen zu sein.
Hier sind einige gängige Szenarien, in denen diese Konvertierung sinnvoll ist:
- Schreiben von technischen Blogs: Konvertieren Sie Excel-Tabellen in Markdown, um saubere, formatierte Tabellen direkt in Blogbeiträge einzubetten, ohne Screenshots oder Dateidownloads.
- Erstellen von GitHub README-Dateien: Markdown-Tabellen funktionieren nativ auf GitHub und erleichtern die Darstellung von Datensätzen, Vergleichen oder Konfigurationen.
- Pflege von Dokumentationen: Verwenden Sie Markdown-Tabellen in Dokumentationssystemen oder Wissensdatenbanken für eine konsistente Formatierung über verschiedene Plattformen hinweg.
- Arbeiten mit Versionskontrolle: Markdown-Dateien können in Git verfolgt werden, sodass Teams Datenänderungen im Laufe der Zeit überwachen können.
- Teilen von leichten Daten: Markdown ist einfacher Text, was das Teilen, Bearbeiten und Wiederverwenden im Vergleich zu Excel-Dateien erleichtert.
Können Sie Excel direkt in Markdown konvertieren?
Nein, Microsoft Excel bietet keine integrierte Option zum Exportieren von Daten im Markdown-Format. Dies liegt daran, dass Markdown-Tabellen eine einfache Textstruktur verwenden, die auf Pipes (|) und Trennzeilen basiert, während Excel Daten in einem strukturierten Tabellenkalkulationsformat speichert.
Um Excel in Markdown zu konvertieren, können Sie eine der folgenden Methoden verwenden:
- Excel schnell online in Markdown konvertieren (keine Installation)
- Obsidian Excel-zu-Markdown-Tabellen-Plugin verwenden
- Excel mit Erweiterungen in VS Code in Markdown konvertieren
- Excel-zu-Markdown-Konvertierung mit Python automatisieren
Nun werden wir jede Methode Schritt für Schritt aufschlüsseln.
Methode 1: Excel schnell online in Markdown konvertieren (keine Installation)
Eine der schnellsten Methoden zur Konvertierung von Excel in Markdown ist die Verwendung von Online-Konvertern. Diese Tools funktionieren auf jeder Plattform (Windows, Mac, Linux), erfordern keine Installation und sind ideal für Benutzer, die eine schnelle, browserbasierte Lösung wünschen.
Beliebte kostenlose Online-Excel-zu-Markdown-Konverter:
- TableConvert: Unterstützt das Hochladen von .xlsx-Dateien oder das Einfügen von Excel-Daten mit einem integrierten Editor zur Vorschau und Bearbeitung.
- Table to Markdown: Eine einfache Oberfläche, auf der Sie kopierte Excel-Tabellen einfügen, um eine formatierte Markdown-Tabelle zu generieren.
- CloudxDocs: Nützlich für die Konvertierung ganzer Excel-Dateien in herunterladbare Markdown-Dateien.
Schritte zur Online-Konvertierung von Excel in Markdown:
-
Rufen Sie die Website Ihres gewählten Online-Konverters auf, z. B. TableConvert.
-
Ziehen Sie Ihre .xlsx-Datei per Drag & Drop oder fügen Sie Ihre Excel-Daten in den dafür vorgesehenen Bereich ein.
-
Wählen Sie Markdown als Ausgabeformat. Das Tool konvertiert Ihre Excel-Datei oder Ihre Daten automatisch.
-
Kopieren Sie den generierten Markdown-Code und fügen Sie ihn in Ihre Markdown-Datei ein.
Nach der Konvertierung werden Ihre Excel-Daten wie folgt als Markdown-Tabelle angezeigt:
| Produkt | Preis | Lagerbestand |
|---------|-------|--------------|
| Apfel   | 1,2   | 50           |
| Orange  | 0,8   | 100          |
Tipp: Einige Online-Tools haben möglicherweise Beschränkungen für Dateigröße oder Tabellenlänge. Bei Bedarf können Sie Excel-Tabellen aufteilen, bevor Sie sie hochladen.
Sicherheitshinweis: Online-Tools zur Konvertierung von Excel in Markdown erfordern das Hochladen Ihrer Daten auf Server von Drittanbietern. Vermeiden Sie deren Verwendung für sensible oder vertrauliche Daten – erwägen Sie stattdessen eine Offline-Methode.
Wann verwenden: Geeignet für schnelle, einmalige Konvertierungen, insbesondere für kleine Tabellen oder wenn keine Installation gewünscht ist.
Wenn Sie Markdown zurück in Excel konvertieren müssen, lesen Sie unsere Anleitung, wie Sie Markdown in Excel konvertieren.
Methode 2: Obsidian Excel-zu-Markdown-Tabellen-Plugin verwenden
Obsidian ist eine kostenlose, plattformübergreifende (Windows, macOS und Linux) Markdown-Notiz-App. Mit dem Community-Plugin Excel to Markdown Table können Sie Excel-Daten schnell als Standard-Markdown-Tabellen konvertieren und einfügen, um sie nahtlos in Ihre Notizen zu integrieren.
Schritt-für-Schritt-Anleitung:
-
Laden Sie Obsidian von der offiziellen Website für Ihr Betriebssystem (Windows, Mac oder Linux) herunter und installieren Sie es.
-
Installieren Sie das Plugin Excel to Markdown Table:
- Öffnen Sie Obsidian und gehen Sie zu Einstellungen > Community-Plugins > Durchsuchen.
- Suchen Sie nach Excel to Markdown Table.
- Klicken Sie auf Installieren und dann auf Aktivieren.
-
Kopieren Sie Ihre Excel-Tabelle mit Strg+C (Windows) oder Cmd+C (Mac).
-
Fügen Sie sie mit Strg+V (Windows) oder Cmd+V (Mac) in Ihre Obsidian-Notiz ein. Das Plugin formatiert sie automatisch als Markdown-Tabelle.
-
Passen Sie die Ausrichtung oder Formatierung bei Bedarf in Obsidian an.
Tipps und Hinweise:
- Dieses Plugin konzentriert sich auf die Konvertierung von Tabellenstrukturen. Es kann komplexe Formatierungen innerhalb von Excel-Zellen (wie Fett oder Kursiv) möglicherweise nicht perfekt übertragen. Überprüfen Sie nach der Konvertierung und nehmen Sie bei Bedarf manuelle Anpassungen vor.
- Halten Sie das Plugin über das Verzeichnis der Obsidian-Community-Plugins auf dem neuesten Stand, um die beste Leistung und Sicherheit zu gewährleisten.
Wann verwenden: Ideal zum direkten Einbetten von Excel-Tabellen in Markdown-Notizen für Blogs, Dokumentationen oder Wissensdatenbanken.
Methode 3: Excel mit Erweiterungen in VS Code in Markdown konvertieren
Für Entwickler oder Power-User, die Visual Studio Code (VS Code) verwenden, bietet die Erweiterung Excel to Markdown Table eine schnelle und integrierte Möglichkeit, Excel-Daten in Markdown zu konvertieren, ohne Ihre Entwicklungsumgebung zu verlassen.
Schritt-für-Schritt-Anleitung:
-
Öffnen Sie VS Code, gehen Sie zu Erweiterungen (Strg+Umschalt+X), suchen Sie nach Excel to Markdown Table und klicken Sie auf Installieren.
-
Kopieren Sie die Excel-Daten (Strg+C / Cmd+C).
-
Öffnen Sie Ihre .md-Datei in VS Code und drücken Sie Umschalt + Alt + V, um die Tabelle im Markdown-Format einzufügen.
-
Optional: Passen Sie die Tabellenausrichtung mit Kopfzeilenpräfixen an:
- ^l - linksbündig
- ^c - zentriert
- ^r - rechtsbündig
-
Kopieren Sie die Markdown-Tabelle oder verwenden Sie sie nach Bedarf.
Tipps:
- Die Erweiterung behandelt Zeilenumbrüche in Excel-Zellen, indem sie automatisch <br>-Tags in die Markdown-Tabelle einfügt.
- Manuelle Anpassungen können erforderlich sein, wenn die Datenformatierung inkonsistent ist.
Wann verwenden: Ideal für Entwickler oder Power-User, die in VS Code arbeiten und einen schnelleren, integrierten Workflow wünschen.
Methode 4: Excel-zu-Markdown-Konvertierung mit Python automatisieren
Für Programmierer und Unternehmen, die eine schnelle, effiziente und Stapellösung benötigen, bietet die Python-Automatisierung eine skalierbare Lösung für die Excel-zu-Markdown-Konvertierung. Durch die Verwendung von Bibliotheken wie Spire.XLS für Python können Sie Dutzende oder Hunderte von Excel-Dateien schnell in saubere, strukturierte Markdown-Tabellen umwandeln und dabei die Formatierung beibehalten.
Warum Spire.XLS für Python
Spire.XLS ist eine robuste Python-Bibliothek, die die Excel-Automatisierung und Markdown-Konvertierung vereinfacht:
- Bewahrt die Formatierung: Behält Textstile und Links während der Excel-zu-Markdown-Konvertierung bei.
- Unterstützt mehrere Excel-Formate: Verarbeitet .xls-, .xlsx- und .xlsm-Dateien nahtlos.
- Erstellen und Schreiben von Excel-Dateien einfach: Erstellen Sie neue Excel-Dateien oder ändern Sie vorhandene programmgesteuert.
- Plattformübergreifend: Funktioniert unter Windows, Mac und Linux.
- Unabhängigkeit: Erfordert keine Installation von Microsoft Excel auf dem Rechner.
Installation
Um loszulegen, installieren Sie Spire.XLS für Python von PyPI, indem Sie den folgenden Befehl ausführen:
pip install spire.xls
Python-Skript für die Stapelkonvertierung von Excel in Markdown
Hier ist ein einfaches Beispiel, wie Sie mehrere Excel-Dateien in Markdown-Tabellen konvertieren können:
import os
from spire.xls import *

# Geben Sie die Pfade für Eingabe- und Ausgabeverzeichnisse an
input_folder = "pfad/zu/ihrem/excel_ordner"  # Ersetzen Sie dies durch Ihren Ordner mit Excel-Dateien
output_folder = "pfad/zum/ausgabe_markdown"   # Ersetzen Sie dies durch Ihren gewünschten Ausgabeordner für Markdown-Dateien

# Rufen Sie alle Excel-Dateien aus dem Eingabeordner ab
excel_files = [f for f in os.listdir(input_folder) if f.endswith('.xlsx')]

# Prüfen Sie, ob der Ausgabeordner existiert, wenn nicht, erstellen Sie ihn
if not os.path.exists(output_folder):
    os.makedirs(output_folder)

# Verarbeiten Sie jede Excel-Datei im Ordner
for file in excel_files:
    input_file_path = os.path.join(input_folder, file)

    # Erstellen Sie eine Workbook-Instanz und laden Sie die Excel-Datei
    workbook = Workbook()
    workbook.LoadFromFile(input_file_path)

    # Extrahieren Sie den Dateinamen ohne Erweiterung
    file_name_without_extension = os.path.splitext(file)[0]

    # Generieren Sie den Pfad zur Ausgabe-Markdown-Datei
    output_file_path = os.path.join(output_folder, f"{file_name_without_extension}.md")

    # Speichern Sie die Excel-Datei als .md-Datei
    workbook.SaveToMarkdown(output_file_path)

    # Geben Sie das Workbook-Objekt frei, um Ressourcen freizugeben
    workbook.Dispose()
    print(f"Konvertiert {file} nach {output_file_path}")
Dieses Skript scannt alle .xlsx-Dateien im angegebenen Eingabeordner und speichert sie als Markdown-Dateien im Ausgabeordner.
Tipps zur Anpassung
-
Anpassen der Markdown-Rendering-Optionen:
Sie können anpassen, wie die Markdown-Datei konvertiert wird, indem Sie Rendering-Optionen wie folgt anpassen:
# Erstellen von MarkdownOptions markdownOptions = MarkdownOptions() # Steuern, wie Bilder gespeichert werden markdownOptions.SavePicInRelativePath = False # Steuern, wie Hyperlinks gerendert werden markdownOptions.SaveHyperlinkAsRef = True # Als Markdown speichern workbook.SaveToMarkdown(output_file_path, markdownOptions) -
Verarbeiten von .xls-Dateien:
Das Skript kann modifiziert werden, um .xls-Dateien zu verarbeiten, indem einfach eine Prüfung auf .xlsx- und .xls-Erweiterungen hinzugefügt wird:
excel_files = [f for f in os.listdir(input_folder) if f.endswith(('.xlsx', '.xls'))]
Wann verwenden: Am besten für Entwickler, Daten-Ingenieure oder Teams, die eine automatisierte Stapelverarbeitung mehrerer Excel-Dateien benötigen.
Vergleich der Excel-zu-Markdown-Methoden
Um Ihnen bei der Auswahl der richtigen Methode zur Konvertierung von Excel in Markdown zu helfen, finden Sie hier einen schnellen Vergleich der vier Ansätze:
| Methode | Am besten geeignet für | Geschwindigkeit | Anpassung | Fähigkeitsniveau |
|---|---|---|---|---|
| Online-Tools | Schnelle, einmalige Konvertierungen | Schnell | Begrenzt | Anfänger |
| Obsidian-Plugin | Notizen & Dokumentation | Mittel | Mittel | Anfänger |
| VS Code-Erweiterung | Entwickler-Workflow | Schnell | Mittel | Fortgeschritten |
| Python-Automatisierung | Stapelverarbeitung | Sehr schnell | Hoch | Experte |
Empfehlungen:
- Benötigen Sie eine schnelle Lösung ohne Einrichtung? Online-Tools sind die schnellste Option.
- Für Notiz-Workflows bietet das Obsidian-Plugin eine reibungslose und intuitive Erfahrung.
- Arbeiten Sie bereits in einer VS Code-Entwicklungsumgebung? VS Code-Erweiterungen reduzieren Reibungsverluste und verbessern die Effizienz.
- Für große Datensätze oder wiederkehrende Aufgaben ist die Python-Automatisierung der skalierbarste Ansatz.
In den meisten Fällen profitieren Entwickler und Teams, die häufige Konvertierungen durchführen, mehr von der Automatisierung, während Gelegenheitsnutzer sich auf einfachere Tools verlassen können.
Fehlerbehebung bei gängigen Excel-zu-Markdown-Problemen
Obwohl die Konvertierung von Excel in Markdown normalerweise unkompliziert ist, können einige gängige Probleme auftreten. Hier sind praktische Lösungen:
| Problem | Lösung |
|---|---|
| Eine Zelle wird zu mehreren Zeilen | Zeilenumbrüche in Excel-Zellen werden in Markdown als neue Zeilen behandelt. Ersetzen Sie sie vor der Konvertierung durch <br>-Tags (suchen Sie nach Strg+J, ersetzen Sie durch <br>). |
| Daten verschieben sich nach der Konvertierung (Spalten verschoben) | Zusammengeführte Zellen in Excel brechen die Tabellenstruktur. Heben Sie zuerst alle Zellen auf und füllen Sie dann fehlende Werte auf, damit jede Zeile vollständig ist. |
| Leere Zellen werden als NaN angezeigt | Einige Konverter ersetzen leere Werte durch NaN. Verwenden Sie nach der Konvertierung Suchen & Ersetzen, um sie zu entfernen oder durch leere Felder zu ersetzen. |
| Unerwartet zusätzliche Zeilen oder Spalten erscheinen | Ausgeblendete Zeilen oder Spalten in Excel werden einbezogen. Blenden Sie sie aus oder löschen Sie sie vor der Konvertierung. |
Profi-Tipp: Überprüfen Sie Ihre Markdown-Tabelle immer nach der Konvertierung, um Ausrichtung und Formatierung zu überprüfen.
Häufig gestellte Fragen zu Excel zu Markdown
F1: Kann ich Excel kostenlos in Markdown konvertieren?
A1: Ja, Online-Tools wie TableConvert ermöglichen die kostenlose Konvertierung von Excel in Markdown, obwohl sie Einschränkungen bei der Dateigröße oder den Funktionen haben können.
F2: Kann ich Excel-Formeln in Markdown konvertieren?
A2: Nein, Markdown unterstützt nur statische Werte. Formeln werden in ihre berechneten Ergebnisse konvertiert.
F3: Kann ich mehrere Excel-Dateien auf einmal konvertieren?
A3: Ja, Sie können Python mit Bibliotheken wie Spire.XLS verwenden, um mehrere Excel-Dateien effizient stapelweise zu konvertieren.
F4: Kann ich Bilder beim Konvertieren von Excel in Markdown beibehalten?
A4: Markdown verwendet Bildlinks anstelle des direkten Einbettens von Excel-Bildern.
F5: Was ist der einfachste Weg, Excel in Markdown zu konvertieren?
A5: Die Verwendung eines Online-Konverters ist die einfachste Methode, da keine Installation erforderlich ist.
Siehe auch
Конвертируйте Excel в Markdown: 4 простых метода для любого рабочего процесса
Содержание
Excel — это мощный инструмент для управления и анализа данных, но при обмене электронными таблицами в блогах, документации или кроссплатформенных приложениях для заметок часто возникают проблемы с форматированием и совместимостью. Преобразование Excel в Markdown сохраняет структуру таблицы, делая ваши данные легкими, читаемыми и удобными для обмена между платформами.
В этом руководстве мы рассмотрим 4 практических способа преобразования Excel в Markdown, включая онлайн-инструменты, плагины или расширения для редакторов и автоматизацию с помощью Python. Независимо от того, студент вы, блогер или разработчик, вы найдете метод, который подойдет вашему рабочему процессу.
Зачем преобразовывать Excel в Markdown?
Преобразование Excel в Markdown особенно полезно, когда вам нужно опубликовать или поделиться структурированными данными в чистом, читаемом формате — без использования файлов электронных таблиц.
Вот несколько распространенных сценариев, когда такое преобразование имеет смысл:
- Написание технических блогов: Преобразуйте таблицы Excel в Markdown, чтобы вставлять чистые, отформатированные таблицы непосредственно в сообщения блога без скриншотов или загрузки файлов.
- Создание файлов README на GitHub: Таблицы Markdown работают нативно на GitHub, что упрощает представление наборов данных, сравнений или конфигураций.
- Ведение документации: Используйте таблицы Markdown в системах документации или базах знаний для единообразного форматирования на разных платформах.
- Работа с контролем версий: Файлы Markdown можно отслеживать в Git, что позволяет командам отслеживать изменения данных с течением времени.
- Обмен легкими данными: Markdown — это простой текст, что упрощает его обмен, редактирование и повторное использование по сравнению с файлами Excel.
Можно ли преобразовать Excel в Markdown напрямую?
Нет, Microsoft Excel не предоставляет встроенной опции для экспорта данных в формате Markdown. Это связано с тем, что таблицы Markdown используют структуру простого текста, основанную на символах вертикальной черты (|) и строках-разделителях, в то время как Excel хранит данные в структурированном формате электронной таблицы.
Для преобразования Excel в Markdown вы можете использовать один из следующих методов:
- Быстрое преобразование Excel в Markdown онлайн (без установки)
- Использование плагина Obsidian Excel to Markdown Table
- Преобразование Excel в Markdown в VS Code с помощью расширений
- Автоматизация преобразования Excel в Markdown с помощью Python
Теперь давайте подробно рассмотрим каждый метод.
Метод 1: Быстрое преобразование Excel в Markdown онлайн (без установки)
Одним из самых быстрых способов преобразования Excel в Markdown является использование онлайн-конвертеров. Эти инструменты работают на любой платформе (Windows, Mac, Linux), не требуют установки и идеально подходят для пользователей, которым нужно быстрое решение на основе браузера.
Популярные бесплатные онлайн-конвертеры Excel в Markdown:
- TableConvert: Поддерживает загрузку файлов .xlsx или вставку данных Excel с помощью встроенного редактора для предварительного просмотра и редактирования.
- Table to Markdown: Простой интерфейс, куда вы вставляете скопированные таблицы Excel для создания отформатированной таблицы Markdown.
- CloudxDocs: Полезен для преобразования целых файлов Excel в загружаемые файлы Markdown.
Шаги по преобразованию Excel в Markdown онлайн:
-
Перейдите на веб-сайт выбранного вами онлайн-конвертера, например TableConvert.
-
Перетащите файл .xlsx или вставьте данные Excel в указанную область.
-
Выберите Markdown в качестве выходного формата. Инструмент автоматически преобразует ваш файл или данные Excel.
-
Скопируйте сгенерированный код Markdown и вставьте его в свой файл Markdown.
После преобразования ваши данные Excel будут выглядеть как таблица Markdown:
| Продукт | Цена | В наличии |
|---------|-------|-------|
| Яблоко | 1.2 | 50 |
| Апельсин | 0.8 | 100 |
Совет: Некоторые онлайн-инструменты могут иметь ограничения по размеру файла или длине таблицы. При необходимости вы можете разделить листы Excel на более мелкие части перед загрузкой.
Предупреждение о безопасности: Онлайн-инструменты для преобразования Excel в Markdown требуют загрузки ваших данных на сторонние серверы. Избегайте их использования для конфиденциальных или секретных данных — вместо этого рассмотрите возможность использования офлайн-метода.
Когда использовать: Подходит для быстрых, разовых преобразований, особенно для небольших таблиц или когда установка не требуется.
Если вам нужно преобразовать Markdown обратно в Excel, ознакомьтесь с нашим руководством о том, как преобразовать Markdown в Excel.
Метод 2: Использование плагина Obsidian Excel to Markdown Table
Obsidian — это бесплатное кроссплатформенное (Windows, macOS и Linux) приложение для заметок в формате Markdown. С помощью плагина сообщества Excel to Markdown Table вы можете быстро преобразовывать и вставлять данные Excel в виде стандартных таблиц Markdown для бесшовной интеграции в ваши заметки.
Пошаговое руководство:
-
Загрузите и установите Obsidian с официального сайта для вашей операционной системы (Windows, Mac или Linux).
-
Установите плагин Excel to Markdown Table:
- Откройте Obsidian и перейдите в Настройки > Плагины сообщества > Обзор.
- Найдите Excel to Markdown Table.
- Нажмите Установить, а затем Включить.
-
Скопируйте таблицу Excel с помощью Ctrl+C (Windows) или Cmd+C (Mac).
-
Вставьте в свою заметку Obsidian с помощью Ctrl+V (Windows) или Cmd+V (Mac). Плагин автоматически отформатирует ее как таблицу Markdown.
-
При необходимости настройте выравнивание или форматирование в Obsidian.
Советы и примечания:
- Этот плагин фокусируется на преобразовании структур таблиц. Он может не идеально переносить сложное форматирование внутри ячеек Excel (например, полужирный или курсив). После преобразования проверьте и внесите ручные корректировки при необходимости.
- Поддерживайте плагин в актуальном состоянии через каталог плагинов сообщества Obsidian для лучшей производительности и безопасности.
Когда использовать: Идеально подходит для вставки таблиц Excel непосредственно в заметки Markdown для блогов, документации или баз знаний.
Метод 3: Преобразование Excel в Markdown в VS Code с помощью расширений
Для разработчиков или опытных пользователей, использующих Visual Studio Code (VS Code), расширение Excel to Markdown Table предоставляет быстрый и интегрированный способ преобразования данных Excel в Markdown, не покидая вашей среды разработки.
Пошаговые инструкции:
-
Откройте VS Code, перейдите в Расширения (Ctrl+Shift+X), найдите Excel to Markdown Table и нажмите Установить.
-
Скопируйте данные Excel (Ctrl+C / Cmd+C).
-
Откройте свой файл .md в VS Code и нажмите Shift + Alt + V, чтобы вставить таблицу в формате Markdown.
-
Необязательно: Настройте выравнивание таблицы с помощью префиксов заголовка:
- ^l — выравнивание по левому краю
- ^c — выравнивание по центру
- ^r — выравнивание по правому краю
-
Скопируйте или используйте таблицу Markdown по мере необходимости.
Советы:
- Расширение обрабатывает переносы строк в ячейках Excel, автоматически вставляя теги <br> в таблицу Markdown.
- Могут потребоваться ручные корректировки, если форматирование данных непоследовательно.
Когда использовать: Идеально подходит для разработчиков или опытных пользователей, работающих в VS Code, которым нужен более быстрый, интегрированный рабочий процесс.
Метод 4: Автоматизация преобразования Excel в Markdown с помощью Python
Для программистов и компаний, которым требуется быстрое, эффективное и пакетное решение, автоматизация с помощью Python предоставляет масштабируемое решение для преобразования Excel в Markdown. Используя такие библиотеки, как Spire.XLS для Python, вы можете быстро преобразовывать десятки или сотни файлов Excel в чистые, структурированные таблицы Markdown, сохраняя при этом форматирование.
Почему Spire.XLS для Python
Spire.XLS — это надежная библиотека Python, которая упрощает автоматизацию Excel и преобразование Markdown:
- Сохраняет форматирование: Сохраняет стили текста и ссылки при преобразовании Excel в Markdown.
- Поддерживает несколько форматов Excel: Бесшовно обрабатывает файлы .xls, .xlsx и .xlsm.
- Легко создавать и записывать файлы Excel: Создавайте новые файлы Excel или изменяйте существующие программно.
- Кроссплатформенность: Работает на Windows, Mac и Linux.
- Независимость: Не требует установки Microsoft Excel на компьютере.
Установка
Чтобы начать, установите Spire.XLS для Python из PyPI, выполнив следующую команду:
pip install spire.xls
Скрипт Python для пакетного преобразования Excel в Markdown
Вот простой пример того, как преобразовать несколько файлов Excel в таблицы Markdown:
import os
from spire.xls import *

# Укажите пути к входной и выходной папкам
input_folder = "path/to/your/excel_folder"  # Замените на папку с файлами Excel
output_folder = "path/to/output_markdown"   # Замените на желаемую выходную папку для файлов Markdown

# Получите все файлы Excel из входной папки
excel_files = [f for f in os.listdir(input_folder) if f.endswith('.xlsx')]

# Проверьте, существует ли выходная папка, если нет, создайте ее
if not os.path.exists(output_folder):
    os.makedirs(output_folder)

# Обработайте каждый файл Excel в папке
for file in excel_files:
    input_file_path = os.path.join(input_folder, file)

    # Создайте экземпляр Workbook и загрузите файл Excel
    workbook = Workbook()
    workbook.LoadFromFile(input_file_path)

    # Извлеките имя файла без расширения
    file_name_without_extension = os.path.splitext(file)[0]

    # Сгенерируйте путь к выходному файлу Markdown
    output_file_path = os.path.join(output_folder, f"{file_name_without_extension}.md")

    # Сохраните файл Excel как файл .md
    workbook.SaveToMarkdown(output_file_path)

    # Освободите объект workbook для освобождения ресурсов
    workbook.Dispose()
    print(f"Преобразовано {file} в {output_file_path}")
Этот скрипт сканирует все файлы .xlsx в указанной входной папке и сохраняет их как файлы Markdown в выходной папке.
Советы по настройке
-
Настройка параметров рендеринга Markdown:
Вы можете настроить, как будет преобразовываться файл Markdown, изменив параметры рендеринга:
# Создайте MarkdownOptions markdownOptions = MarkdownOptions() # Управление сохранением изображений markdownOptions.SavePicInRelativePath = False # Управление рендерингом гиперссылок markdownOptions.SaveHyperlinkAsRef = True # Сохранить как Markdown workbook.SaveToMarkdown(output_file_path, markdownOptions) -
Обработка файлов .xls:
Скрипт можно изменить для обработки файлов .xls, просто добавив проверку на расширения .xlsx и .xls:
excel_files = [f for f in os.listdir(input_folder) if f.endswith(('.xlsx', '.xls'))]
Когда использовать: Лучше всего подходит для разработчиков, инженеров данных или команд, которым требуется автоматизированная пакетная обработка нескольких файлов Excel.
Сравнение методов преобразования Excel в Markdown
Чтобы помочь вам выбрать правильный метод преобразования Excel в Markdown, вот краткое сравнение четырех подходов:
| Метод | Лучше всего подходит для | Скорость | Настройка | Уровень навыков |
|---|---|---|---|---|
| Онлайн-инструменты | Быстрые, разовые преобразования | Быстро | Ограниченно | Начинающий |
| Плагин Obsidian | Заметки и документация | Средне | Средне | Начинающий |
| Расширение VS Code | Рабочий процесс разработчика | Быстро | Средне | Средний |
| Автоматизация Python | Пакетная обработка | Очень быстро | Высокий | Продвинутый |
Рекомендации:
- Нужно быстрое решение без настройки? Онлайн-инструменты — самый быстрый вариант.
- Для рабочих процессов с заметками плагин Obsidian обеспечивает плавный и интуитивно понятный опыт.
- Уже работаете в среде разработки VS Code? Расширения VS Code уменьшают трение и повышают эффективность.
- Для больших наборов данных или повторяющихся задач автоматизация с помощью Python — наиболее масштабируемый подход.
В большинстве случаев разработчики и команды, занимающиеся частыми преобразованиями, получат больше пользы от автоматизации, в то время как обычные пользователи могут полагаться на более простые инструменты.
Устранение распространенных проблем с Excel в Markdown
Хотя преобразование Excel в Markdown обычно не вызывает затруднений, вы можете столкнуться с некоторыми распространенными проблемами. Вот практические решения:
| Проблема | Решение |
|---|---|
| Одна ячейка превращается в несколько строк | Переносы строк в ячейках Excel обрабатываются как новые строки в Markdown. Замените их тегами <br> перед преобразованием (найдите Ctrl+J, замените на <br>). |
| Данные смещаются после преобразования (столбцы перемещены) | Объединенные ячейки в Excel нарушают структуру таблицы. Сначала разбейте все ячейки, затем заполните недостающие значения, чтобы каждая строка была полной. |
| Пустые ячейки отображаются как NaN | Некоторые конвертеры заменяют пустые значения на NaN. Используйте "Найти и заменить" после преобразования, чтобы удалить их или заменить пустыми значениями. |
| Неожиданно появляются лишние строки или столбцы | Скрытые строки или столбцы в Excel включены. Раскройте или удалите их перед преобразованием. |
Профессиональный совет: Всегда предварительно просматривайте таблицу Markdown после преобразования, чтобы проверить выравнивание и форматирование.
Часто задаваемые вопросы о Excel в Markdown
В1: Можно ли преобразовать Excel в Markdown бесплатно?
О1: Да, онлайн-инструменты, такие как TableConvert, позволяют бесплатно преобразовывать Excel в Markdown, хотя они могут иметь ограничения по размеру файла или функциям.
В2: Можно ли преобразовать формулы Excel в Markdown?
О2: Нет, Markdown поддерживает только статические значения. Формулы преобразуются в их вычисленные результаты.
В3: Можно ли преобразовать несколько файлов Excel одновременно?
О3: Да, вы можете использовать Python с такими библиотеками, как Spire.XLS, для эффективного пакетного преобразования нескольких файлов Excel.
В4: Можно ли сохранять изображения при преобразовании Excel в Markdown?
О4: Markdown использует ссылки на изображения вместо прямого встраивания изображений Excel.
В5: Какой самый простой способ преобразовать Excel в Markdown?
О5: Использование онлайн-конвертера — самый простой метод, поскольку он не требует установки.
См. также
Converter SVG para PDF: 4 métodos fáceis (suporte para processamento em lote e mesclagem)
Sumário
- Método 1 — Converter SVG para PDF Online (Rápido e Sem Instalação)
- Método 2 — Converter SVG para PDF com Inkscape (Gratuito e Código Aberto)
- Método 3 — Converter SVG para PDF Usando o Recurso de Impressão do Navegador
- Método 4 — Converter SVG para PDF Usando Python (Em Lote e Mesclar)
- Comparar os Métodos
- Conclusão
- FAQs de SVG para PDF
Os arquivos SVG são amplamente utilizados em fluxos de trabalho de web e design porque são leves, escaláveis e independentes de resolução. No entanto, quando se trata de imprimir, compartilhar ou arquivar documentos, o PDF é frequentemente o formato preferido devido à sua compatibilidade universal.
Neste guia, você aprenderá quatro maneiras práticas de converter SVG para PDF, incluindo ferramentas online, software de desktop gratuito, conversão baseada em navegador e um poderoso método de automação Python para processamento único e em lote.
Visão geral dos métodos:
- Método 1 — Converter SVG para PDF Online (Rápido e Sem Instalação)
- Método 2 — Converter SVG para PDF com Inkscape (Gratuito e Código Aberto)
- Método 3 — Converter SVG para PDF Usando o Recurso de Impressão do Navegador
- Método 4 — Converter SVG para PDF Usando Python (Em Lote e Mesclar)
Método 1 — Converter SVG para PDF Online (Rápido e Sem Instalação)
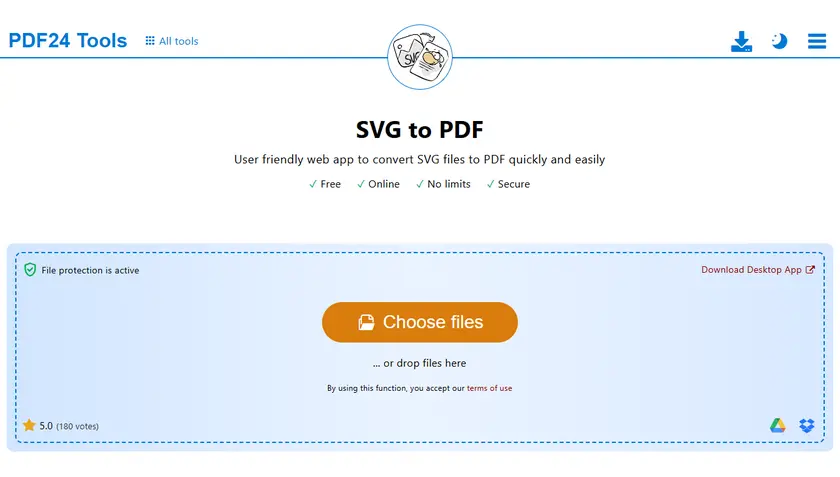
Conversores online de SVG para PDF são a maneira mais rápida de lidar com tarefas de conversão ocasionais sem instalar nenhum software. Essas ferramentas são especialmente úteis quando você está trabalhando em vários dispositivos ou precisa de um resultado rápido em qualquer lugar. Com apenas alguns cliques, você pode carregar seu arquivo SVG e baixar um PDF pronto para uso.
Ideal para: Conversões rápidas únicas
Passos:
- Carregue seu arquivo SVG em um conversor online (por exemplo, PDF24).
- Clique em Converter e, em seguida, baixe o resultado.
Prós:
- Nenhuma instalação necessária.
- Funciona em qualquer dispositivo.
- Rápido e conveniente.
Contras:
- Limitações de tamanho de arquivo.
- Não é adequado para arquivos sensíveis.
- Opções limitadas de personalização.
Método 2 — Converter SVG para PDF com Inkscape (Gratuito e Código Aberto)
O Inkscape oferece uma maneira poderosa e confiável de converter arquivos SVG para PDF, preservando a qualidade vetorial. Como um editor dedicado de gráficos vetoriais, ele oferece mais controle sobre o layout, dimensionamento e configurações de exportação em comparação com ferramentas online. Isso o torna uma ótima opção para designers ou usuários que precisam de resultados consistentes e de alta qualidade.
Ideal para: Designers e necessidades de conversão offline
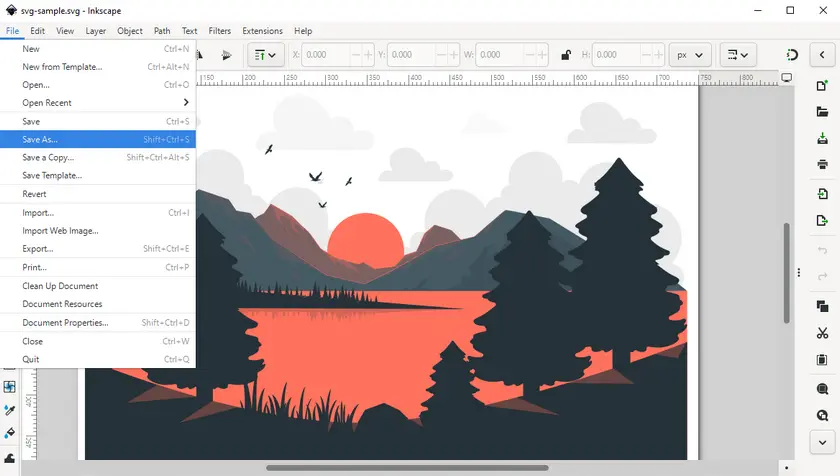
Passos:
- Baixe o Inkscape e instale-o em seu computador.
- Abra o arquivo SVG no Inkscape.
- Vá para Arquivo → Salvar como.
- Selecione o formato PDF.
- Ajuste as configurações de exportação, se necessário.
- Salve o arquivo.
Prós:
- Completamente gratuito.
- Saída vetorial de alta qualidade.
- Funciona offline.
Contras:
- Curva de aprendizado leve.
- A interface pode parecer complexa para iniciantes.
Método 3 — Converter SVG para PDF Usando o Recurso de Impressão do Navegador
Navegadores web modernos podem renderizar arquivos SVG diretamente, tornando-os uma ferramenta surpreendentemente eficaz para conversão rápida de PDF. Ao usar o recurso de impressão integrado, você pode exportar conteúdo SVG como PDF sem nenhum software adicional. Embora não seja o método mais preciso, é extremamente conveniente para casos de uso simples.
Ideal para: Conversão instantânea e leve
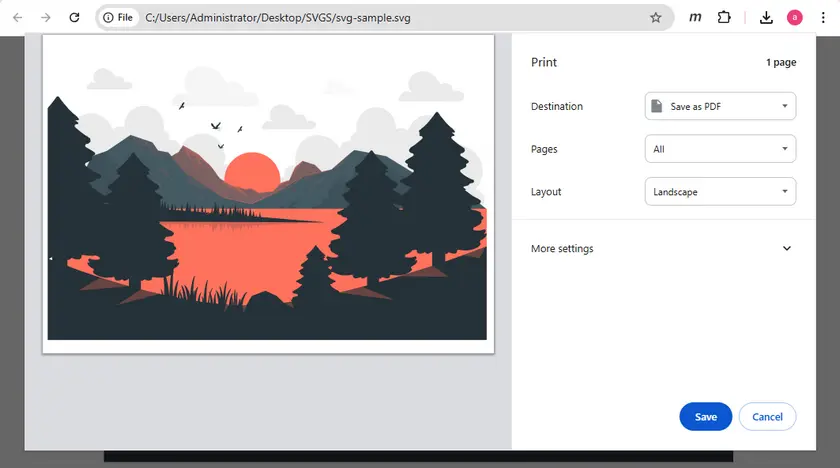
Passos:
- Abra o arquivo SVG em seu navegador.
- Pressione Ctrl + P (ou Cmd + P no Mac).
- Escolha Salvar como PDF.
- Ajuste a escala ou as margens, se necessário.
- Salve o arquivo.
Prós:
- Extremamente simples.
- Nenhuma ferramenta adicional necessária.
- Funciona instantaneamente.
Contras:
- Controle de layout limitado.
- A saída pode variar entre os navegadores.
Método 4 — Converter SVG para PDF Usando Python (Em Lote e Mesclar)
Para desenvolvedores ou equipes que lidam com grandes volumes de arquivos, Python oferece uma solução altamente eficiente e escalável. Essa abordagem permite automatizar a conversão de SVG para PDF e integrá-la a sistemas de backend ou fluxos de trabalho. É especialmente útil quando você precisa processar vários arquivos ou mesclá-los em um único PDF programaticamente.
Ideal para: Desenvolvedores, automação e processamento em lote
Neste cenário, usaremos o Spire.PDF for Python, uma biblioteca profissional para criar e manipular documentos PDF em Python. Antes de começar, instale-o do PyPI:
pip install spire.pdf
Exemplo 1. Converter um Único SVG para PDF
from spire.pdf.common import *
from spire.pdf import *

document = PdfDocument()
document.LoadFromSvg("svg-sample.svg")
document.SaveToFile("ToPdf.pdf", FileFormat.PDF)
document.Dispose()
Como funciona:
- LoadFromSvg() carrega o arquivo SVG em um objeto de documento PDF.
- SaveToFile() o exporta como PDF.
Exemplo 2. Mesclar Vários Arquivos SVG em um Único PDF
import os
from spire.pdf import *
from spire.pdf.common import *

svg_folder = r"C:\Users\Administrator\Desktop\SVGS"

# 1. Obter arquivos SVG ordenados
svg_files = sorted(f for f in os.listdir(svg_folder) if f.endswith(".svg"))

pdf_streams = []

# 2. Converter SVG → Fluxo PDF (em memória)
for f in svg_files:
    pdf = PdfDocument()
    pdf.LoadFromSvg(os.path.join(svg_folder, f))

    s = Stream()
    pdf.SaveToStream(s)
    pdf.Close()

    pdf_streams.append(s)

# 3. Mesclar fluxos PDF diretamente
merged = PdfDocument.MergeFiles(pdf_streams)

# 4. Salvar PDF final
output_path = os.path.join(svg_folder, "MergedSVG.pdf")
merged.Save(output_path, FileFormat.PDF)
merged.Close()
Como funciona:
- Todos os arquivos SVG são lidos da pasta e ordenados para manter uma ordem consistente.
- Cada SVG é carregado em um PdfDocument e convertido em um PDF na memória.
- Todos os fluxos PDF são passados diretamente para MergeFiles().
- O PDF mesclado final é salvo em disco.
Saída:
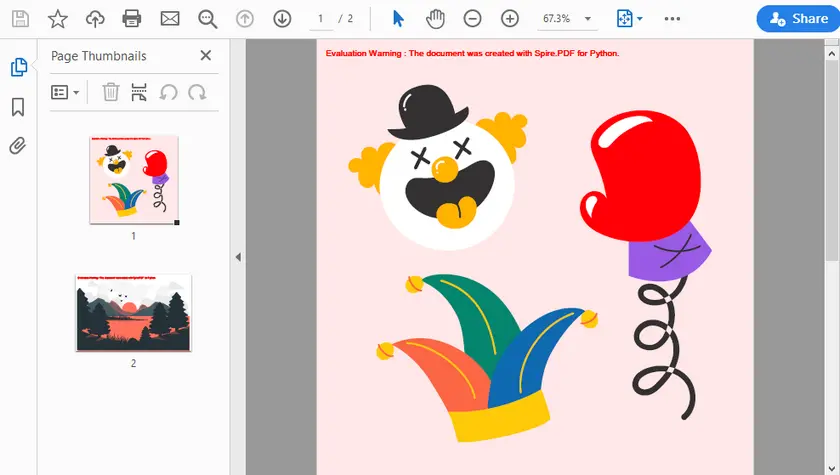
Por que usar Python para conversão de SVG para PDF?
- Fluxo de trabalho totalmente automatizado.
- Suporta processamento em lote.
- Fácil integração em sistemas de backend.
- Ideal para pipelines de geração de relatórios.
Além de converter arquivos SVG para PDF, você também pode explorar a conversão de PDF para SVG, que é útil quando você precisa extrair e reutilizar gráficos vetoriais de documentos PDF existentes. Você também pode tentar adicionar texto a PDF, o que permite inserir rótulos ou conteúdo dinâmico em arquivos gerados. Esses recursos adicionais ajudam a estender seu fluxo de trabalho de documentos além da simples conversão de formato.
Comparar os Métodos
| Método | Facilidade de Uso | Qualidade | Conversão em Lote (Múltiplos → Múltiplos) | Mesclar (Múltiplos → Um PDF) | Ideal Para |
|---|---|---|---|---|---|
| Ferramentas Online | ★★★★★ | ★★★★ | ✔ | ✘ | Tarefas rápidas |
| Inkscape | ★★★ | ★★★★★ | ✘ | ✘ | Designers |
| Navegador | ★★★★★ | ★★★ | ✘ | ✘ | Exportações simples |
| Python | ★★★ | ★★★★★ | ✔ | ✔ | Automação |
Conclusão
Converter SVG para PDF é simples e pode ser feito de várias maneiras, dependendo de suas necessidades. Ferramentas online e navegadores são ótimos para tarefas rápidas, enquanto o Inkscape oferece uma solução offline gratuita. Para desenvolvedores e usuários avançados, Python se destaca como a abordagem mais poderosa e escalável, especialmente para processamento em lote e automação.
FAQs de SVG para PDF
1. O SVG perderá qualidade ao converter para PDF?
Não. Tanto SVG quanto PDF são formatos baseados em vetores, portanto, a qualidade é preservada.
2. Posso mesclar vários arquivos SVG em um único PDF?
Sim. Você pode usar Python ou ferramentas avançadas para combinar vários SVGs em um único documento PDF.
3. A conversão online é segura?
Geralmente é seguro para arquivos não sensíveis, mas métodos de desktop ou locais são recomendados para dados confidenciais.
4. Qual método é o melhor no geral?
- Uso rápido → Ferramentas online
- Uso offline gratuito → Inkscape
- Exportação simples → Navegador
- Automação → Python
Veja Também
SVG를 PDF로 변환: 4가지 쉬운 방법 (일괄 처리 및 병합 지원)
SVG 파일은 가볍고, 확장 가능하며, 해상도에 독립적이어서 웹 및 디자인 워크플로우에서 널리 사용됩니다. 하지만 문서를 인쇄, 공유 또는 보관할 때는 보편적인 호환성 때문에 PDF가 종종 선호되는 형식입니다.
이 가이드에서는 온라인 도구, 무료 데스크톱 소프트웨어, 브라우저 기반 변환, 그리고 단일 및 일괄 처리를 위한 강력한 Python 자동화 방법을 포함하여 SVG를 PDF로 변환하는 4가지 실용적인 방법을 배우게 됩니다.
방법 개요:
- 방법 1 — SVG를 PDF로 온라인 변환 (빠르고 설치 불필요)
- 방법 2 — Inkscape로 SVG를 PDF로 변환 (무료 및 오픈 소스)
- 방법 3 — 브라우저 인쇄 기능을 사용하여 SVG를 PDF로 변환
- 방법 4 — Python을 사용하여 SVG를 PDF로 변환 (일괄 처리 및 병합)
방법 1 — SVG를 PDF로 온라인 변환 (빠르고 설치 불필요)
온라인 SVG-PDF 변환기는 소프트웨어 설치 없이 가끔 변환 작업을 처리하는 가장 빠른 방법입니다. 이 도구는 여러 장치에서 작업하거나 이동 중에 빠른 결과를 얻어야 할 때 특히 유용합니다. 몇 번의 클릭만으로 SVG 파일을 업로드하고 바로 사용할 수 있는 PDF를 다운로드할 수 있습니다.
적합 대상: 빠른 일회성 변환
단계:
- 온라인 변환기(예: PDF24)에 SVG 파일을 업로드합니다.
- 변환을 클릭한 다음 결과를 다운로드합니다.
장점:
- 설치 불필요.
- 모든 장치에서 작동.
- 빠르고 편리함.
단점:
- 파일 크기 제한.
- 민감한 파일에는 적합하지 않음.
- 제한된 사용자 정의 옵션.
방법 2 — Inkscape로 SVG를 PDF로 변환 (무료 및 오픈 소스)
Inkscape는 벡터 품질을 유지하면서 SVG 파일을 PDF로 변환하는 강력하고 신뢰할 수 있는 방법을 제공합니다. 전용 벡터 그래픽 편집기이므로 온라인 도구에 비해 레이아웃, 크기 조정 및 내보내기 설정에 대한 더 많은 제어를 제공합니다. 따라서 일관되고 고품질의 출력이 필요한 디자이너 또는 사용자에게 훌륭한 선택입니다.
적합 대상: 디자이너 및 오프라인 변환 요구 사항
단계:
- Inkscape를 다운로드하여 컴퓨터에 설치합니다.
- Inkscape에서 SVG 파일을 엽니다.
- 파일 → 다른 이름으로 저장으로 이동합니다.
- PDF 형식을 선택합니다.
- 필요한 경우 내보내기 설정을 조정합니다.
- 파일을 저장합니다.
장점:
- 완전 무료.
- 고품질 벡터 출력.
- 오프라인 작동.
단점:
방법 3 — 브라우저 인쇄 기능을 사용하여 SVG를 PDF로 변환
최신 웹 브라우저는 SVG 파일을 직접 렌더링할 수 있어 빠른 PDF 변환에 놀랍도록 효과적인 도구가 됩니다. 내장된 인쇄 기능을 사용하면 추가 소프트웨어 없이 SVG 콘텐츠를 PDF로 내보낼 수 있습니다. 가장 정확한 방법은 아니지만 간단한 사용 사례에는 매우 편리합니다.
적합 대상: 즉각적이고 가벼운 변환
단계:
- 브라우저에서 SVG 파일을 엽니다.
- Ctrl + P (Mac의 경우 Cmd + P)를 누릅니다.
- PDF로 저장을 선택합니다.
- 필요한 경우 배율 또는 여백을 조정합니다.
- 파일을 저장합니다.
장점:
- 매우 간단함.
- 추가 도구 불필요.
- 즉시 작동.
단점:
- 제한된 레이아웃 제어.
- 브라우저마다 출력이 다를 수 있음.
방법 4 — Python을 사용하여 SVG를 PDF로 변환 (일괄 처리 및 병합)
대량의 파일을 처리하는 개발자 또는 팀의 경우 Python은 매우 효율적이고 확장 가능한 솔루션을 제공합니다. 이 접근 방식을 사용하면 SVG-PDF 변환을 자동화하고 백엔드 시스템 또는 워크플로우에 통합할 수 있습니다. 여러 파일을 처리하거나 프로그래밍 방식으로 단일 PDF로 병합해야 할 때 특히 유용합니다.
적합 대상: 개발자, 자동화 및 대량 처리
이 시나리오에서는 Python에서 PDF 문서를 생성하고 조작하는 전문 라이브러리인 Spire.PDF for Python을 사용합니다. 시작하기 전에 PyPI에서 설치하십시오.
pip install spire.pdf
예제 1. 단일 SVG를 PDF로 변환
from spire.pdf.common import *
from spire.pdf import *

document = PdfDocument()
document.LoadFromSvg("svg-sample.svg")
document.SaveToFile("ToPdf.pdf", FileFormat.PDF)
document.Dispose()
작동 방식:
- LoadFromSvg()는 SVG 파일을 PDF 문서 객체로 로드합니다.
- SaveToFile()은 PDF로 내보냅니다.
예제 2. 여러 SVG 파일을 하나의 PDF로 병합
import os
from spire.pdf import *
from spire.pdf.common import *

svg_folder = r"C:\Users\Administrator\Desktop\SVGS"

# 1. 정렬된 SVG 파일 가져오기
svg_files = sorted(f for f in os.listdir(svg_folder) if f.endswith(".svg"))

pdf_streams = []

# 2. SVG → PDF 스트림으로 변환 (메모리 내)
for f in svg_files:
    pdf = PdfDocument()
    pdf.LoadFromSvg(os.path.join(svg_folder, f))

    s = Stream()
    pdf.SaveToStream(s)
    pdf.Close()

    pdf_streams.append(s)

# 3. PDF 스트림 직접 병합
merged = PdfDocument.MergeFiles(pdf_streams)

# 4. 최종 PDF 저장
output_path = os.path.join(svg_folder, "MergedSVG.pdf")
merged.Save(output_path, FileFormat.PDF)
merged.Close()
작동 방식:
- 모든 SVG 파일은 폴더에서 읽고 일관된 순서를 유지하기 위해 정렬됩니다.
- 각 SVG는 PdfDocument로 로드되고 메모리 내 PDF로 변환됩니다.
- 모든 PDF 스트림은 MergeFiles()로 직접 전달됩니다.
- 최종 병합된 PDF는 디스크에 저장됩니다.
출력:
Python으로 SVG를 PDF로 변환하는 이유는 무엇인가요?
- 완전 자동화된 워크플로우.
- 일괄 처리 지원.
- 백엔드 시스템과의 쉬운 통합.
- 보고서 생성 파이프라인에 이상적.
SVG 파일을 PDF로 변환하는 것 외에도 기존 PDF 문서에서 벡터 그래픽을 추출하고 재사용해야 할 때 유용한 PDF를 SVG로 변환하는 방법을 탐색할 수도 있습니다. 또한 생성된 파일에 레이블이나 동적 콘텐츠를 삽입할 수 있는 PDF에 텍스트 추가를 시도해 볼 수도 있습니다. 이러한 추가 기능은 단순한 형식 변환을 넘어 문서 워크플로우를 확장하는 데 도움이 됩니다.
방법 비교
| 방법 | 사용 편의성 | 품질 | 일괄 변환 (다수 → 다수) | 병합 (다수 → 단일 PDF) | 적합 대상 |
|---|---|---|---|---|---|
| 온라인 도구 | ★★★★★ | ★★★★ | ✔ | ✘ | 빠른 작업 |
| Inkscape | ★★★ | ★★★★★ | ✘ | ✘ | 디자이너 |
| 브라우저 | ★★★★★ | ★★★ | ✘ | ✘ | 간단한 내보내기 |
| Python | ★★★ | ★★★★★ | ✔ | ✔ | 자동화 |
결론
SVG를 PDF로 변환하는 것은 간단하며 필요에 따라 여러 가지 방법으로 수행할 수 있습니다. 온라인 도구와 브라우저는 빠른 작업에 적합하며, Inkscape는 무료 오프라인 솔루션을 제공합니다. 개발자와 고급 사용자의 경우 Python은 특히 일괄 처리 및 자동화에 있어 가장 강력하고 확장 가능한 접근 방식으로 두드러집니다.
SVG를 PDF로 FAQ
1. SVG를 PDF로 변환할 때 품질이 저하되나요?
아니요. SVG와 PDF는 모두 벡터 기반 형식이므로 품질이 유지됩니다.
2. 여러 SVG 파일을 하나의 PDF로 병합할 수 있나요?
예. Python 또는 고급 도구를 사용하여 여러 SVG를 단일 PDF 문서로 결합할 수 있습니다.
3. 온라인 변환은 안전한가요?
일반적으로 민감하지 않은 파일에는 안전하지만, 기밀 데이터의 경우 데스크톱 또는 로컬 방법을 사용하는 것이 좋습니다.
4. 어떤 방법이 전반적으로 가장 좋나요?
- 빠른 사용 → 온라인 도구
- 무료 오프라인 사용 → Inkscape
- 간단한 내보내기 → 브라우저
- 자동화 → Python
참고 자료
Convertire SVG in PDF: 4 semplici metodi (supporto per l'elaborazione batch e l'unione)
Indice
- Metodo 1 — Convertire SVG in PDF Online (Veloce e senza installazione)
- Metodo 2 — Convertire SVG in PDF con Inkscape (Gratuito e Open Source)
- Metodo 3 — Convertire SVG in PDF utilizzando la funzione di stampa del browser
- Metodo 4 — Convertire SVG in PDF utilizzando Python (Batch ed unione)
- Confronto tra i metodi
- Conclusione
- FAQ SVG in PDF
I file SVG sono ampiamente utilizzati nei flussi di lavoro web e di progettazione perché sono leggeri, scalabili e indipendenti dalla risoluzione. Tuttavia, quando si tratta di stampare, condividere o archiviare documenti, il PDF è spesso il formato preferito grazie alla sua compatibilità universale.
In questa guida, imparerai quattro modi pratici per convertire SVG in PDF, inclusi strumenti online, software desktop gratuiti, conversione basata su browser e un potente metodo di automazione Python per l'elaborazione singola e batch.
Panoramica dei metodi:
- Metodo 1 — Convertire SVG in PDF Online (Veloce e senza installazione)
- Metodo 2 — Convertire SVG in PDF con Inkscape (Gratuito e Open Source)
- Metodo 3 — Convertire SVG in PDF utilizzando la funzione di stampa del browser
- Metodo 4 — Convertire SVG in PDF utilizzando Python (Batch ed unione)
Metodo 1 — Convertire SVG in PDF Online (Veloce e senza installazione)
I convertitori online da SVG a PDF sono il modo più veloce per gestire attività di conversione occasionali senza installare alcun software. Questi strumenti sono particolarmente utili quando si lavora su più dispositivi o si necessita di un risultato rapido in movimento. Con pochi clic, puoi caricare il tuo file SVG e scaricare un PDF pronto all'uso.
Ideale per: Conversioni rapide una tantum
Passaggi:
- Carica il tuo file SVG su un convertitore online (ad es. PDF24).
- Fai clic su Converti, quindi scarica il risultato.
Pro:
- Nessuna installazione richiesta.
- Funziona su qualsiasi dispositivo.
- Veloce e conveniente.
Contro:
- Limitazioni sulla dimensione del file.
- Non adatto per file sensibili.
- Opzioni di personalizzazione limitate.
Metodo 2 — Convertire SVG in PDF con Inkscape (Gratuito e Open Source)
Inkscape offre un modo potente e affidabile per convertire file SVG in PDF preservando la qualità vettoriale. Essendo un editor di grafica vettoriale dedicato, ti offre un maggiore controllo su layout, ridimensionamento e impostazioni di esportazione rispetto agli strumenti online. Questo lo rende un'ottima scelta per designer o utenti che necessitano di risultati coerenti e di alta qualità.
Ideale per: Designer ed esigenze di conversione offline
Passaggi:
- Scarica Inkscape e installalo sul tuo computer.
- Apri il file SVG in Inkscape.
- Vai su File → Salva con nome.
- Seleziona il formato PDF.
- Regola le impostazioni di esportazione se necessario.
- Salva il file.
Pro:
- Completamente gratuito.
- Output vettoriale di alta qualità.
- Funziona offline.
Contro:
- Leggera curva di apprendimento.
- L'interfaccia potrebbe sembrare complessa per i principianti.
Metodo 3 — Convertire SVG in PDF utilizzando la funzione di stampa del browser
I moderni browser web possono renderizzare direttamente i file SVG, rendendoli uno strumento sorprendentemente efficace per una rapida conversione in PDF. Utilizzando la funzione di stampa integrata, puoi esportare il contenuto SVG come PDF senza alcun software aggiuntivo. Sebbene non sia il metodo più preciso, è estremamente conveniente per casi d'uso semplici.
Ideale per: Conversione istantanea e leggera
Passaggi:
- Apri il file SVG nel tuo browser.
- Premi Ctrl + P (o Cmd + P su Mac).
- Scegli Salva come PDF.
- Regola la scala o i margini se necessario.
- Salva il file.
Pro:
- Estremamente semplice.
- Nessuno strumento aggiuntivo richiesto.
- Funziona istantaneamente.
Contro:
- Controllo del layout limitato.
- L'output potrebbe variare tra i browser.
Metodo 4 — Convertire SVG in PDF utilizzando Python (Batch ed unione)
Per sviluppatori o team che gestiscono grandi volumi di file, Python offre una soluzione altamente efficiente e scalabile. Questo approccio ti consente di automatizzare la conversione da SVG a PDF e integrarla in sistemi backend o flussi di lavoro. È particolarmente utile quando è necessario elaborare più file o unirli in un unico PDF programmaticamente.
Ideale per: Sviluppatori, automazione ed elaborazione batch
In questo scenario, utilizzeremo Spire.PDF for Python, una libreria professionale per creare e manipolare documenti PDF in Python. Prima di iniziare, installala da PyPI:
pip install spire.pdf
Esempio 1. Convertire un singolo SVG in PDF
from spire.pdf.common import *
from spire.pdf import *

document = PdfDocument()
document.LoadFromSvg("svg-sample.svg")
document.SaveToFile("ToPdf.pdf", FileFormat.PDF)
document.Dispose()
Come funziona:
- LoadFromSvg() carica il file SVG in un oggetto documento PDF.
- SaveToFile() lo esporta come PDF.
Esempio 2. Unire più file SVG in un unico PDF
import os
from spire.pdf import *
from spire.pdf.common import *

svg_folder = r"C:\Users\Administrator\Desktop\SVGS"

# 1. Ottieni i file SVG ordinati
svg_files = sorted(f for f in os.listdir(svg_folder) if f.endswith(".svg"))

pdf_streams = []

# 2. Converti SVG → Stream PDF (in memoria)
for f in svg_files:
    pdf = PdfDocument()
    pdf.LoadFromSvg(os.path.join(svg_folder, f))

    s = Stream()
    pdf.SaveToStream(s)
    pdf.Close()

    pdf_streams.append(s)

# 3. Unisci direttamente gli stream PDF
merged = PdfDocument.MergeFiles(pdf_streams)

# 4. Salva il PDF finale
output_path = os.path.join(svg_folder, "MergedSVG.pdf")
merged.Save(output_path, FileFormat.PDF)
merged.Close()
Come funziona:
- Tutti i file SVG vengono letti dalla cartella e ordinati per mantenere un ordine coerente.
- Ogni SVG viene caricato in un PdfDocument e convertito in un PDF in memoria.
- Tutti gli stream PDF vengono passati direttamente a MergeFiles().
- Il PDF unito finale viene salvato su disco.
Output:
Perché usare Python per la conversione da SVG a PDF?
- Flusso di lavoro completamente automatizzato.
- Supporta l'elaborazione batch.
- Facile integrazione nei sistemi backend.
- Ideale per pipeline di generazione di report.
Oltre a convertire file SVG in PDF, puoi anche esplorare la conversione da PDF a SVG, utile quando è necessario estrarre e riutilizzare grafica vettoriale da documenti PDF esistenti. Potresti anche voler provare ad aggiungere testo al PDF, che ti consente di inserire etichette o contenuti dinamici nei file generati. Queste funzionalità aggiuntive aiutano ad estendere il tuo flusso di lavoro documentale oltre la semplice conversione di formato.
Confronto tra i metodi
| Metodo | Facilità d'uso | Qualità | Conversione Batch (Multi → Multi) | Unione (Multi → Un PDF) | Ideale per |
|---|---|---|---|---|---|
| Strumenti Online | ★★★★★ | ★★★★ | ✔ | ✘ | Attività rapide |
| Inkscape | ★★★ | ★★★★★ | ✘ | ✘ | Designer |
| Browser | ★★★★★ | ★★★ | ✘ | ✘ | Esportazioni semplici |
| Python | ★★★ | ★★★★★ | ✔ | ✔ | Automazione |
Conclusione
Convertire SVG in PDF è semplice e può essere fatto in diversi modi a seconda delle tue esigenze. Strumenti online e browser sono ottimi per attività rapide, mentre Inkscape offre una soluzione offline gratuita. Per sviluppatori e utenti avanzati, Python si distingue come l'approccio più potente e scalabile, specialmente per l'elaborazione batch e l'automazione.
FAQ SVG in PDF
1. SVG perderà qualità durante la conversione in PDF?
No. Sia SVG che PDF sono formati basati su vettori, quindi la qualità viene preservata.
2. Posso unire più file SVG in un unico PDF?
Sì. Puoi utilizzare Python o strumenti avanzati per combinare più SVG in un unico documento PDF.
3. La conversione online è sicura?
È generalmente sicura per file non sensibili, ma si consigliano metodi desktop o locali per dati riservati.
4. Qual è il metodo migliore in generale?
- Uso rapido → Strumenti online
- Uso offline gratuito → Inkscape
- Esportazione semplice → Browser
- Automazione → Python
Vedi anche
Convertir SVG en PDF : 4 méthodes simples (prise en charge du traitement par lots et de la fusion)
Table des matières
- Méthode 1 — Convertir SVG en PDF en ligne (Rapide et sans installation)
- Méthode 2 — Convertir SVG en PDF avec Inkscape (Gratuit et Open Source)
- Méthode 3 — Convertir SVG en PDF en utilisant la fonction d'impression du navigateur
- Méthode 4 — Convertir SVG en PDF en utilisant Python (Traitement par lots et fusion)
- Comparer les méthodes
- Conclusion
- FAQ SVG vers PDF
Les fichiers SVG sont largement utilisés dans les flux de travail web et de conception car ils sont légers, évolutifs et indépendants de la résolution. Cependant, lorsqu'il s'agit d'imprimer, de partager ou d'archiver des documents, le PDF est souvent le format privilégié en raison de sa compatibilité universelle.
Dans ce guide, vous apprendrez quatre méthodes pratiques pour convertir SVG en PDF, y compris des outils en ligne, un logiciel de bureau gratuit, la conversion basée sur le navigateur et une méthode d'automatisation Python puissante pour le traitement individuel et par lots.
Aperçu des méthodes :
- Méthode 1 — Convertir SVG en PDF en ligne (Rapide et sans installation)
- Méthode 2 — Convertir SVG en PDF avec Inkscape (Gratuit et Open Source)
- Méthode 3 — Convertir SVG en PDF en utilisant la fonction d'impression du navigateur
- Méthode 4 — Convertir SVG en PDF en utilisant Python (Traitement par lots et fusion)
Méthode 1 — Convertir SVG en PDF en ligne (Rapide et sans installation)
Les convertisseurs SVG vers PDF en ligne sont le moyen le plus rapide de gérer les tâches de conversion occasionnelles sans installer de logiciel. Ces outils sont particulièrement utiles lorsque vous travaillez sur différents appareils ou que vous avez besoin d'un résultat rapide en déplacement. En quelques clics, vous pouvez télécharger votre fichier SVG et télécharger un PDF prêt à l'emploi.
Idéal pour : Conversions rapides uniques
Étapes :
- Téléchargez votre fichier SVG sur un convertisseur en ligne (par exemple, PDF24).
- Cliquez sur Convertir, puis téléchargez le résultat.
Avantages :
- Aucune installation requise.
- Fonctionne sur n'importe quel appareil.
- Rapide et pratique.
Inconvénients :
- Limitations de taille de fichier.
- Ne convient pas aux fichiers sensibles.
- Options de personnalisation limitées.
Méthode 2 — Convertir SVG en PDF avec Inkscape (Gratuit et Open Source)
Inkscape offre un moyen puissant et fiable de convertir des fichiers SVG en PDF tout en préservant la qualité vectorielle. En tant qu'éditeur de graphiques vectoriels dédié, il vous donne plus de contrôle sur la mise en page, la mise à l'échelle et les paramètres d'exportation par rapport aux outils en ligne. Cela en fait un excellent choix pour les concepteurs ou les utilisateurs qui ont besoin d'un résultat cohérent et de haute qualité.
Idéal pour : Designers et besoins de conversion hors ligne
Étapes :
- Téléchargez Inkscape et installez-le sur votre ordinateur.
- Ouvrez le fichier SVG dans Inkscape.
- Allez dans Fichier → Enregistrer sous.
- Sélectionnez le format PDF.
- Ajustez les paramètres d'exportation si nécessaire.
- Enregistrez le fichier.
Avantages :
- Entièrement gratuit.
- Sortie vectorielle de haute qualité.
- Fonctionne hors ligne.
Inconvénients :
- Courbe d'apprentissage légère.
- L'interface peut sembler complexe pour les débutants.
Méthode 3 — Convertir SVG en PDF en utilisant la fonction d'impression du navigateur
Les navigateurs web modernes peuvent afficher directement les fichiers SVG, ce qui en fait un outil étonnamment efficace pour une conversion rapide en PDF. En utilisant la fonction d'impression intégrée, vous pouvez exporter le contenu SVG au format PDF sans aucun logiciel supplémentaire. Bien que ce ne soit pas la méthode la plus précise, elle est extrêmement pratique pour les cas d'utilisation simples.
Idéal pour : Conversion instantanée et légère
Étapes :
- Ouvrez le fichier SVG dans votre navigateur.
- Appuyez sur Ctrl + P (ou Cmd + P sur Mac).
- Choisissez Enregistrer au format PDF.
- Ajustez l'échelle ou les marges si nécessaire.
- Enregistrez le fichier.
Avantages :
- Extrêmement simple.
- Aucun outil supplémentaire requis.
- Fonctionne instantanément.
Inconvénients :
- Contrôle de mise en page limité.
- La sortie peut varier selon les navigateurs.
Méthode 4 — Convertir SVG en PDF en utilisant Python (Traitement par lots et fusion)
Pour les développeurs ou les équipes qui traitent de grands volumes de fichiers, Python offre une solution très efficace et évolutive. Cette approche vous permet d'automatiser la conversion SVG en PDF et de l'intégrer dans des systèmes backend ou des flux de travail. Elle est particulièrement utile lorsque vous devez traiter plusieurs fichiers ou les fusionner en un seul PDF par programmation.
Idéal pour : Développeurs, automatisation et traitement en masse
Dans ce scénario, nous utiliserons Spire.PDF pour Python, une bibliothèque professionnelle pour créer et manipuler des documents PDF en Python. Avant de commencer, installez-la depuis PyPI :
pip install spire.pdf
Exemple 1. Convertir un seul SVG en PDF
from spire.pdf.common import *
from spire.pdf import *

document = PdfDocument()
document.LoadFromSvg("svg-sample.svg")
document.SaveToFile("ToPdf.pdf", FileFormat.PDF)
document.Dispose()
Comment ça marche :
- LoadFromSvg() charge le fichier SVG dans un objet document PDF.
- SaveToFile() l'exporte en PDF.
Exemple 2. Fusionner plusieurs fichiers SVG en un seul PDF
import os
from spire.pdf import *
from spire.pdf.common import *

svg_folder = r"C:\Users\Administrator\Desktop\SVGS"

# 1. Obtenir les fichiers SVG triés
svg_files = sorted(f for f in os.listdir(svg_folder) if f.endswith(".svg"))

pdf_streams = []

# 2. Convertir SVG → Flux PDF (en mémoire)
for f in svg_files:
    pdf = PdfDocument()
    pdf.LoadFromSvg(os.path.join(svg_folder, f))

    s = Stream()
    pdf.SaveToStream(s)
    pdf.Close()

    pdf_streams.append(s)

# 3. Fusionner directement les flux PDF
merged = PdfDocument.MergeFiles(pdf_streams)

# 4. Enregistrer le PDF final
output_path = os.path.join(svg_folder, "MergedSVG.pdf")
merged.Save(output_path, FileFormat.PDF)
merged.Close()
Comment ça marche :
- Tous les fichiers SVG sont lus depuis le dossier et triés pour conserver un ordre cohérent.
- Chaque SVG est chargé dans un PdfDocument et converti en PDF en mémoire.
- Tous les flux PDF sont passés directement à MergeFiles().
- Le PDF fusionné final est enregistré sur disque.
Sortie :
Pourquoi utiliser Python pour la conversion SVG en PDF ?
- Flux de travail entièrement automatisé.
- Prend en charge le traitement par lots.
- Intégration facile dans les systèmes backend.
- Idéal pour les pipelines de génération de rapports.
En plus de convertir des fichiers SVG en PDF, vous pouvez également explorer la conversion de PDF en SVG, ce qui est utile lorsque vous devez extraire et réutiliser des graphiques vectoriels à partir de documents PDF existants. Vous pourriez également vouloir essayer d'ajouter du texte à un PDF, ce qui vous permet d'insérer des étiquettes ou du contenu dynamique dans les fichiers générés. Ces fonctionnalités supplémentaires aident à étendre votre flux de travail documentaire au-delà de la simple conversion de format.
Comparer les méthodes
| Méthode | Facilité d'utilisation | Qualité | Conversion par lots (Multi → Multi) | Fusion (Multi → Un PDF) | Idéal pour |
|---|---|---|---|---|---|
| Outils en ligne | ★★★★★ | ★★★★ | ✔ | ✘ | Tâches rapides |
| Inkscape | ★★★ | ★★★★★ | ✘ | ✘ | Designers |
| Navigateur | ★★★★★ | ★★★ | ✘ | ✘ | Exportations simples |
| Python | ★★★ | ★★★★★ | ✔ | ✔ | Automatisation |
Conclusion
La conversion de SVG en PDF est simple et peut être effectuée de plusieurs manières selon vos besoins. Les outils en ligne et les navigateurs sont parfaits pour les tâches rapides, tandis qu'Inkscape offre une solution hors ligne gratuite. Pour les développeurs et les utilisateurs avancés, Python se distingue comme l'approche la plus puissante et la plus évolutive, en particulier pour le traitement par lots et l'automatisation.
FAQ SVG vers PDF
1. Le SVG perdra-t-il de la qualité lors de la conversion en PDF ?
Non. Le SVG et le PDF sont des formats basés sur des vecteurs, la qualité est donc préservée.
2. Puis-je fusionner plusieurs fichiers SVG en un seul PDF ?
Oui. Vous pouvez utiliser Python ou des outils avancés pour combiner plusieurs SVG en un seul document PDF.
3. La conversion en ligne est-elle sûre ?
Elle est généralement sûre pour les fichiers non sensibles, mais les méthodes de bureau ou locales sont recommandées pour les données confidentielles.
4. Quelle méthode est la meilleure dans l'ensemble ?
- Utilisation rapide → Outils en ligne
- Utilisation hors ligne gratuite → Inkscape
- Exportation simple → Navigateur
- Automatisation → Python
Voir aussi
Convertir SVG a PDF: 4 métodos sencillos (compatible con procesamiento por lotes y combinación)
Tabla de Contenidos
- Método 1 — Convertir SVG a PDF en Línea (Rápido y Sin Instalación)
- Método 2 — Convertir SVG a PDF con Inkscape (Gratis y de Código Abierto)
- Método 3 — Convertir SVG a PDF Usando la Función de Impresión del Navegador
- Método 4 — Convertir SVG a PDF Usando Python (Por Lotes y Combinar)
- Comparar los Métodos
- Conclusión
- Preguntas Frecuentes sobre SVG a PDF
Los archivos SVG se utilizan ampliamente en flujos de trabajo web y de diseño porque son ligeros, escalables e independientes de la resolución. Sin embargo, cuando se trata de imprimir, compartir o archivar documentos, el PDF es a menudo el formato preferido debido a su compatibilidad universal.
En esta guía, aprenderá cuatro formas prácticas de convertir SVG a PDF, incluyendo herramientas en línea, software de escritorio gratuito, conversión basada en navegador y un potente método de automatización con Python para procesamiento individual y por lotes.
Resumen de los métodos:
- Método 1 — Convertir SVG a PDF en Línea (Rápido y Sin Instalación)
- Método 2 — Convertir SVG a PDF con Inkscape (Gratis y de Código Abierto)
- Método 3 — Convertir SVG a PDF Usando la Función de Impresión del Navegador
- Método 4 — Convertir SVG a PDF Usando Python (Por Lotes y Combinar)
Método 1 — Convertir SVG a PDF en Línea (Rápido y Sin Instalación)
Los convertidores de SVG a PDF en línea son la forma más rápida de manejar tareas de conversión ocasionales sin instalar ningún software. Estas herramientas son especialmente útiles cuando trabaja en varios dispositivos o necesita un resultado rápido sobre la marcha. Con solo unos pocos clics, puede cargar su archivo SVG y descargar un PDF listo para usar.
Ideal para: Conversiones rápidas de un solo uso
Pasos:
- Cargue su archivo SVG en un convertidor en línea (por ejemplo, PDF24).
- Haga clic en Convertir y luego descargue el resultado.
Ventajas:
- No requiere instalación.
- Funciona en cualquier dispositivo.
- Rápido y conveniente.
Desventajas:
- Limitaciones de tamaño de archivo.
- No apto para archivos confidenciales.
- Opciones de personalización limitadas.
Método 2 — Convertir SVG a PDF con Inkscape (Gratis y de Código Abierto)
Inkscape proporciona una forma potente y fiable de convertir archivos SVG a PDF conservando la calidad vectorial. Como editor dedicado de gráficos vectoriales, le ofrece más control sobre la disposición, el escalado y la configuración de exportación en comparación con las herramientas en línea. Esto lo convierte en una excelente opción para diseñadores o usuarios que necesitan resultados consistentes y de alta calidad.
Ideal para: Diseñadores y necesidades de conversión sin conexión
Pasos:
- Descargue Inkscape e instálelo en su computadora.
- Abra el archivo SVG en Inkscape.
- Vaya a Archivo → Guardar como.
- Seleccione el formato PDF.
- Ajuste la configuración de exportación si es necesario.
- Guarde el archivo.
Ventajas:
- Completamente gratis.
- Salida vectorial de alta calidad.
- Funciona sin conexión.
Desventajas:
- Ligera curva de aprendizaje.
- La interfaz puede parecer compleja para principiantes.
Método 3 — Convertir SVG a PDF Usando la Función de Impresión del Navegador
Los navegadores web modernos pueden renderizar archivos SVG directamente, lo que los convierte en una herramienta sorprendentemente eficaz para la conversión rápida a PDF. Al utilizar la función de impresión integrada, puede exportar contenido SVG como PDF sin ningún software adicional. Si bien no es el método más preciso, es extremadamente conveniente para casos de uso simples.
Ideal para: Conversión instantánea y ligera
Pasos:
- Abra el archivo SVG en su navegador.
- Presione Ctrl + P (o Cmd + P en Mac).
- Seleccione Guardar como PDF.
- Ajuste la escala o los márgenes si es necesario.
- Guarde el archivo.
Ventajas:
- Extremadamente simple.
- No se requieren herramientas adicionales.
- Funciona al instante.
Desventajas:
- Control de diseño limitado.
- La salida puede variar entre navegadores.
Método 4 — Convertir SVG a PDF Usando Python (Por Lotes y Combinar)
Para desarrolladores o equipos que manejan grandes volúmenes de archivos, Python ofrece una solución altamente eficiente y escalable. Este enfoque le permite automatizar la conversión de SVG a PDF e integrarla en sistemas o flujos de trabajo de backend. Es especialmente útil cuando necesita procesar varios archivos o combinarlos en un solo PDF mediante programación.
Ideal para: Desarrolladores, automatización y procesamiento masivo
En este escenario, utilizaremos Spire.PDF para Python, una biblioteca profesional para crear y manipular documentos PDF en Python. Antes de comenzar, instálela desde PyPI:
pip install spire.pdf
Ejemplo 1. Convertir un solo SVG a PDF
from spire.pdf.common import *
from spire.pdf import *

document = PdfDocument()
document.LoadFromSvg("svg-sample.svg")
document.SaveToFile("ToPdf.pdf", FileFormat.PDF)
document.Dispose()
Cómo funciona:
- LoadFromSvg() carga el archivo SVG en un objeto de documento PDF.
- SaveToFile() lo exporta como PDF.
Ejemplo 2. Combinar varios archivos SVG en un solo PDF
import os
from spire.pdf import *
from spire.pdf.common import *

svg_folder = r"C:\Users\Administrator\Desktop\SVGS"

# 1. Obtener archivos SVG ordenados
svg_files = sorted(f for f in os.listdir(svg_folder) if f.endswith(".svg"))

pdf_streams = []

# 2. Convertir SVG → Flujo PDF (en memoria)
for f in svg_files:
    pdf = PdfDocument()
    pdf.LoadFromSvg(os.path.join(svg_folder, f))

    s = Stream()
    pdf.SaveToStream(s)
    pdf.Close()

    pdf_streams.append(s)

# 3. Combinar flujos PDF directamente
merged = PdfDocument.MergeFiles(pdf_streams)

# 4. Guardar el PDF final
output_path = os.path.join(svg_folder, "MergedSVG.pdf")
merged.Save(output_path, FileFormat.PDF)
merged.Close()
Cómo funciona:
- Todos los archivos SVG se leen de la carpeta y se ordenan para mantener un orden consistente.
- Cada SVG se carga en un PdfDocument y se convierte en un PDF en memoria.
- Todos los flujos PDF se pasan directamente a MergeFiles().
- El PDF combinado final se guarda en disco.
Salida:
¿Por qué usar Python para la conversión de SVG a PDF?
- Flujo de trabajo totalmente automatizado.
- Soporta procesamiento por lotes.
- Fácil integración en sistemas de backend.
- Ideal para canalizaciones de generación de informes.
Además de convertir archivos SVG a PDF, también puede explorar la conversión de PDF a SVG, que es útil cuando necesita extraer y reutilizar gráficos vectoriales de documentos PDF existentes. También puede probar a añadir texto a PDF, lo que le permite insertar etiquetas o contenido dinámico en los archivos generados. Estas funciones adicionales ayudan a ampliar su flujo de trabajo de documentos más allá de la simple conversión de formatos.
Comparar los Métodos
| Método | Facilidad de Uso | Calidad | Conversión por Lotes (Múltiple → Múltiple) | Combinar (Múltiple → Un PDF) | Ideal Para |
|---|---|---|---|---|---|
| Herramientas en Línea | ★★★★★ | ★★★★ | ✔ | ✘ | Tareas rápidas |
| Inkscape | ★★★ | ★★★★★ | ✘ | ✘ | Diseñadores |
| Navegador | ★★★★★ | ★★★ | ✘ | ✘ | Exportaciones simples |
| Python | ★★★ | ★★★★★ | ✔ | ✔ | Automatización |
Conclusión
Convertir SVG a PDF es sencillo y se puede hacer de varias maneras según sus necesidades. Las herramientas en línea y los navegadores son excelentes para tareas rápidas, mientras que Inkscape ofrece una solución gratuita sin conexión. Para desarrolladores y usuarios avanzados, Python destaca como el enfoque más potente y escalable, especialmente para el procesamiento por lotes y la automatización.
Preguntas Frecuentes sobre SVG a PDF
1. ¿Perderá calidad el SVG al convertirse a PDF?
No. Tanto SVG como PDF son formatos basados en vectores, por lo que la calidad se conserva.
2. ¿Puedo combinar varios archivos SVG en un solo PDF?
Sí. Puede usar Python o herramientas avanzadas para combinar varios SVG en un solo documento PDF.
3. ¿Es segura la conversión en línea?
Generalmente es seguro para archivos no confidenciales, pero se recomiendan métodos de escritorio o locales para datos confidenciales.
4. ¿Qué método es el mejor en general?
- Uso rápido → Herramientas en línea
- Uso sin conexión gratuito → Inkscape
- Exportación simple → Navegador
- Automatización → Python
Ver también
SVG in PDF konvertieren: 4 einfache Methoden (Batch-Verarbeitung & Zusammenführen unterstützt)
Inhaltsverzeichnis
- Methode 1 — SVG in PDF online konvertieren (Schnell & Keine Installation)
- Methode 2 — SVG in PDF mit Inkscape konvertieren (Kostenlos & Open Source)
- Methode 3 — SVG mit der Browser-Druckfunktion in PDF konvertieren
- Methode 4 — SVG mit Python in PDF konvertieren (Stapelverarbeitung & Zusammenführen)
- Methoden vergleichen
- Fazit
- SVG zu PDF FAQs
SVG-Dateien werden häufig in Web- und Design-Workflows verwendet, da sie leicht, skalierbar und auflösungsunabhängig sind. Wenn es jedoch um das Drucken, Teilen oder Archivieren von Dokumenten geht, ist PDF oft das bevorzugte Format aufgrund seiner universellen Kompatibilität.
In dieser Anleitung lernen Sie vier praktische Möglichkeiten, SVG in PDF zu konvertieren, darunter Online-Tools, kostenlose Desktop-Software, browserbasierte Konvertierung und eine leistungsstarke Python-Automatisierungsmethode für die Einzel- und Stapelverarbeitung.
Methodenübersicht:
- Methode 1 — SVG in PDF online konvertieren (Schnell & Keine Installation)
- Methode 2 — SVG in PDF mit Inkscape konvertieren (Kostenlos & Open Source)
- Methode 3 — SVG mit der Browser-Druckfunktion in PDF konvertieren
- Methode 4 — SVG mit Python in PDF konvertieren (Stapelverarbeitung & Zusammenführen)
Methode 1 — SVG in PDF online konvertieren (Schnell & Keine Installation)
Online-Konverter von SVG zu PDF sind der schnellste Weg, um gelegentliche Konvertierungsaufgaben ohne Installation von Software zu erledigen. Diese Tools sind besonders nützlich, wenn Sie geräteübergreifend arbeiten oder unterwegs ein schnelles Ergebnis benötigen. Mit nur wenigen Klicks können Sie Ihre SVG-Datei hochladen und eine gebrauchsfertige PDF-Datei herunterladen.
Am besten geeignet für: Schnelle einmalige Konvertierungen
Schritte:
- Laden Sie Ihre SVG-Datei auf einen Online-Konverter hoch (z. B. PDF24).
- Klicken Sie auf Konvertieren und laden Sie das Ergebnis herunter.
Vorteile:
- Keine Installation erforderlich.
- Funktioniert auf jedem Gerät.
- Schnell und bequem.
Nachteile:
- Dateigrößenbeschränkungen.
- Nicht für sensible Dateien geeignet.
- Begrenzte Anpassungsoptionen.
Methode 2 — SVG in PDF mit Inkscape konvertieren (Kostenlos & Open Source)
Inkscape bietet eine leistungsstarke und zuverlässige Möglichkeit, SVG-Dateien in PDF zu konvertieren und dabei die Vektorqualität zu erhalten. Als dedizierter Vektorgrafikeditor bietet es mehr Kontrolle über Layout, Skalierung und Exporteinstellungen im Vergleich zu Online-Tools. Dies macht es zu einer ausgezeichneten Wahl für Designer oder Benutzer, die konsistente, qualitativ hochwertige Ergebnisse benötigen.
Am besten geeignet für: Designer und Offline-Konvertierungsanforderungen
Schritte:
- Laden Sie Inkscape herunter und installieren Sie es auf Ihrem Computer.
- Öffnen Sie die SVG-Datei in Inkscape.
- Gehen Sie zu Datei → Speichern unter.
- Wählen Sie das PDF-Format.
- Passen Sie bei Bedarf die Exporteinstellungen an.
- Speichern Sie die Datei.
Vorteile:
- Vollständig kostenlos.
- Hochwertige Vektorausgabe.
- Funktioniert offline.
Nachteile:
- Leichte Lernkurve.
- Die Benutzeroberfläche kann für Anfänger komplex erscheinen.
Methode 3 — SVG mit der Browser-Druckfunktion in PDF konvertieren
Moderne Webbrowser können SVG-Dateien direkt rendern, was sie zu einem überraschend effektiven Werkzeug für die schnelle PDF-Konvertierung macht. Durch die Verwendung der integrierten Druckfunktion können Sie SVG-Inhalte als PDF exportieren, ohne zusätzliche Software zu benötigen. Obwohl es nicht die präziseste Methode ist, ist sie für einfache Anwendungsfälle äußerst praktisch.
Am besten geeignet für: Sofortige und leichte Konvertierung
Schritte:
- Öffnen Sie die SVG-Datei in Ihrem Browser.
- Drücken Sie Strg + P (oder Cmd + P auf dem Mac).
- Wählen Sie Als PDF speichern.
- Passen Sie bei Bedarf die Skalierung oder die Ränder an.
- Speichern Sie die Datei.
Vorteile:
- Extrem einfach.
- Keine zusätzlichen Tools erforderlich.
- Funktioniert sofort.
Nachteile:
- Begrenzte Layoutkontrolle.
- Die Ausgabe kann je nach Browser variieren.
Methode 4 — SVG mit Python in PDF konvertieren (Stapelverarbeitung & Zusammenführen)
Für Entwickler oder Teams, die große Mengen an Dateien verarbeiten, bietet Python eine hocheffiziente und skalierbare Lösung. Dieser Ansatz ermöglicht es Ihnen, die Konvertierung von SVG in PDF zu automatisieren und in Backend-Systeme oder Workflows zu integrieren. Dies ist besonders nützlich, wenn Sie mehrere Dateien verarbeiten oder sie programmatisch zu einer einzigen PDF-Datei zusammenführen müssen.
Am besten geeignet für: Entwickler, Automatisierung und Stapelverarbeitung
In diesem Szenario verwenden wir Spire.PDF für Python, eine professionelle Bibliothek zum Erstellen und Bearbeiten von PDF-Dokumenten in Python. Installieren Sie sie vor Beginn von PyPI:
pip install spire.pdf
Beispiel 1. Eine einzelne SVG-Datei in PDF konvertieren
from spire.pdf.common import *
from spire.pdf import *

document = PdfDocument()
document.LoadFromSvg("svg-sample.svg")
document.SaveToFile("ToPdf.pdf", FileFormat.PDF)
document.Dispose()
Funktionsweise:
- LoadFromSvg() lädt die SVG-Datei in ein PDF-Dokumentobjekt.
- SaveToFile() exportiert es als PDF.
Beispiel 2. Mehrere SVG-Dateien zu einer PDF zusammenführen
import os
from spire.pdf import *
from spire.pdf.common import *

svg_folder = r"C:\Users\Administrator\Desktop\SVGS"

# 1. Sortierte SVG-Dateien abrufen
svg_files = sorted(f for f in os.listdir(svg_folder) if f.endswith(".svg"))

pdf_streams = []

# 2. SVG → PDF-Stream konvertieren (im Speicher)
for f in svg_files:
    pdf = PdfDocument()
    pdf.LoadFromSvg(os.path.join(svg_folder, f))

    s = Stream()
    pdf.SaveToStream(s)
    pdf.Close()

    pdf_streams.append(s)

# 3. PDF-Streams direkt zusammenführen
merged = PdfDocument.MergeFiles(pdf_streams)

# 4. Finale PDF speichern
output_path = os.path.join(svg_folder, "MergedSVG.pdf")
merged.Save(output_path, FileFormat.PDF)
merged.Close()
Funktionsweise:
- Alle SVG-Dateien werden aus dem Ordner gelesen und sortiert, um eine konsistente Reihenfolge beizubehalten.
- Jede SVG wird in ein PdfDocument geladen und im Speicher in eine PDF-Datei konvertiert.
- Alle PDF-Streams werden direkt an MergeFiles() übergeben.
- Die endgültige zusammengeführte PDF-Datei wird auf der Festplatte gespeichert.
Ausgabe:
Warum Python für die SVG-zu-PDF-Konvertierung verwenden?
- Vollständig automatisierter Workflow.
- Unterstützt Stapelverarbeitung.
- Einfache Integration in Backend-Systeme.
- Ideal für Report-Generierungs-Pipelines.
Zusätzlich zur Konvertierung von SVG-Dateien in PDF können Sie auch die Konvertierung von PDF in SVG untersuchen, was nützlich ist, wenn Sie Vektorgrafiken aus vorhandenen PDF-Dokumenten extrahieren und wiederverwenden müssen. Möglicherweise möchten Sie auch versuchen, Text zu PDF hinzuzufügen, was es Ihnen ermöglicht, Beschriftungen oder dynamische Inhalte in generierte Dateien einzufügen. Diese zusätzlichen Funktionen helfen, Ihren Dokumenten-Workflow über die einfache Formatkonvertierung hinaus zu erweitern.
Methoden vergleichen
| Methode | Benutzerfreundlichkeit | Qualität | Stapelverarbeitung (Mehrere → Mehrere) | Zusammenführen (Mehrere → Eine PDF) | Am besten geeignet für |
|---|---|---|---|---|---|
| Online-Tools | ★★★★★ | ★★★★ | ✔ | ✘ | Schnelle Aufgaben |
| Inkscape | ★★★ | ★★★★★ | ✘ | ✘ | Designer |
| Browser | ★★★★★ | ★★★ | ✘ | ✘ | Einfache Exporte |
| Python | ★★★ | ★★★★★ | ✔ | ✔ | Automatisierung |
Fazit
Die Konvertierung von SVG in PDF ist einfach und kann je nach Ihren Bedürfnissen auf verschiedene Arten erfolgen. Online-Tools und Browser eignen sich hervorragend für schnelle Aufgaben, während Inkscape eine kostenlose Offline-Lösung bietet. Für Entwickler und fortgeschrittene Benutzer ist Python der leistungsstärkste und skalierbarste Ansatz, insbesondere für die Stapelverarbeitung und Automatisierung.
SVG zu PDF FAQs
1. Verliert SVG bei der Konvertierung in PDF an Qualität?
Nein. Sowohl SVG als auch PDF sind vektorbasierte Formate, daher bleibt die Qualität erhalten.
2. Kann ich mehrere SVG-Dateien zu einer PDF zusammenführen?
Ja. Sie können Python oder fortgeschrittene Tools verwenden, um mehrere SVGs zu einem einzigen PDF-Dokument zu kombinieren.
3. Ist die Online-Konvertierung sicher?
Für nicht sensible Dateien ist sie im Allgemeinen sicher, aber für vertrauliche Daten werden Desktop- oder lokale Methoden empfohlen.
4. Welche Methode ist insgesamt am besten?
- Schnelle Nutzung → Online-Tools
- Kostenlose Offline-Nutzung → Inkscape
- Einfacher Export → Browser
- Automatisierung → Python