Como contar células com texto no Excel: Um guia completo

Gerenciar planilhas enormes muitas vezes parece procurar uma agulha num palheiro. Esteja você limpando dados brutos ou preparando um resumo financeiro, uma das tarefas mais fundamentais é saber como contar células com texto no Excel. Embora pareça simples, a presença de números, espaços ocultos e strings vazias geradas por fórmulas pode facilmente levar a resultados imprecisos. Neste guia, detalharemos as fórmulas mais confiáveis do Excel para contagem de texto e mostraremos como automatizar essas soluções sem esforço.
- Fórmulas Essenciais do Excel para Contar Células com Texto
- Contar Células com Texto no Microsoft Excel
- Contar Células com Texto no Excel Automaticamente
- Lidando com Casos Especiais: Armadilhas Comuns
Conceitos Essenciais: Fórmulas Essenciais do Excel para Contar Células com Texto
Para dominar a validação de dados, primeiro você precisa entender a mecânica da função CONT.SE. É a ferramenta mais intuitiva quando se trata de contar células com texto em um arquivo do Excel, mas seu verdadeiro poder reside em como você define seus critérios.
A Base: Usando CONT.SE para Contagem Rápida
A sintaxe básica, =CONT.SE(intervalo, critérios), permite que você examine um conjunto de dados em busca de padrões específicos. Ao lidar com texto genérico, usamos curingas para dizer ao Excel exatamente o que se qualifica como "conteúdo".
Quatro Cenários Comuns para Contar Texto
Os arquivos do Excel geralmente contêm vários tipos de dados, então você pode precisar usar uma ou mais das quatro abordagens especializadas a seguir:
Cenário 1: A Maneira Padrão (Texto Geral)
- Fórmula:
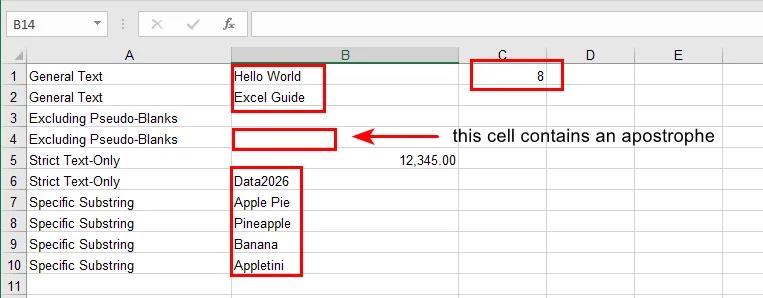
=CONT.SE(intervalo, "*") - Análise: Esta é a fórmula mais comum do Excel para contar células com texto. O asterisco (*) atua como um curinga que corresponde a qualquer string de texto, então apenas os valores de texto são contados, por exemplo, células contendo "Maçã", "Banana", ou "Texto123" serão incluídas, enquanto células com apenas números são excluídas.
Cenário 2: A Maneira de Limpeza de Dados (Excluindo Pseudo-Brancos)
- Fórmula:
=CONT.SES(intervalo, "*", intervalo, "<> ") - Análise: Algumas células podem parecer vazias, mas na verdade contêm um único caractere de espaço. Ao combinar vários critérios com
CONT.SES, esta fórmula conta as células que contêm texto, excluindo os valores que são exatamente um espaço. Por exemplo, entradas como "Maçã" ou "Texto123" são incluídas, enquanto as células que contêm " " são ignoradas. No entanto, essa abordagem não exclui células que contêm dois ou mais espaços, portanto, pode ser combinada com outras fórmulas para resultados mais precisos.
Cenário 3: A Maneira Técnica (Apenas Texto Estrito)
- Fórmula:
=SOMARPRODUTO(--ÉTEXTO(intervalo)) - Análise: Quando uma planilha contém uma mistura de datas, valores de erro (#N/A) e valores lógicos (VERDADEIRO/FALSO), ÉTEXTO fornece uma maneira estrita de identificar texto. Ele verifica o tipo de dados subjacente em vez dos caracteres exibidos, então valores como "Maçã" ou "Texto123" são contados, enquanto datas, booleanos e erros são excluídos.
Cenário 4: A Maneira Avançada (Substrings Específicas)
- Fórmula:
=CONT.SE(intervalo, "*palavra-chave*") - Análise: Essa abordagem é útil para análise de logs ou marcação de palavras-chave. Usando curingas em ambos os lados, a fórmula conta as células que contêm uma substring específica em qualquer lugar do texto, por exemplo, valores como "erro_404" ou "erro_login" são incluídos ao pesquisar por "erro".
Como Contar Células com Texto no Microsoft Excel
Usar essas fórmulas diretamente no Excel oferece várias vantagens práticas. A maioria dos usuários já tem o Excel instalado e está familiarizada com sua interface, o que facilita a inserção de fórmulas, a navegação em planilhas e a validação rápida de resultados. A aplicação da Formatação Condicional pode servir como uma verificação visual, ajudando a verificar quais células atendem aos critérios de texto.
Passos para Contar Texto no Excel Usando CONT.SE
-
Selecione um intervalo, por exemplo, B1:B10.
-
Insira a fórmula apropriada em qualquer célula em branco:
=CONT.SE(B1:B10, "*")=CONT.SE(B1:B10, "*palavra-chave*")(opcional)=CONT.SES(B1:B10, "*", B1:B10, "<> ")(opcional)
-
Pressione Enter e a célula mostrará o resultado da contagem.
Dica: Se você quiser ver quais células são contadas, pode usar a formatação condicional com uma fórmula como =ÉTEXTO(B1) para destacar as células de texto. Isso facilita a identificação visual das entradas contadas.
Como Contar Células com Texto no Excel Automaticamente Usando o Free Spire.XLS
A formatação manual é boa para tarefas únicas, mas e se você tiver 500 pastas de trabalho? É aqui que o Free Spire.XLS se destaca. Ele permite que você injete essas lógicas profissionais de contagem de texto diretamente em seus arquivos do Excel programaticamente.
Por que Automatizar?
A automação elimina o erro humano e economiza horas de cliques repetitivos. Com o Free Spire.XLS, você pode aplicar fórmulas complexas de contagem em células do Excel com lógica de texto em milhares de linhas em segundos.
Implementação Passo a Passo (Exemplo em Python)
O Free Spire.XLS facilita a aplicação de fórmulas CONT.SE programaticamente. Neste exemplo, contamos o número de células de texto em um intervalo especificado e gravamos o resultado diretamente na planilha.
from spire.xls import *
# Create a Workbook and load an Excel file
workbook = Workbook()
workbook.LoadFromFile("/sample.xlsx")
# Get the first worksheet
sheet = workbook.Worksheets[0]
# Specify the cell range for counting
source_range = "B1:B10"
# Count cells with text using COUNTIF
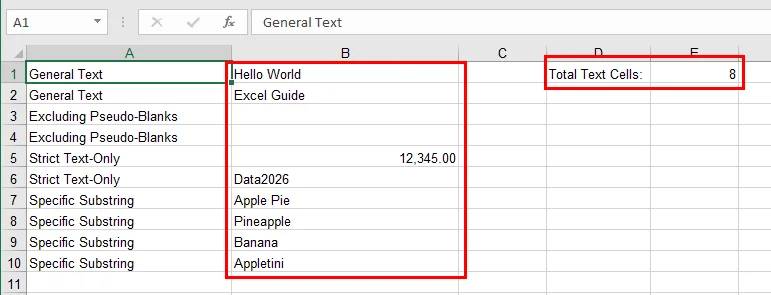
sheet.Range["D1"].Text = "Total de Células de Texto:"
sheet.Range["E1"].Formula = f'=COUNTIF({source_range}, "*")'
# Save the modified Excel file
workbook.SaveToFile("/Text_Count_Simple.xlsx", ExcelVersion.Version2016)
workbook.Dispose()
Aqui está o resultado da contagem:
Lidando com Casos Especiais: Armadilhas Comuns
Até mesmo usuários experientes do Excel podem ser enganados por peculiaridades sutis de dados. Ao contar texto com CONT.SE, tenha em mente os seguintes pontos:
- Strings Vazias:
Células contendo fórmulas como ="" retornam strings vazias em vez de espaços em branco verdadeiros. Embora CONT.SE(intervalo, "*") não conte essas células, elas ainda podem causar confusão ao inspecionar visualmente os dados ou ao usar funções como CONT.VALORES. Se necessário, NÚM.CARACT(A2)>0 pode ser usado para testar explicitamente texto não vazio.
- Caracteres Ocultos:
Dados copiados de páginas da web ou sistemas externos geralmente incluem espaços não quebráveis (CARACT(160)), que não são removidos por ARRUMAR(). Nesses casos, combinar SUBSTITUIR(A2, CARACT(160), "") com ARRUMAR() ajuda a garantir que apenas o texto significativo seja contado. Você também pode achar útil converter números em texto no Excel ao preparar dados para uma contagem consistente.
- Intervalos Incorretos:
Resultados contados incorretamente são frequentemente causados pela seleção do intervalo de células errado, em vez do uso de uma fórmula incorreta. Sempre verifique novamente as células inicial e final, especialmente ao comparar resultados manuais do Excel com saídas automatizadas.
- Desempenho:
O uso de fórmulas internas do Excel, como CONT.SE, permite que o Free Spire.XLS dependa do mecanismo de fórmulas nativo do Excel para o cálculo. Essa abordagem é significativamente mais eficiente do que iterar por cada célula no código para avaliar seu valor, especialmente ao trabalhar com planilhas grandes.
Conclusão
Aprender a contar células com texto no Excel é uma pequena habilidade que gera enormes dividendos na precisão dos dados. Ao passar de fórmulas manuais para a automação com o Free Spire.XLS, você transforma uma tarefa tediosa em um fluxo de trabalho escalável e sem erros. Esteja você gerenciando listas simples ou bancos de dados complexos, essas ferramentas garantem que suas percepções sejam sempre baseadas em dados limpos e bem categorizados.
Pronto para levar seu jogo de planilhas para o próximo nível? Experimente o Free Spire.XLS e comece a automatizar sua validação de dados com facilidade!
Leia Também
엑셀에서 텍스트가 있는 셀 개수 세기: 완벽 가이드
방대한 스프레드시트를 관리하는 것은 종종 건초 더미에서 바늘을 찾는 것처럼 느껴집니다. 원시 데이터를 정리하든 재무 요약을 준비하든 가장 기본적인 작업 중 하나는 Excel에서 텍스트가 포함된 셀을 계산하는 방법을 아는 것입니다. 간단하게 들릴 수 있지만 숫자, 숨겨진 공백, 수식으로 생성된 빈 문자열이 있으면 쉽게 부정확한 결과를 초래할 수 있습니다. 이 가이드에서는 텍스트 계산을 위한 가장 신뢰할 수 있는 Excel 수식을 분석하고 이러한 솔루션을 손쉽게 자동화하는 방법을 보여줍니다.
- 텍스트가 포함된 셀을 계산하는 필수 Excel 수식
- Microsoft Excel에서 텍스트가 포함된 셀 계산
- Excel에서 텍스트가 포함된 셀 자동 계산
- 엣지 케이스 처리: 일반적인 함정
핵심 개념: 텍스트가 포함된 셀을 계산하는 필수 Excel 수식
데이터 유효성 검사를 마스터하려면 먼저 COUNTIF 함수의 메커니즘을 이해해야 합니다. Excel 파일에서 텍스트가 포함된 셀을 계산할 때 가장 직관적인 도구이지만 진정한 강점은 기준을 정의하는 방법에 있습니다.
기초: 빠른 계산을 위한 COUNTIF 사용
기본 구문인 =COUNTIF(range, criteria)를 사용하면 특정 패턴에 대한 데이터 세트를 스캔할 수 있습니다. 일반 텍스트를 다룰 때 와일드카드를 사용하여 Excel에 "콘텐츠"로 간주되는 항목을 정확히 알려줍니다.
텍스트 계산을 위한 네 가지 일반적인 시나리오
Excel 파일에는 여러 유형의 데이터가 포함되어 있는 경우가 많으므로 다음 네 가지 특수 접근 방식 중 하나 이상을 사용해야 할 수 있습니다.
시나리오 1: 표준 방식 (일반 텍스트)
- 수식:
=COUNTIF(range, "*") - 분석: 이것은 텍스트가 포함된 셀을 계산하는 가장 일반적인 Excel 수식입니다. 별표(*)는 모든 텍스트 문자열과 일치하는 와일드카드 역할을 하므로 텍스트 값만 계산됩니다. 예를 들어 "Apple", "Banana" 또는 "Text123"을 포함하는 셀은 포함되지만 숫자만 있는 셀은 제외됩니다.
시나리오 2: 데이터 정리 방식 (유사 공백 제외)
- 수식:
=COUNTIFS(range, "*", range, "<> ") - 분석: 일부 셀은 비어 있는 것처럼 보이지만 실제로는 단일 공백 문자를 포함할 수 있습니다. 여러 기준을
COUNTIFS와 결합하여 이 수식은 정확히 하나의 공백인 값을 제외하면서 텍스트가 포함된 셀을 계산합니다. 예를 들어 "Apple" 또는 "Text123"과 같은 항목은 포함되지만 " "를 포함하는 셀은 무시됩니다. 그러나 이 접근 방식은 두 개 이상의 공백을 포함하는 셀을 제외하지 않으므로 보다 정확한 결과를 위해 다른 수식과 결합할 수 있습니다.
시나리오 3: 기술적 방식 (엄격한 텍스트 전용)
- 수식:
=SUMPRODUCT(--ISTEXT(range)) - 분석: 워크시트에 날짜, 오류 값(#N/A) 및 논리 값(TRUE/FALSE)이 혼합되어 있는 경우 ISTEXT는 텍스트를 식별하는 엄격한 방법을 제공합니다. 표시된 문자가 아닌 기본 데이터 유형을 확인하므로 "Apple" 또는 "Text123"과 같은 값은 계산되지만 날짜, 부울 및 오류는 제외됩니다.
시나리오 4: 고급 방식 (특정 하위 문자열)
- 수식:
=COUNTIF(range, "*keyword*") - 분석: 이 접근 방식은 로그 분석이나 키워드 태깅에 유용합니다. 양쪽에 와일드카드를 사용하면 수식은 텍스트 내 어디에서나 특정 하위 문자열을 포함하는 셀을 계산합니다. 예를 들어 "error"를 검색할 때 "error_404" 또는 "login_error"와 같은 값이 포함됩니다.
Microsoft Excel에서 텍스트가 포함된 셀을 계산하는 방법
이러한 수식을 Excel에서 직접 사용하면 몇 가지 실용적인 이점이 있습니다. 대부분의 사용자는 이미 Excel을 설치했으며 인터페이스에 익숙하므로 수식을 쉽게 입력하고, 시트를 탐색하고, 결과를 신속하게 확인할 수 있습니다. 조건부 서식을 적용하면 시각적 온전성 검사 역할을 하여 텍스트 기준을 충족하는 셀을 확인하는 데 도움이 될 수 있습니다.
COUNTIF를 사용하여 Excel에서 텍스트를 계산하는 단계
-
예를 들어 B1:B10과 같은 범위를 선택합니다.
-
=COUNTIF(B1:B10, "*")=COUNTIF(B1:B10, "*keyword*")(선택 사항)=COUNTIFS(B1:B10, "*", B1:B10, "<> ")(선택 사항)
-
Enter 키를 누르면 셀에 계산 결과가 표시됩니다.
팁: 계산된 셀을 보려면 =ISTEXT(B1)과 같은 수식과 함께 조건부 서식을 사용하여 텍스트 셀을 강조 표시할 수 있습니다. 이렇게 하면 계산된 항목을 시각적으로 쉽게 식별할 수 있습니다.
Free Spire.XLS를 사용하여 Excel에서 텍스트가 포함된 셀을 자동으로 계산하는 방법
수동 서식은 일회성 작업에는 적합하지만 500개의 통합 문서가 있다면 어떨까요? 이것이 바로 Free Spire.XLS가 빛을 발하는 부분입니다. 이러한 전문적인 텍스트 계산 논리를 프로그래밍 방식으로 Excel 파일에 직접 주입할 수 있습니다.
자동화하는 이유?
자동화는 인적 오류를 제거하고 반복적인 클릭 시간을 절약합니다. Free Spire.XLS를 사용하면 수천 개의 행에 걸쳐 텍스트 논리가 있는 Excel 셀에 복잡한 계산 수식을 몇 초 만에 적용할 수 있습니다.
단계별 구현 (Python 예제)
Free Spire.XLS를 사용하면 프로그래밍 방식으로 COUNTIF 수식을 쉽게 적용할 수 있습니다. 이 예에서는 지정된 범위의 텍스트 셀 수를 계산하고 결과를 워크시트에 직접 씁니다.
from spire.xls import *

# Create a Workbook and load an Excel file
workbook = Workbook()
workbook.LoadFromFile("/sample.xlsx")

# Get the first worksheet
sheet = workbook.Worksheets[0]

# Specify the cell range for counting
source_range = "B1:B10"

# Count cells with text using COUNTIF
sheet.Range["D1"].Text = "총 텍스트 셀:"
sheet.Range["E1"].Formula = f'=COUNTIF({source_range}, "*")'

# Save the modified Excel file
workbook.SaveToFile("/Text_Count_Simple.xlsx", ExcelVersion.Version2016)
workbook.Dispose()
계산 결과는 다음과 같습니다.
엣지 케이스 처리: 일반적인 함정
숙련된 Excel 사용자라도 미묘한 데이터 문제에 걸려 넘어질 수 있습니다. COUNTIF로 텍스트를 계산할 때 다음 사항을 염두에 두십시오.
- 빈 문자열:
=""와 같은 수식이 포함된 셀은 실제 공백이 아닌 빈 문자열을 반환합니다. COUNTIF(range, "*")는 이러한 셀을 계산하지 않지만 데이터를 시각적으로 검사하거나 COUNTA와 같은 함수를 사용할 때 여전히 혼동을 일으킬 수 있습니다. 필요한 경우 LEN(A2)>0을 사용하여 비어 있지 않은 텍스트를 명시적으로 테스트할 수 있습니다.
- 숨겨진 문자:
웹 페이지나 외부 시스템에서 복사한 데이터에는 종종 TRIM()으로 제거되지 않는 줄 바꿈 없는 공백(CHAR(160))이 포함됩니다. 이러한 경우 SUBSTITUTE(A2, CHAR(160), "")와 TRIM()을 결합하면 의미 있는 텍스트만 계산되도록 할 수 있습니다. 일관된 계산을 위해 데이터를 준비할 때 Excel에서 숫자를 텍스트로 변환하는 것이 유용할 수도 있습니다.
- 잘못된 범위:
잘못 계산된 결과는 잘못된 수식을 사용하는 것보다 잘못된 셀 범위를 선택하여 발생하는 경우가 많습니다. 특히 수동 Excel 결과를 자동화된 출력과 비교할 때 시작 셀과 끝 셀을 항상 다시 확인하십시오.
- 성능:
COUNTIF와 같은 내장 Excel 수식을 사용하면 Free Spire.XLS가 계산을 위해 Excel의 기본 수식 엔진에 의존할 수 있습니다. 이 접근 방식은 특히 대규모 워크시트로 작업할 때 코드의 각 셀을 반복하여 값을 평가하는 것보다 훨씬 효율적입니다.
결론
Excel에서 텍스트가 포함된 셀을 계산하는 방법을 배우는 것은 데이터 정확성에서 막대한 이익을 창출하는 작은 기술입니다. 수동 수식에서 Free Spire.XLS 자동화로 전환하면 지루한 작업을 확장 가능하고 오류 없는 워크플로로 전환할 수 있습니다. 간단한 목록을 관리하든 복잡한 데이터베이스를 관리하든 이러한 도구를 사용하면 항상 깨끗하고 잘 분류된 데이터를 기반으로 통찰력을 얻을 수 있습니다.
스프레드시트 게임을 한 단계 더 발전시킬 준비가 되셨습니까? Free Spire.XLS를 사용해보고 데이터 유효성 검사를 손쉽게 자동화해 보세요!
함께 읽기
Come contare le celle con testo in Excel: Guida completa
La gestione di fogli di calcolo enormi sembra spesso come cercare un ago in un pagliaio. Che si tratti di pulire dati grezzi o preparare un riepilogo finanziario, uno dei compiti più fondamentali è sapere come contare le celle con testo in Excel. Anche se sembra semplice, la presenza di numeri, spazi nascosti e stringhe vuote generate da formule può facilmente portare a risultati imprecisi. In questa guida, analizzeremo le formule di Excel più affidabili per il conteggio del testo e ti mostreremo come automatizzare queste soluzioni senza sforzo.
- Formule Essenziali di Excel per Contare le Celle con Testo
- Contare le Celle con Testo in Microsoft Excel
- Contare Automaticamente le Celle con Testo in Excel
- Gestire i Casi Limite: Errori Comuni
Concetti Fondamentali: Formule Essenziali di Excel per Contare le Celle con Testo
Per padroneggiare la convalida dei dati, è necessario prima comprendere i meccanismi della funzione CONTA.SE. È lo strumento più intuitivo quando si tratta di contare le celle con testo in un file Excel, ma la sua vera potenza risiede nel modo in cui si definiscono i criteri.
Le Basi: Usare CONTA.SE per un Conteggio Rapido
La sintassi di base, =COUNTIF(range, criteria), consente di analizzare un set di dati per modelli specifici. Quando si ha a che fare con testo generico, usiamo i caratteri jolly per dire a Excel esattamente cosa si qualifica come "contenuto".
Quattro Scenari Comuni per il Conteggio del Testo
I file Excel contengono spesso più tipi di dati, quindi potrebbe essere necessario utilizzare uno o più dei seguenti quattro approcci specializzati:
Scenario 1: Il Modo Standard (Testo Generale)
- Formula:
=COUNTIF(range, "*") - Analisi: Questa è la formula di Excel più comune per contare le celle con testo. L'asterisco (*) funge da carattere jolly che corrisponde a qualsiasi stringa di testo, quindi vengono contati solo i valori di testo, ad esempio, le celle contenenti "Mela", "Banana" o "Testo123" saranno incluse, mentre le celle con solo numeri sono escluse.
Scenario 2: Il Modo per la Pulizia dei Dati (Escludendo gli Pseudo-Vuoti)
- Formula:
=COUNTIFS(range, "*", range, "<> ") - Analisi: Alcune celle possono sembrare vuote ma in realtà contengono un singolo carattere di spazio. Combinando più criteri con
COUNTIFS, questa formula conta le celle che contengono testo escludendo i valori che sono esattamente uno spazio. Ad esempio, voci come "Mela" o "Testo123" sono incluse, while cells containing " " are ignored. However, this approach does not exclude cells that contain two or more spaces, so it can be combined with other formulas for more precise results.
Scenario 3: Il Modo Tecnico (Solo Testo Stretto)
- Formula:
=SUMPRODUCT(--ISTEXT(range)) - Analisi: Quando un foglio di lavoro contiene un mix di date, valori di errore (#N/D), e valori logici (VERO/FALSO), VAL.TESTO fornisce un modo rigoroso per identificare il testo. Controlla il tipo di dati sottostante anziché i caratteri visualizzati, quindi valori come "Mela" o "Testo123" vengono contati, mentre date, booleani ed errori vengono esclusi.
Scenario 4: Il Modo Avanzato (Sottostringhe Specifiche)
- Formula:
=COUNTIF(range, "*keyword*") - Analisi: Questo approccio è utile per l'analisi dei log o l'etichettatura di parole chiave. Utilizzando caratteri jolly su entrambi i lati, la formula conta le celle che contengono una sottostringa specifica in qualsiasi punto del testo, ad esempio, valori come "errore_404" o "errore_login" vengono inclusi durante la ricerca di "errore".
Come Contare le Celle con Testo in Microsoft Excel
L'utilizzo di queste formule direttamente in Excel offre diversi vantaggi pratici. La maggior parte degli utenti ha già Excel installato e ha familiarità con la sua interfaccia, il che rende facile inserire formule, navigare tra i fogli e convalidare rapidamente i risultati. L'applicazione della Formattazione Condizionale può servire come controllo visivo di integrità, aiutandoti a verificare quali celle soddisfano i criteri del testo.
Passaggi per Contare il Testo in Excel Usando CONTA.SE
-
Seleziona un intervallo, ad esempio, B1:B10.
-
Inserisci la formula appropriata in una cella vuota:
=COUNTIF(B1:B10, "*")=COUNTIF(B1:B10, "*keyword*")(opzionale)=COUNTIFS(B1:B10, "*", B1:B10, "<> ")(opzionale)
-
Premi Invio e la cella mostrerà il risultato del conteggio.
Suggerimento: se vuoi vedere quali celle vengono contate, puoi usare la formattazione condizionale con una formula come =ISTEXT(B1) per evidenziare le celle di testo. Ciò rende facile identificare visivamente le voci contate.
Come Contare Automaticamente le Celle con Testo in Excel Usando Free Spire.XLS
La formattazione manuale va bene per compiti occasionali, ma cosa succede se hai 500 cartelle di lavoro? È qui che Free Spire.XLS eccelle. Ti consente di inserire queste logiche professionali di conteggio del testo direttamente nei tuoi file Excel in modo programmatico.
Perché Automatizzare?
L'automazione elimina l'errore umano e fa risparmiare ore di clic ripetitivi. Con Free Spire.XLS, puoi applicare formule di conteggio complesse nelle celle di Excel con logica di testo su migliaia di righe in pochi secondi.
Implementazione Passo-Passo (Esempio Python)
Free Spire.XLS rende facile applicare le formule CONTA.SE in modo programmatico. In questo esempio, contiamo il numero di celle di testo in un intervallo specificato e scriviamo il risultato direttamente nel foglio di lavoro.
from spire.xls import *

# Create a Workbook and load an Excel file
workbook = Workbook()
workbook.LoadFromFile("/sample.xlsx")

# Get the first worksheet
sheet = workbook.Worksheets[0]

# Specify the cell range for counting
source_range = "B1:B10"

# Count cells with text using COUNTIF
sheet.Range["D1"].Text = "Total Text Cells:"
sheet.Range["E1"].Formula = f'=COUNTIF({source_range}, "*")'

# Save the modified Excel file
workbook.SaveToFile("/Text_Count_Simple.xlsx", ExcelVersion.Version2016)
workbook.Dispose()
Ecco il risultato del conteggio:
Gestire i Casi Limite: Errori Comuni
Anche gli utenti esperti di Excel possono essere ingannati da sottili stranezze dei dati. Quando si conta il testo con CONTA.SE, tenere a mente i seguenti punti:
- Stringhe Vuote:
Le celle che contengono formule come ="" restituiscono stringhe vuote anziché veri spazi vuoti. Sebbene COUNTIF(range, "*") non conti queste celle, possono comunque creare confusione durante l'ispezione visiva dei dati o quando si utilizzano funzioni come COUNTA. Se necessario, LEN(A2)>0 può essere utilizzato per verificare esplicitamente la presenza di testo non vuoto.
- Caratteri Nascosti:
I dati copiati da pagine web o sistemi esterni includono spesso spazi non divisibili (CODICE.CARATT(160)), che non vengono rimossi da TRIM(). In tali casi, la combinazione di SUBSTITUTE(A2, CHAR(160), "") con TRIM() aiuta a garantire che venga contato solo il testo significativo. Potresti anche trovare utile convertire i numeri in testo in Excel durante la preparazione dei dati per un conteggio coerente.
- Intervalli Errati:
Risultati di conteggio errati sono spesso causati dalla selezione dell'intervallo di celle sbagliato piuttosto che dall'uso di una formula errata. Controlla sempre due volte le celle di inizio e fine, specialmente quando si confrontano i risultati manuali di Excel con gli output automatizzati.
- Prestazioni:
L'utilizzo di formule Excel integrate come COUNTIF consente a Free Spire.XLS di fare affidamento sul motore di formule nativo di Excel per il calcolo. Questo approccio è significativamente più efficiente rispetto all'iterazione di ogni cella nel codice per valutarne il valore, in particolare quando si lavora con fogli di lavoro di grandi dimensioni.
Conclusione
Imparare a contare le celle con testo in Excel è una piccola abilità che produce enormi dividendi in termini di accuratezza dei dati. Passando dalle formule manuali all'automazione di Free Spire.XLS, trasformi un compito noioso in un flusso di lavoro scalabile e privo di errori. Che tu stia gestendo semplici elenchi o database complessi, questi strumenti assicurano che le tue intuizioni si basino sempre su dati puliti e ben classificati.
Pronto a portare il tuo gioco con i fogli di calcolo al livello successivo? Prova Free Spire.XLS e inizia ad automatizzare la convalida dei dati con facilità!
Leggi Anche
Comment compter les cellules avec du texte dans Excel : Guide complet
Table des matières
La gestion de feuilles de calcul volumineuses ressemble souvent à la recherche d'une aiguille dans une botte de foin. Que vous nettoyiez des données brutes ou prépariez un résumé financier, l'une des tâches les plus fondamentales est de savoir comment compter les cellules contenant du texte dans Excel. Bien que cela semble simple, la présence de chiffres, d'espaces cachés et de chaînes vides générées par des formules peut facilement conduire à des résultats inexacts. Dans ce guide, nous détaillerons les formules Excel les plus fiables pour le comptage de texte et vous montrerons comment automatiser ces solutions sans effort.
- Formules Excel essentielles pour compter les cellules avec du texte
- Compter les cellules avec du texte dans Microsoft Excel
- Compter automatiquement les cellules avec du texte dans Excel
- Gérer les cas particuliers : pièges courants
Concepts de base : Formules Excel essentielles pour compter les cellules avec du texte
Pour maîtriser la validation des données, vous devez d'abord comprendre le fonctionnement de la fonction NB.SI. C'est l'outil le plus intuitif pour compter les cellules contenant du texte dans un fichier Excel, mais sa véritable puissance réside dans la manière dont vous définissez vos critères.
La base : Utiliser NB.SI pour un comptage rapide
La syntaxe de base, =NB.SI(plage, critère), vous permet d'analyser un ensemble de données à la recherche de modèles spécifiques. Lorsque nous traitons du texte générique, nous utilisons des caractères génériques pour indiquer à Excel exactement ce qui est considéré comme du « contenu ».
Quatre scénarios courants pour compter le texte
Les fichiers Excel contiennent souvent plusieurs types de données, vous devrez donc peut-être utiliser une ou plusieurs des quatre approches spécialisées suivantes :
Scénario 1 : La méthode standard (texte général)
- Formule :
=NB.SI(plage, "*") - Analyse : C'est la formule Excel la plus courante pour compter les cellules contenant du texte. L'astérisque (*) agit comme un caractère générique qui correspond à n'importe quelle chaîne de texte, de sorte que seules les valeurs de texte sont comptées. Par exemple, les cellules contenant « Apple », « Banana » ou « Text123 » seront incluses, tandis que les cellules ne contenant que des chiffres sont exclues.
Scénario 2 : La méthode de nettoyage des données (à l'exclusion des pseudo-vides)
- Formule :
=NB.SI.ENS(plage, "*", plage, "<> ") - Analyse : Certaines cellules peuvent paraître vides mais contiennent en réalité un seul caractère espace. En combinant plusieurs critères avec
NB.SI.ENS, cette formule compte les cellules qui contiennent du texte tout en excluant les valeurs qui sont exactement un espace. Par exemple, les entrées comme « Apple » ou « Text123 » sont incluses, tandis que les cellules contenant « » sont ignorées. Cependant, cette approche n'exclut pas les cellules qui contiennent deux espaces ou plus, elle peut donc être combinée avec d'autres formules pour des résultats plus précis.
Scénario 3 : La méthode technique (texte uniquement)
- Formule :
=SOMMEPROD(--ESTTEXTE(plage)) - Analyse : Lorsqu'une feuille de calcul contient un mélange de dates, de valeurs d'erreur (#N/A) et de valeurs logiques (VRAI/FAUX), ESTTEXTE fournit un moyen strict d'identifier le texte. Il vérifie le type de données sous-jacent plutôt que les caractères affichés, de sorte que les valeurs comme « Apple » ou « Text123 » sont comptées, tandis que les dates, les booléens et les erreurs sont exclus.
Scénario 4 : La méthode avancée (sous-chaînes spécifiques)
- Formule :
=NB.SI(plage, "*mot-clé*") - Analyse : Cette approche est utile pour l'analyse des journaux ou le balisage par mots-clés. En utilisant des caractères génériques des deux côtés, la formule compte les cellules qui contiennent une sous-chaîne spécifique n'importe où dans le texte. Par exemple, des valeurs comme « error_404 » ou « login_error » sont incluses lors de la recherche de « error ».
Comment compter les cellules avec du texte dans Microsoft Excel
L'utilisation directe de ces formules dans Excel offre plusieurs avantages pratiques. La plupart des utilisateurs ont déjà installé Excel et sont familiers avec son interface, ce qui facilite la saisie de formules, la navigation dans les feuilles et la validation rapide des résultats. L'application de la mise en forme conditionnelle peut servir de vérification visuelle, vous aidant à vérifier quelles cellules répondent aux critères de texte.
Étapes pour compter le texte dans Excel à l'aide de NB.SI
-
Sélectionnez une plage, par exemple, B1:B10.
-
Saisissez la formule appropriée dans n'importe quelle cellule vide :
=NB.SI(B1:B10, "*")=NB.SI(B1:B10, "*mot-clé*")(facultatif)=NB.SI.ENS(B1:B10, "*", B1:B10, "<> ")(facultatif)
-
Appuyez sur Entrée et la cellule affiche le résultat du comptage.
Astuce : si vous souhaitez voir quelles cellules sont comptées, vous pouvez utiliser la mise en forme conditionnelle avec une formule comme =ESTTEXTE(B1) pour surligner les cellules de texte. Cela facilite l'identification visuelle des entrées comptées.
Comment compter automatiquement les cellules avec du texte dans Excel à l'aide de Free Spire.XLS
La mise en forme manuelle convient aux tâches ponctuelles, mais que se passe-t-il si vous avez 500 classeurs ? C'est là que Free Spire.XLS brille. Il vous permet d'injecter ces logiques de comptage de texte professionnelles directement dans vos fichiers Excel par programme.
Pourquoi automatiser ?
L'automatisation élimine les erreurs humaines et permet d'économiser des heures de clics répétitifs. Avec Free Spire.XLS, vous pouvez appliquer des formules de comptage complexes dans des cellules Excel avec une logique de texte sur des milliers de lignes en quelques secondes.
Mise en œuvre étape par étape (exemple Python)
Free Spire.XLS facilite l'application de formules NB.SI par programme. Dans cet exemple, nous comptons le nombre de cellules de texte dans une plage spécifiée et écrivons le résultat directement dans la feuille de calcul.
from spire.xls import *

# Create a Workbook and load an Excel file
workbook = Workbook()
workbook.LoadFromFile("/sample.xlsx")

# Get the first worksheet
sheet = workbook.Worksheets[0]

# Specify the cell range for counting
source_range = "B1:B10"

# Count cells with text using COUNTIF
sheet.Range["D1"].Text = "Total des cellules de texte :"
sheet.Range["E1"].Formula = f'=COUNTIF({source_range}, "*")'

# Save the modified Excel file
workbook.SaveToFile("/Text_Count_Simple.xlsx", ExcelVersion.Version2016)
workbook.Dispose()
Voici le résultat du comptage :
Gérer les cas particuliers : pièges courants
Même les utilisateurs expérimentés d'Excel peuvent être déroutés par de subtiles bizarreries de données. Lorsque vous comptez du texte avec NB.SI, gardez les points suivants à l'esprit :
- Chaînes vides :
Les cellules contenant des formules comme ="" renvoient des chaînes vides plutôt que de véritables blancs. Bien que NB.SI(plage, "*") ne compte pas ces cellules, elles peuvent tout de même prêter à confusion lors de l'inspection visuelle des données ou lors de l'utilisation de fonctions telles que NBVAL. Si nécessaire, NBCAR(A2)>0 peut être utilisé pour tester explicitement le texte non vide.
- Caractères cachés :
Les données copiées à partir de pages Web ou de systèmes externes incluent souvent des espaces insécables (CAR(160)), qui ne sont pas supprimés par SUPPRESPACE(). Dans de tels cas, la combinaison de SUBSTITUE(A2, CAR(160), "") avec SUPPRESPACE() permet de s'assurer que seul le texte significatif est compté. Vous trouverez peut-être également utile de convertir des nombres en texte dans Excel lors de la préparation des données pour un comptage cohérent.
- Plages incorrectes :
Les résultats mal comptés sont souvent dus à la sélection de la mauvaise plage de cellules plutôt qu'à l'utilisation d'une formule incorrecte. Vérifiez toujours les cellules de début et de fin, en particulier lorsque vous comparez les résultats manuels d'Excel avec les sorties automatisées.
- Performance:
L'utilisation de formules Excel intégrées telles que NB.SI permet à Free Spire.XLS de s'appuyer sur le moteur de formule natif d'Excel pour le calcul. Cette approche est nettement plus efficace que de parcourir chaque cellule dans le code pour évaluer sa valeur, en particulier lorsque vous travaillez avec de grandes feuilles de calcul.
Conclusion
Apprendre à compter les cellules contenant du texte dans Excel est une petite compétence qui rapporte d'énormes dividendes en termes de précision des données. En passant des formules manuelles à l'automatisation Free Spire.XLS, vous transformez une corvée fastidieuse en un flux de travail évolutif et sans erreur. Que vous gériez des listes simples ou des bases de données complexes, ces outils garantissent que vos informations sont toujours basées sur des données propres et bien classées.
Prêt à passer au niveau supérieur dans votre jeu de feuilles de calcul ? Essayez Free Spire.XLS et commencez à automatiser votre validation de données en toute simplicité !
À lire également
- Mettre en surbrillance les doublons dans Excel : 4 méthodes simples
- Comment supprimer les lignes en double d'Excel - 6 façons simples
- Comment supprimer les formules dans Excel tout en conservant les données
- Supprimer la validation des données dans Excel : conserver les données, effacer les restrictions
Cómo contar celdas con texto en Excel: Una guía completa
Gestionar hojas de cálculo masivas a menudo se siente como buscar una aguja en un pajar. Ya sea que estés limpiando datos brutos o preparando un resumen financiero, una de las tareas más fundamentales es saber cómo contar celdas con texto en Excel. Aunque suena simple, la presencia de números, espacios ocultos y cadenas vacías generadas por fórmulas puede llevar fácilmente a resultados inexactos. En esta guía, desglosaremos las fórmulas de Excel más fiables para contar texto y te mostraremos cómo automatizar estas soluciones sin esfuerzo.
- Fórmulas Esenciales de Excel para Contar Celdas con Texto
- Contar Celdas con Texto en Microsoft Excel
- Contar Celdas con Texto en Excel Automáticamente
- Manejo de Casos Especiales: Errores Comunes
Conceptos Clave: Fórmulas Esenciales de Excel para Contar Celdas con Texto
Para dominar la validación de datos, primero necesitas entender la mecánica de la función CONTAR.SI. Es la herramienta más intuitiva cuando se trata de contar celdas con texto en un archivo de Excel, pero su verdadero poder reside en cómo defines tus criterios.
La Base: Usando CONTAR.SI para un Conteo Rápido
La sintaxis básica, =CONTAR.SI(rango, criterio), te permite escanear un conjunto de datos en busca de patrones específicos. Cuando se trata de texto genérico, usamos comodines para decirle a Excel exactamente qué califica como "contenido".
Cuatro Escenarios Comunes para Contar Texto
Los archivos de Excel a menudo contienen múltiples tipos de datos, por lo que es posible que necesites usar uno o más de los siguientes cuatro enfoques especializados:
Escenario 1: La Forma Estándar (Texto General)
- Fórmula:
=CONTAR.SI(rango, "*") - Análisis: Esta es la fórmula de Excel más común para contar celdas con texto. El asterisco (*) actúa como un comodín que coincide con cualquier cadena de texto, por lo que solo se cuentan los valores de texto, por ejemplo, las celdas que contienen "Manzana", "Banana", o "Texto123" se incluirán, mientras que las celdas con solo números se excluyen.
Escenario 2: La Forma de Limpieza de Datos (Excluyendo Pseudo-Blancos)
- Fórmula:
=CONTAR.SI.CONJUNTO(rango, "*", rango, "<> ") - Análisis: Algunas celdas pueden parecer vacías pero en realidad contienen un solo carácter de espacio. Al combinar múltiples criterios con
CONTAR.SI.CONJUNTO, esta fórmula cuenta las celdas que contienen texto mientras excluye los valores que son exactamente un espacio. Por ejemplo, se incluyen entradas como "Manzana" o "Texto123", mientras que se ignoran las celdas que contienen " ". Sin embargo, este enfoque no excluye las celdas que contienen dos o más espacios, por lo que se puede combinar con otras fórmulas para obtener resultados más precisos.
Escenario 3: La Forma Técnica (Solo Texto Estricto)
- Fórmula:
=SUMAPRODUCTO(--ESTEXTO(rango)) - Análisis: Cuando una hoja de trabajo contiene una mezcla de fechas, valores de error (#N/A) y valores lógicos (VERDADERO/FALSO), ESTEXTO proporciona una forma estricta de identificar texto. Comprueba el tipo de datos subyacente en lugar de los caracteres mostrados, por lo que se cuentan valores como "Manzana" o "Texto123", mientras que se excluyen fechas, booleanos y errores.
Escenario 4: La Forma Avanzada (Subcadenas Específicas)
- Fórmula:
=CONTAR.SI(rango, "*palabraclave*") - Análisis: Este enfoque es útil para el análisis de registros o el etiquetado de palabras clave. Al usar comodines en ambos lados, la fórmula cuenta las celdas que contienen una subcadena específica en cualquier parte del texto, por ejemplo, se incluyen valores como "error_404" o "login_error" al buscar "error".
Cómo Contar Celdas con Texto en Microsoft Excel
Usar estas fórmulas directamente en Excel ofrece varias ventajas prácticas. La mayoría de los usuarios ya tienen Excel instalado y están familiarizados con su interfaz, lo que facilita la introducción de fórmulas, la navegación por las hojas y la validación rápida de los resultados. Aplicar formato condicional puede servir como una verificación visual, ayudándote a comprobar qué celdas cumplen los criterios de texto.
Pasos para Contar Texto en Excel Usando CONTAR.SI
-
Selecciona un rango, por ejemplo, B1:B10.
-
Introduce la fórmula apropiada en cualquier celda en blanco:
=CONTAR.SI(B1:B10, "*")=CONTAR.SI(B1:B10, "*palabraclave*")(opcional)=CONTAR.SI.CONJUNTO(B1:B10, "*", B1:B10, "<> ")(opcional)
-
Presiona Enter y la celda mostrará el resultado del conteo.
Consejo: Si quieres ver qué celdas se cuentan, puedes usar formato condicional con una fórmula como =ESTEXTO(B1) para resaltar las celdas de texto. Esto facilita la identificación visual de las entradas contadas.
Cómo Contar Celdas con Texto en Excel Automáticamente Usando Free Spire.XLS
El formato manual está bien para tareas puntuales, pero ¿qué pasa si tienes 500 libros de trabajo? Aquí es donde brilla Free Spire.XLS. Te permite inyectar estas lógicas profesionales de conteo de texto directamente en tus archivos de Excel de forma programática.
¿Por Qué Automatizar?
La automatización elimina el error humano y ahorra horas de clics repetitivos. Con Free Spire.XLS, puedes aplicar fórmulas complejas de conteo en celdas de Excel con lógica de texto a través de miles de filas en segundos.
Implementación Paso a Paso (Ejemplo de Python)
Free Spire.XLS facilita la aplicación de fórmulas CONTAR.SI de forma programática. En este ejemplo, contamos el número de celdas de texto en un rango especificado y escribimos el resultado directamente en la hoja de trabajo.
from spire.xls import *

# Create a Workbook and load an Excel file
workbook = Workbook()
workbook.LoadFromFile("/sample.xlsx")

# Get the first worksheet
sheet = workbook.Worksheets[0]

# Specify the cell range for counting
source_range = "B1:B10"

# Count cells with text using COUNTIF
sheet.Range["D1"].Text = "Total Text Cells:"
sheet.Range["E1"].Formula = f'=COUNTIF({source_range}, "*")'

# Save the modified Excel file
workbook.SaveToFile("/Text_Count_Simple.xlsx", ExcelVersion.Version2016)
workbook.Dispose()
Aquí está el resultado del conteo:
Manejo de Casos Especiales: Errores Comunes
Incluso los usuarios experimentados de Excel pueden tropezar con peculiaridades sutiles de los datos. Al contar texto con CONTAR.SI, ten en cuenta los siguientes puntos:
- Cadenas Vacías:
Las celdas que contienen fórmulas como ="" devuelven cadenas vacías en lugar de verdaderos espacios en blanco. Aunque CONTAR.SI(rango, "*") no cuenta estas celdas, todavía pueden causar confusión al inspeccionar visualmente los datos o al usar funciones como CONTARA. Si es necesario, se puede usar LARGO(A2)>0 para probar explícitamente si hay texto no vacío.
- Caracteres Ocultos:
Los datos copiados de páginas web o sistemas externos a menudo incluyen espacios de no separación (CARACTER(160)), que no se eliminan con ESPACIOS(). En tales casos, combinar SUSTITUIR(A2, CARACTER(160), "") con ESPACIOS() ayuda a garantizar que solo se cuente el texto significativo. También puede resultarte útil convertir números a texto en Excel al preparar los datos para un conteo consistente.
- Rangos Incorrectos:
Los resultados mal contados a menudo son causados por seleccionar el rango de celdas incorrecto en lugar de usar una fórmula incorrecta. Siempre verifica dos veces las celdas de inicio y fin, especialmente al comparar los resultados manuales de Excel con los resultados automatizados.
- Rendimiento:
El uso de fórmulas integradas de Excel como CONTAR.SI permite que Free Spire.XLS dependa del motor de fórmulas nativo de Excel para el cálculo. Este enfoque es significativamente más eficiente que iterar a través de cada celda en el código para evaluar su valor, particularmente cuando se trabaja con hojas de trabajo grandes.
Conclusión
Aprender a contar celdas con texto en Excel es una pequeña habilidad que produce enormes dividendos en la precisión de los datos. Al pasar de las fórmulas manuales a la automatización con Free Spire.XLS, transformas una tarea tediosa en un flujo de trabajo escalable y sin errores. Ya sea que estés gestionando listas simples o bases de datos complejas, estas herramientas aseguran que tus conocimientos se basen siempre en datos limpios y bien categorizados.
¿Listo para llevar tu juego de hojas de cálculo al siguiente nivel? ¡Prueba Free Spire.XLS y comienza a automatizar tu validación de datos con facilidad!
También Leer
So zählen Sie Zellen mit Text in Excel: Eine vollständige Anleitung
Die Verwaltung riesiger Tabellenkalkulationen fühlt sich oft an wie die Suche nach der Nadel im Heuhaufen. Egal, ob Sie Rohdaten bereinigen oder eine Finanzübersicht erstellen, eine der grundlegendsten Aufgaben ist es zu wissen, wie man Zellen mit Text in Excel zählt. Obwohl es einfach klingt, können Zahlen, versteckte Leerzeichen und durch Formeln erzeugte leere Zeichenfolgen leicht zu ungenauen Ergebnissen führen. In diesem Leitfaden werden wir die zuverlässigsten Excel-Formeln zum Zählen von Text aufschlüsseln und Ihnen zeigen, wie Sie diese Lösungen mühelos automatisieren können.
- Wesentliche Excel-Formeln zum Zählen von Zellen mit Text
- Zellen mit Text in Microsoft Excel zählen
- Zellen mit Text in Excel automatisch zählen
- Umgang mit Sonderfällen: Häufige Fallstricke
Grundkonzepte: Wesentliche Excel-Formeln zum Zählen von Zellen mit Text
Um die Datenvalidierung zu meistern, müssen Sie zunächst die Funktionsweise der COUNTIF-Funktion verstehen. Sie ist das intuitivste Werkzeug, wenn es darum geht, Zellen mit Text in einer Excel-Datei zu zählen, aber ihre wahre Stärke liegt darin, wie Sie Ihre Kriterien definieren.
Die Grundlage: Verwendung von COUNTIF für schnelles Zählen
Die grundlegende Syntax, =COUNTIF(range, criteria), ermöglicht es Ihnen, einen Datensatz nach bestimmten Mustern zu durchsuchen. Wenn es um allgemeinen Text geht, verwenden wir Platzhalter, um Excel genau mitzuteilen, was als "Inhalt" gilt.
Vier häufige Szenarien zum Zählen von Text
Excel-Dateien enthalten oft mehrere Datentypen, daher müssen Sie möglicherweise einen oder mehrere der folgenden vier spezialisierten Ansätze verwenden:
Szenario 1: Der Standardweg (Allgemeiner Text)
- Formel:
=COUNTIF(range, "*") - Analyse: Dies ist die gebräuchlichste Excel-Formel zum Zählen von Zellen mit Text. Das Sternchen (*) fungiert als Platzhalter, der auf jede Textzeichenfolge passt, sodass nur Textwerte gezählt werden. Zum Beispiel werden Zellen, die "Apple", "Banana" oder "Text123" enthalten, berücksichtigt, während Zellen mit nur Zahlen ausgeschlossen werden.
Szenario 2: Der Datenbereinigungsweg (Ausschluss von Pseudo-Leerzeichen)
- Formel:
=COUNTIFS(range, "*", range, "<> ") - Analyse: Einige Zellen mögen leer erscheinen, enthalten aber tatsächlich ein einzelnes Leerzeichen. Durch die Kombination mehrerer Kriterien mit
COUNTIFSzählt diese Formel Zellen, die Text enthalten, während Werte, die genau ein Leerzeichen sind, ausgeschlossen werden. Zum Beispiel werden Einträge wie "Apple" oder "Text123" berücksichtigt, während Zellen, die " " enthalten, ignoriert werden. Dieser Ansatz schließt jedoch keine Zellen aus, die zwei oder mehr Leerzeichen enthalten, sodass er für präzisere Ergebnisse mit anderen Formeln kombiniert werden kann.
Szenario 3: Der technische Weg (Nur-Text)
- Formel:
=SUMPRODUCT(--ISTEXT(range)) - Analyse: Wenn ein Arbeitsblatt eine Mischung aus Daten, Fehlerwerten (#N/A) und logischen Werten (WAHR/FALSCH) enthält, bietet ISTEXT eine strikte Möglichkeit, Text zu identifizieren. Es prüft den zugrunde liegenden Datentyp anstelle der angezeigten Zeichen, sodass Werte wie "Apple" oder "Text123" gezählt werden, während Daten, boolesche Werte und Fehler ausgeschlossen werden.
Szenario 4: Der fortgeschrittene Weg (Spezifische Teilzeichenfolgen)
- Formel:
=COUNTIF(range, "*keyword*") - Analyse: Dieser Ansatz ist nützlich für die Protokollanalyse oder das Keyword-Tagging. Durch die Verwendung von Platzhaltern auf beiden Seiten zählt die Formel Zellen, die eine bestimmte Teilzeichenfolge an einer beliebigen Stelle im Text enthalten. Zum Beispiel werden Werte wie "error_404" oder "login_error" bei der Suche nach "error" berücksichtigt.
Wie man Zellen mit Text in Microsoft Excel zählt
Die direkte Verwendung dieser Formeln in Excel bietet mehrere praktische Vorteile. Die meisten Benutzer haben Excel bereits installiert und sind mit seiner Oberfläche vertraut, was es einfach macht, Formeln einzugeben, in Blättern zu navigieren und Ergebnisse schnell zu überprüfen. Die Anwendung der bedingten Formatierung kann als visuelle Plausibilitätsprüfung dienen und Ihnen helfen zu verifizieren, welche Zellen die Textkriterien erfüllen.
Schritte zum Zählen von Text in Excel mit COUNTIF
-
Wählen Sie einen Bereich aus, zum Beispiel B1:B10.
-
Geben Sie die entsprechende Formel in eine leere Zelle ein:
=COUNTIF(B1:B10, "*")=COUNTIF(B1:B10, "*keyword*")(optional)=COUNTIFS(B1:B10, "*", B1:B10, "<> ")(optional)
-
Drücken Sie Enter und die Zelle zeigt das Zählergebnis an.
Tipp: Wenn Sie sehen möchten, welche Zellen gezählt werden, können Sie die bedingte Formatierung mit einer Formel wie =ISTEXT(B1) verwenden, um die Textzellen hervorzuheben. Dies erleichtert die visuelle Identifizierung der gezählten Einträge.
Wie man Zellen mit Text in Excel automatisch mit Free Spire.XLS zählt
Manuelle Formatierung ist für einmalige Aufgaben in Ordnung, aber was ist, wenn Sie 500 Arbeitsmappen haben? Hier glänzt Free Spire.XLS. Es ermöglicht Ihnen, diese professionellen Logiken zum Zählen von Text programmatisch direkt in Ihre Excel-Dateien einzufügen.
Warum automatisieren?
Automatisierung eliminiert menschliche Fehler und spart Stunden repetitiver Klicks. Mit Free Spire.XLS können Sie komplexe Zählformeln in Excel-Zellen mit Textlogik in Sekundenschnelle auf Tausende von Zeilen anwenden.
Schritt-für-Schritt-Implementierung (Python-Beispiel)
Free Spire.XLS macht es einfach, COUNTIF-Formeln programmatisch anzuwenden. In diesem Beispiel zählen wir die Anzahl der Textzellen in einem bestimmten Bereich und schreiben das Ergebnis direkt in das Arbeitsblatt.
from spire.xls import *

# Erstellen Sie eine Arbeitsmappe und laden Sie eine Excel-Datei
workbook = Workbook()
workbook.LoadFromFile("/sample.xlsx")

# Holen Sie sich das erste Arbeitsblatt
sheet = workbook.Worksheets[0]

# Geben Sie den Zellbereich zum Zählen an
source_range = "B1:B10"

# Zählen Sie Zellen mit Text mit COUNTIF
sheet.Range["D1"].Text = "Textzellen gesamt:"
sheet.Range["E1"].Formula = f'=COUNTIF({source_range}, "*")'

# Speichern Sie die geänderte Excel-Datei
workbook.SaveToFile("/Text_Count_Simple.xlsx", ExcelVersion.Version2016)
workbook.Dispose()
Hier ist das Zählergebnis:
Umgang mit Sonderfällen: Häufige Fallstricke
Selbst erfahrene Excel-Benutzer können über subtile Daten-Eigenheiten stolpern. Beachten Sie beim Zählen von Text mit COUNTIF die folgenden Punkte:
- Leere Zeichenfolgen:
Zellen, die Formeln wie ="" enthalten, geben leere Zeichenfolgen anstelle von echten Leerzeichen zurück. Obwohl COUNTIF(range, "*") diese Zellen nicht zählt, können sie bei der visuellen Überprüfung von Daten oder bei der Verwendung von Funktionen wie COUNTA dennoch zu Verwirrung führen. Falls erforderlich, kann LEN(A2)>0 verwendet werden, um explizit auf nicht leeren Text zu testen.
- Versteckte Zeichen:
Daten, die von Webseiten oder externen Systemen kopiert wurden, enthalten oft geschützte Leerzeichen (CHAR(160)), die nicht von TRIM() entfernt werden. In solchen Fällen hilft die Kombination von SUBSTITUTE(A2, CHAR(160), "") mit TRIM(), um sicherzustellen, dass nur sinnvoller Text gezählt wird. Möglicherweise finden Sie auch das Konvertieren von Zahlen in Text in Excel nützlich, wenn Sie Daten für eine konsistente Zählung vorbereiten.
- Falsche Bereiche:
Fehlzählungen werden oft durch die Auswahl des falschen Zellbereichs verursacht und nicht durch die Verwendung einer falschen Formel. Überprüfen Sie immer die Start- und Endzellen, insbesondere beim Vergleich von manuellen Excel-Ergebnissen mit automatisierten Ausgaben.
- Leistung:
Die Verwendung integrierter Excel-Formeln wie COUNTIF ermöglicht es Free Spire.XLS, sich auf die native Formel-Engine von Excel für die Berechnung zu verlassen. Dieser Ansatz ist wesentlich effizienter als das Durchlaufen jeder Zelle im Code, um ihren Wert auszuwerten, insbesondere bei der Arbeit mit großen Arbeitsblättern.
Fazit
Zu lernen, wie man Zellen mit Text in Excel zählt, ist eine kleine Fähigkeit, die massive Dividenden in der Datengenauigkeit bringt. Indem Sie von manuellen Formeln zur Automatisierung mit Free Spire.XLS übergehen, verwandeln Sie eine mühsame Aufgabe in einen skalierbaren, fehlerfreien Arbeitsablauf. Egal, ob Sie einfache Listen oder komplexe Datenbanken verwalten, diese Tools stellen sicher, dass Ihre Erkenntnisse immer auf sauberen, gut kategorisierten Daten basieren.
Bereit, Ihr Tabellenkalkulationsspiel auf die nächste Stufe zu heben? Probieren Sie Free Spire.XLS aus und beginnen Sie, Ihre Datenvalidierung mit Leichtigkeit zu automatisieren!
Lesen Sie auch
Как подсчитать ячейки с текстом в Excel: Полное руководство
Управление огромными электронными таблицами часто похоже на поиск иголки в стоге сена. Независимо от того, очищаете ли вы необработанные данные или готовите финансовый отчет, одной из самых фундаментальных задач является знание, как подсчитать ячейки с текстом в Excel. Хотя это звучит просто, наличие чисел, скрытых пробелов и пустых строк, сгенерированных формулами, может легко привести к неточным результатам. В этом руководстве мы разберем самые надежные формулы Excel для подсчета текста и покажем, как легко автоматизировать эти решения.
- Основные формулы Excel для подсчета ячеек с текстом
- Подсчет ячеек с текстом в Microsoft Excel
- Автоматический подсчет ячеек с текстом в Excel
- Работа с крайними случаями: распространенные ошибки
Основные концепции: основные формулы Excel для подсчета ячеек с текстом
Чтобы освоить проверку данных, сначала необходимо понять механику функции COUNTIF. Это самый интуитивно понятный инструмент для подсчета ячеек с текстом в файле Excel, но его истинная сила заключается в том, как вы определяете свои критерии.
Основа: использование COUNTIF для быстрого подсчета
Базовый синтаксис, =COUNTIF(диапазон, критерий), позволяет сканировать набор данных на предмет определенных шаблонов. При работе с обычным текстом мы используем подстановочные знаки, чтобы точно указать Excel, что квалифицируется как "содержимое."
Четыре распространенных сценария подсчета текста
Файлы Excel часто содержат несколько типов данных, поэтому вам может потребоваться использовать один или несколько из следующих четырех специализированных подходов:
Сценарий 1: Стандартный способ (общий текст)
- Формула:
=COUNTIF(range, "*") - Анализ: Это самая распространенная формула Excel для подсчета ячеек с текстом. Звездочка (*) действует как подстановочный знак, который соответствует любой текстовой строке, поэтому подсчитываются только текстовые значения, например, ячейки, содержащие "Apple", "Banana", или "Text123" будут включены, в то время как ячейки только с числами исключаются.
Сценарий 2: Способ очистки данных (исключая псевдопустые ячейки)
- Формула:
=COUNTIFS(range, "*", range, "<> ") - Анализ: Некоторые ячейки могут казаться пустыми, но на самом деле содержат один пробел. Комбинируя несколько критериев с помощью
COUNTIFS, эта формула подсчитывает ячейки, содержащие текст, исключая при этом значения, которые представляют собой ровно один пробел. Например, записи типа "Apple" или "Text123" включаются, а ячейки, содержащие " " игнорируются. Однако этот подход не исключает ячейки, содержащие два или более пробелов, поэтому его можно комбинировать с другими формулами для получения более точных результатов.
Сценарий 3: Технический способ (только строгий текст)
- Формула:
=SUMPRODUCT(--ISTEXT(range)) - Анализ: Когда рабочий лист содержит смесь дат, значений ошибок (#N/A) и логических значений (TRUE/FALSE), ISTEXT предоставляет строгий способ идентификации текста. Он проверяет базовый тип данных, а не отображаемые символы, поэтому значения типа "Apple" или "Text123" подсчитываются, а даты, логические значения и ошибки исключаются.
Сценарий 4: Продвинутый способ (определенные подстроки)
- Формула:
=COUNTIF(range, "*keyword*") - Анализ: Этот подход полезен для анализа журналов или тегирования ключевых слов. Используя подстановочные знаки с обеих сторон, формула подсчитывает ячейки, содержащие определенную подстроку в любом месте текста, например, значения типа "error_404" или "login_error" включаются при поиске "error".
Как подсчитать ячейки с текстом в Microsoft Excel
Использование этих формул непосредственно в Excel дает несколько практических преимуществ. У большинства пользователей уже установлен Excel, и они знакомы с его интерфейсом, что позволяет легко вводить формулы, перемещаться по листам и быстро проверять результаты. Применение условного форматирования может служить визуальной проверкой, помогая вам убедиться, какие ячейки соответствуют текстовым критериям.
Шаги для подсчета текста в Excel с использованием COUNTIF
-
Выберите диапазон, например, B1:B10.
-
Введите соответствующую формулу в любую пустую ячейку:
=COUNTIF(B1:B10, "*")=COUNTIF(B1:B10, "*keyword*")(необязательно)=COUNTIFS(B1:B10, "*", B1:B10, "<> ")(необязательно)
-
Нажмите Enter, и ячейка покажет результат подсчета.
Совет: если вы хотите увидеть, какие ячейки подсчитываются, вы можете использовать условное форматирование с формулой типа =ISTEXT(B1), чтобы выделить текстовые ячейки. Это позволяет легко визуально идентифицировать подсчитанные записи.
Как автоматически подсчитывать ячейки с текстом в Excel с помощью Free Spire.XLS
Ручное форматирование подходит для разовых задач, но что, если у вас 500 рабочих книг? Именно здесь Free Spire.XLS проявляет себя во всей красе. Он позволяет программно внедрять эту профессиональную логику подсчета текста непосредственно в ваши файлы Excel.
Зачем автоматизировать?
Автоматизация устраняет человеческие ошибки и экономит часы повторяющихся кликов. С помощью Free Spire.XLS вы можете применять сложные формулы подсчета в ячейках Excel с текстовой логикой к тысячам строк за секунды.
Пошаговая реализация (пример на Python)
Free Spire.XLS позволяет легко применять формулы COUNTIF программно. В этом примере мы подсчитываем количество текстовых ячеек в указанном диапазоне и записываем результат непосредственно на рабочий лист.
from spire.xls import *

# Create a Workbook and load an Excel file
workbook = Workbook()
workbook.LoadFromFile("/sample.xlsx")

# Get the first worksheet
sheet = workbook.Worksheets[0]

# Specify the cell range for counting
source_range = "B1:B10"

# Count cells with text using COUNTIF
sheet.Range["D1"].Text = "Total Text Cells:"
sheet.Range["E1"].Formula = f'=COUNTIF({source_range}, "*")'

# Save the modified Excel file
workbook.SaveToFile("/Text_Count_Simple.xlsx", ExcelVersion.Version2016)
workbook.Dispose()
Вот результат подсчета:
Работа с крайними случаями: распространенные ошибки
Даже опытные пользователи Excel могут столкнуться с тонкими особенностями данных. При подсчете текста с помощью COUNTIF помните о следующих моментах:
- Пустые строки:
Ячейки, содержащие формулы типа ="", возвращают пустые строки, а не истинно пустые ячейки. Хотя COUNTIF(диапазон, "*") не подсчитывает эти ячейки, они все же могут вызывать путаницу при визуальном осмотре данных или при использовании таких функций, как COUNTA. При необходимости можно использовать LEN(A2)>0 для явной проверки на непустой текст.
- Скрытые символы:
Данные, скопированные с веб-страниц или из внешних систем, часто содержат неразрывные пробелы (CHAR(160)), которые не удаляются функцией TRIM(). В таких случаях комбинация SUBSTITUTE(A2, CHAR(160), "") с TRIM() помогает гарантировать, что подсчитывается только значимый текст. Вам также может быть полезно преобразование чисел в текст в Excel при подготовке данных для последовательного подсчета.
- Неправильные диапазоны:
Ошибки в подсчетах часто вызваны выбором неправильного диапазона ячеек, а не использованием неверной формулы. Всегда дважды проверяйте начальные и конечные ячейки, особенно при сравнении ручных результатов Excel с автоматизированными.
- Производительность:
Использование встроенных формул Excel, таких как COUNTIF, позволяет Free Spire.XLS полагаться на собственный механизм вычисления формул Excel. Этот подход значительно эффективнее, чем перебор каждой ячейки в коде для оценки ее значения, особенно при работе с большими рабочими листами.
Заключение
Умение подсчитывать ячейки с текстом в Excel — это небольшой навык, который приносит огромные дивиденды в точности данных. Переходя от ручных формул к автоматизации с помощью Free Spire.XLS, вы превращаете утомительную рутину в масштабируемый, безошибочный рабочий процесс. Независимо от того, управляете ли вы простыми списками или сложными базами данных, эти инструменты гарантируют, что ваши выводы всегда будут основаны на чистых, хорошо классифицированных данных.
Готовы поднять свою работу с электронными таблицами на новый уровень? Попробуйте Free Spire.XLS и начните с легкостью автоматизировать проверку данных!
Также читайте
Conversão de ODT para PDF facilitada: Ferramentas gratuitas e Python
Índice
Os arquivos ODT (OpenDocument Text) são amplamente utilizados para criar e editar documentos no LibreOffice ou Apache OpenOffice. No entanto, compartilhar ou distribuir arquivos ODT pode ser inconveniente, pois nem todos os dispositivos ou plataformas suportam este formato. Converter arquivos ODT para PDF garante que o layout, as fontes e a formatação do seu documento permaneçam intactos, facilitando o compartilhamento, a impressão ou o arquivamento de forma confiável.
Este artigo orienta você através de métodos práticos para converter ODT para PDF, abrangendo ferramentas online, software de desktop e automação baseada em Python para conversões ocasionais e em grande escala.
Navegação Rápida
- O que é um arquivo ODT e por que convertê-lo para PDF?
- Converter ODT para PDF Online (Ferramentas Gratuitas e Baseadas na Web)
- Converter ODT para PDF usando software de desktop
- Converter ODT para PDF programaticamente com Python
- Escolhendo o método certo para suas necessidades
- Perguntas Frequentes
O que é um arquivo ODT e por que convertê-lo para PDF?
Um arquivo ODT é um documento de processamento de texto baseado no padrão OpenDocument. É comumente usado em ambientes que priorizam formatos abertos e compatibilidade entre plataformas. Os arquivos ODT suportam texto rico, imagens, tabelas e estilos, tornando-os adequados para a criação de documentos do dia a dia.
No entanto, o ODT não é universalmente suportado fora das aplicações de escritório. Quando os documentos precisam ser compartilhados com um público mais amplo, enviados formalmente ou arquivados para uso a longo prazo, o PDF se torna a escolha mais prática.
A conversão de ODT para PDF ajuda a atender a várias necessidades comuns:
- Layout consistente: os PDFs são exibidos da mesma forma em todos os dispositivos e sistemas operacionais.
- Compatibilidade aprimorada: os leitores de PDF estão amplamente disponíveis e não requerem software de edição.
- Integridade do documento: os PDFs reduzem o risco de alterações acidentais no conteúdo.
- Distribuição profissional: os PDFs são frequentemente preferidos para relatórios, contratos e documentos oficiais.
Converter ODT para PDF Online (Ferramentas Gratuitas e Baseadas na Web)
Os conversores online costumam ser a maneira mais rápida de converter um arquivo ODT para PDF, especialmente para usuários que precisam apenas de conversões ocasionais e não desejam instalar software adicional.
Passo a passo: Converter ODT para PDF Online
- Abra um serviço de conversão de ODT para PDF baseado na web em seu navegador (por exemplo, Conversor de ODT para PDF CloudXDocs).

- Carregue o arquivo ODT do seu dispositivo local ou armazenamento em nuvem compatível.
- Aguarde enquanto o arquivo é processado e convertido no servidor.
- Baixe o arquivo PDF resultante para o seu computador.
A maioria das ferramentas online segue este fluxo de trabalho simples, tornando-as acessíveis mesmo para usuários não técnicos.
Vantagens da conversão online
- Nenhuma instalação ou configuração necessária
- Acessível de qualquer navegador moderno
- Adequado para conversões rápidas e únicas
- Muitas vezes disponível gratuitamente com uso básico
Limitações dos conversores online
As ferramentas online geralmente impõem limites de tamanho de arquivo ou limites diários de conversão. O upload de documentos para servidores de terceiros também pode ser inadequado para arquivos confidenciais ou sensíveis. Além disso, a formatação complexa - como fontes personalizadas ou layouts avançados - nem sempre pode ser preservada com precisão, e a conversão em lote raramente é suportada.
Nos casos em que a edição e a colaboração são necessárias, converter arquivos ODT para o formato Word pode ser uma opção mais prática do que o PDF.
Converter ODT para PDF usando software de desktop
Os aplicativos de escritório de desktop fornecem um ambiente mais controlado para a conversão de arquivos ODT para PDF. O LibreOffice e o Apache OpenOffice incluem funcionalidade de exportação de PDF integrada.
Passo a passo: Converter ODT para PDF com LibreOffice ou OpenOffice
- Abra o arquivo ODT no LibreOffice Writer (ou Apache OpenOffice Writer).
- Revise o documento para garantir que a formatação e o layout estejam corretos.
- Clique em Arquivo e selecione Exportar como PDF.
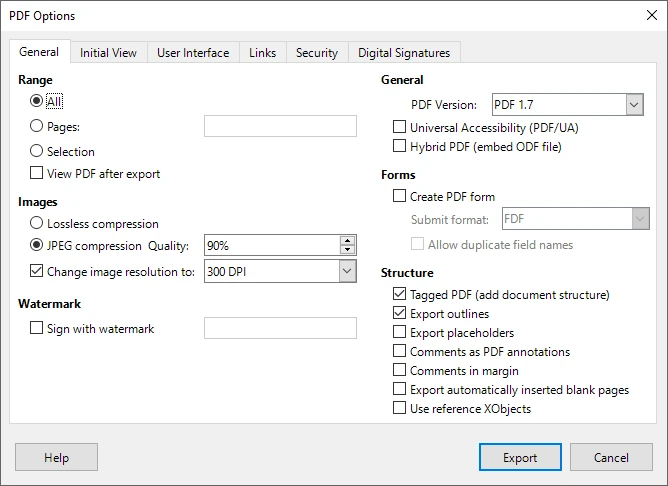
- Configure as opções de exportação, como qualidade da imagem, incorporação de fontes ou intervalo de páginas.
- Salve o arquivo PDF exportado em seu sistema local.
Essa abordagem oferece aos usuários maior confiança no resultado final, especialmente para documentos visualmente complexos.
Vantagens da conversão baseada em desktop
- Melhor preservação da formatação e do layout
- Não há necessidade de enviar arquivos para servidores externos
- Maior controle sobre as configurações de exportação de PDF
- Confiável para documentos com tabelas, imagens e estilos
Limitações da conversão manual
A conversão manual requer a interação do usuário para cada documento, tornando-a ineficiente para fluxos de trabalho de alto volume. Também é difícil de automatizar e inadequada para ambientes de servidor ou sem interface gráfica, onde nenhuma interface gráfica está disponível.
Quando os métodos online e manuais não são suficientes
Existem muitos cenários em que as ferramentas online e o software de desktop não atendem mais aos requisitos práticos. À medida que o volume de documentos aumenta ou os fluxos de trabalho se tornam mais complexos, a conversão manual rapidamente se transforma em um gargalo.
Situações típicas em que os métodos tradicionais falham incluem:
- Converter grandes números de arquivos ODT regularmente
- Executar conversões automaticamente em um servidor ou sistema de backend
- Integrar a conversão de documentos em um aplicativo ou serviço existente
- Garantir uma saída consistente sem intervenção do usuário
- Operar em ambientes sem uma interface gráfica
Nesses casos, uma abordagem programática oferece maior confiabilidade, escalabilidade e controle.
Converter ODT para PDF programaticamente com Python
O Python é amplamente utilizado para automação, processamento de dados e desenvolvimento de backend. Usar o Python para converter arquivos ODT em PDF permite que o processo seja totalmente automatizado e integrado a sistemas maiores.
Por que usar o Python para a conversão de ODT para PDF?
O Python permite o processamento em lote, fluxos de trabalho repetíveis e integração perfeita com aplicativos existentes. Uma vez implementadas, as conversões podem ser executadas sem supervisão, garantindo resultados consistentes e reduzindo o esforço manual.
Usando o Spire.Doc para Python
Spire.Doc para Python é uma biblioteca de processamento de documentos que suporta formatos OpenDocument e permite a conversão direta de ODT para PDF. Ele preserva texto, imagens e layout sem depender do Microsoft Word ou LibreOffice, tornando-o adequado para uso em servidor e empresarial.
Instalação
O Spire.Doc para Python pode ser instalado via pip:
pip install spire-doc
Exemplo: Converter ODT para PDF com Python
from spire.doc import Document, FileFormat
# Crie um objeto Document e carregue o arquivo ODT
doc = Document()
doc.LoadFromFile("Sample.odt", FileFormat.Odt)
# Salve o documento ODT como um arquivo PDF
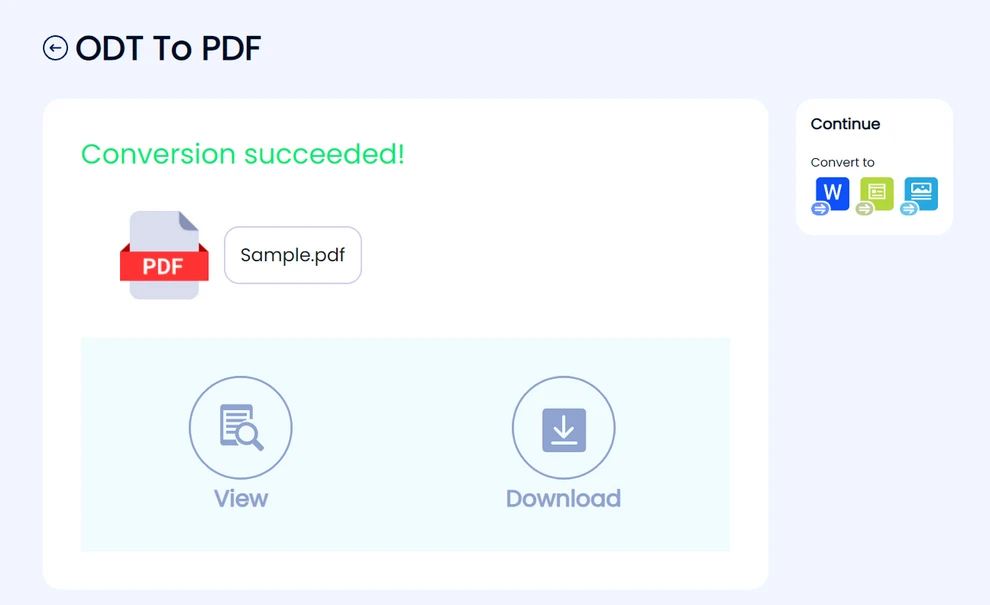
doc.SaveToFile("output/ODTToPDF.pdf", FileFormat.PDF)
doc.Close()
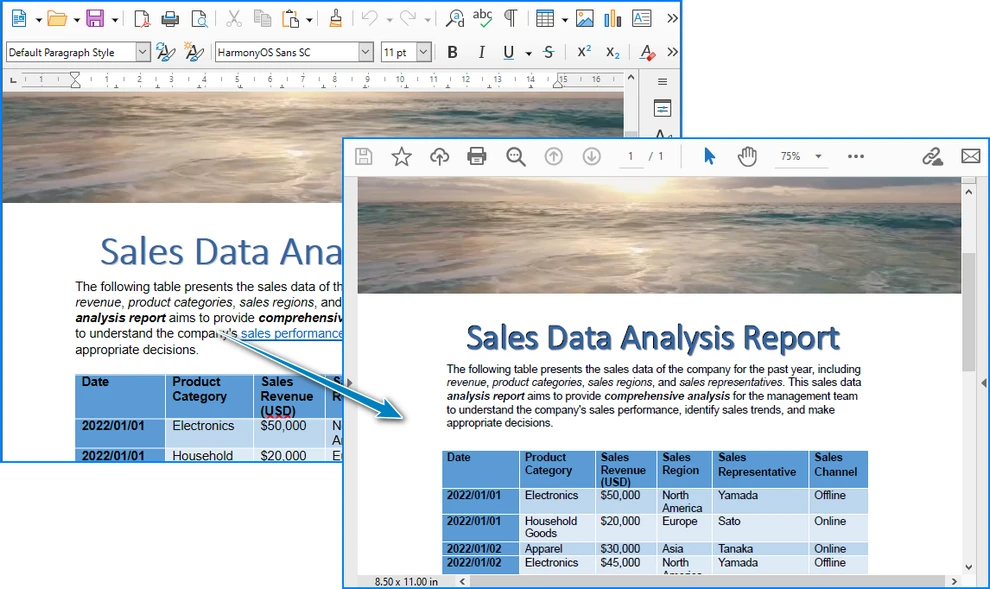
Abaixo está uma prévia do arquivo PDF convertido de ODT usando Python:
Essa abordagem pode ser facilmente estendida para lidar com conversões em lote ou integrada a fluxos de trabalho automatizados.
Depois de converter o arquivo ODT para PDF, você pode editar ainda mais o PDF gerado usando Python, como adicionar marcas d'água, definir metadados ou aplicar opções de segurança adicionais.
Salvar ODT como PDF em um fluxo (opcional)
Em aplicativos de backend ou baseados na web, você pode querer gerar um arquivo PDF na memória sem gravá-lo no disco. O Spire.Doc para Python permite salvar o documento convertido em um fluxo.
from spire.doc import Document, FileFormat, Stream

doc = Document()
doc.LoadFromFile("Sample.odt", FileFormat.Odt)

# Salve o documento ODT em um fluxo de PDF
pdf_stream = Stream()
doc.SaveToStream(pdf_stream, FileFormat.PDF)
doc.Close()

# Obtenha os bytes do PDF do fluxo
pdf_bytes = bytes(pdf_stream.ToArray())
Essa abordagem é útil para retornar arquivos PDF em APIs da web, fazer upload para armazenamento em nuvem ou processar documentos na memória.
Se o seu fluxo de trabalho exigir processamento adicional de arquivos PDF na memória - como mesclar documentos, adicionar marcas d'água ou aplicar configurações de segurança - pode ser útil explorar técnicas para trabalhar com documentos PDF diretamente em fluxos.
Escolhendo o método certo para suas necessidades
A melhor maneira de converter ODT para PDF depende da frequência com que você executa a tarefa e do nível de controle necessário.
- Ferramentas online são ideais para conversões rápidas e ocasionais quando a conveniência é a prioridade.
- Software de desktop funciona bem para usuários que precisam de melhor controle de formatação e convertem arquivos manualmente.
- A automação baseada em Python é a opção mais adequada para processamento em grande escala, sistemas de backend e fluxos de trabalho empresariais.
Compreender o seu cenário de uso ajuda a garantir que você escolha um método que equilibre eficiência, confiabilidade e manutenibilidade.
Perguntas frequentes sobre a conversão de ODT para PDF
É seguro converter ODT para PDF online?
Os conversores online podem ser convenientes para documentos não sensíveis, mas podem não ser adequados para documentos sensíveis devido a preocupações com a privacidade.
A formatação do documento mudará após a conversão?
Documentos simples geralmente são convertidos com precisão, enquanto layouts complexos podem se beneficiar de métodos de desktop ou programáticos.
Vários arquivos ODT podem ser convertidos de uma vez?
A conversão em lote raramente é suportada por ferramentas online e é ineficiente manualmente. As soluções programáticas lidam com isso de forma mais eficaz.
As conversões baseadas em Python exigem software de escritório?
Não. Bibliotecas como o Spire.Doc para Python operam independentemente dos aplicativos de escritório.
Conclusão
A conversão de arquivos ODT para PDF pode ser realizada de várias maneiras, cada uma adequada a diferentes necessidades. Ferramentas online e aplicativos de desktop são eficazes para o uso diário, enquanto a automação baseada em Python fornece uma solução escalável para cenários avançados e de alto volume. Ao selecionar o método apropriado, você pode garantir uma conversão de documentos precisa, eficiente e confiável.
Veja também
ODT를 PDF로 쉽게 변환: 무료 도구 및 Python
ODT 파일(OpenDocument Text)은 LibreOffice 또는 Apache OpenOffice에서 문서를 만들고 편집하는 데 널리 사용됩니다. 그러나 모든 장치나 플랫폼이 이 형식을 지원하는 것은 아니므로 ODT 파일을 공유하거나 배포하는 것이 불편할 수 있습니다. ODT 파일을 PDF로 변환하면 문서 레이아웃, 글꼴 및 서식이 그대로 유지되어 안정적으로 공유, 인쇄 또는 보관하기가 더 쉬워집니다.
이 문서에서는 가끔씩 또는 대규모 변환을 위해 온라인 도구, 데스크톱 소프트웨어 및 Python 기반 자동화를 다루면서 ODT를 PDF로 변환하는 실용적인 방법을 안내합니다.
빠른 탐색
- ODT 파일이란 무엇이며 PDF로 변환해야 하는 이유는 무엇입니까?
- 온라인에서 ODT를 PDF로 변환 (무료 및 웹 기반 도구)
- 데스크톱 소프트웨어를 사용하여 ODT를 PDF로 변환
- Python을 사용하여 프로그래밍 방식으로 ODT를 PDF로 변환
- 필요에 맞는 올바른 방법 선택
- 자주 묻는 질문
ODT 파일이란 무엇이며 PDF로 변환해야 하는 이유는 무엇입니까?
ODT 파일은 OpenDocument 표준을 기반으로 하는 워드 프로세싱 문서입니다. 개방형 형식과 플랫폼 간 호환성을 우선시하는 환경에서 일반적으로 사용됩니다. ODT 파일은 서식 있는 텍스트, 이미지, 표 및 스타일을 지원하므로 일상적인 문서 작성에 적합합니다.
그러나 ODT는 사무용 응용 프로그램 외부에서 보편적으로 지원되지는 않습니다. 문서를 더 많은 사람들과 공유하거나, 공식적으로 제출하거나, 장기간 사용하기 위해 보관해야 하는 경우 PDF가 더 실용적인 선택이 됩니다.
ODT를 PDF로 변환하면 다음과 같은 몇 가지 일반적인 요구 사항을 해결하는 데 도움이 됩니다.
- 일관된 레이아웃: PDF는 모든 장치 및 운영 체제에서 동일한 방식으로 표시됩니다.
- 향상된 호환성: PDF 리더는 널리 사용 가능하며 편집 소프트웨어가 필요하지 않습니다.
- 문서 무결성: PDF는 우발적인 내용 변경의 위험을 줄입니다.
- 전문적인 배포: PDF는 보고서, 계약서 및 공식 문서에 자주 선호됩니다.
온라인에서 ODT를 PDF로 변환 (무료 및 웹 기반 도구)
온라인 변환기는 특히 가끔씩 변환이 필요하고 추가 소프트웨어를 설치하고 싶지 않은 사용자에게 ODT 파일을 PDF로 변환하는 가장 빠른 방법인 경우가 많습니다.
단계별: 온라인에서 ODT를 PDF로 변환
- 브라우저에서 웹 기반 ODT to PDF 변환 서비스를 엽니다(예: CloudXDocs ODT to PDF 변환기).
- 로컬 장치 또는 지원되는 클라우드 저장소에서 ODT 파일을 업로드합니다.
- 서버에서 파일이 처리되고 변환되는 동안 기다립니다.
- 결과 PDF 파일을 컴퓨터에 다운로드합니다.
대부분의 온라인 도구는 이 간단한 워크플로를 따르므로 기술에 익숙하지 않은 사용자도 액세스할 수 있습니다.
온라인 변환의 장점
- 설치나 설정이 필요 없음
- 모든 최신 브라우저에서 액세스 가능
- 빠른 일회성 변환에 적합
- 기본 사용 시 무료로 제공되는 경우가 많음
온라인 변환기의 한계
온라인 도구는 일반적으로 파일 크기 제한이나 일일 변환 한도를 부과합니다. 또한 타사 서버에 문서를 업로드하는 것은 기밀 또는 민감한 파일에 적합하지 않을 수 있습니다. 또한 사용자 지정 글꼴이나 고급 레이아웃과 같은 복잡한 서식은 항상 정확하게 보존되지 않을 수 있으며 일괄 변환은 거의 지원되지 않습니다.
편집 및 공동 작업이 필요한 경우 ODT 파일을 Word 형식으로 변환하는 것이 PDF보다 더 실용적인 옵션이 될 수 있습니다.
데스크톱 소프트웨어를 사용하여 ODT를 PDF로 변환
데스크톱 오피스 응용 프로그램은 ODT 파일을 PDF로 변환하기 위한 보다 제어된 환경을 제공합니다. LibreOffice와 Apache OpenOffice 모두 내장된 PDF 내보내기 기능이 있습니다.
단계별: LibreOffice 또는 OpenOffice로 ODT를 PDF로 변환
- LibreOffice Writer(또는 Apache OpenOffice Writer)에서 ODT 파일을 엽니다.
- 문서를 검토하여 서식과 레이아웃이 올바른지 확인합니다.
- 파일을 클릭하고 PDF로 내보내기를 선택합니다.
- 이미지 품질, 글꼴 포함 또는 페이지 범위와 같은 내보내기 옵션을 구성합니다.
- 내보낸 PDF 파일을 로컬 시스템에 저장합니다.
이 접근 방식은 특히 시각적으로 복잡한 문서의 경우 최종 출력에 대한 사용자 신뢰도를 높여줍니다.
데스크톱 기반 변환의 장점
- 서식 및 레이아웃 보존 향상
- 외부 서버에 파일을 업로드할 필요 없음
- PDF 내보내기 설정에 대한 제어 강화
- 표, 이미지 및 스타일이 있는 문서에 신뢰할 수 있음
수동 변환의 한계
수동 변환은 각 문서에 대한 사용자 상호 작용이 필요하므로 대용량 워크플로에는 비효율적입니다. 또한 자동화하기 어렵고 그래픽 인터페이스가 없는 서버 측 또는 헤드리스 환경에는 적합하지 않습니다.
온라인 및 수동 방법이 충분하지 않은 경우
온라인 도구와 데스크톱 소프트웨어가 더 이상 실용적인 요구 사항을 충족하지 못하는 시나리오가 많이 있습니다. 문서 볼륨이 증가하거나 워크플로가 더 복잡해지면 수동 변환은 빠르게 병목 현상이 됩니다.
기존 방법이 부족한 일반적인 상황은 다음과 같습니다.
- 정기적으로 많은 수의 ODT 파일 변환
- 서버 또는 백엔드 시스템에서 자동으로 변환 실행
- 기존 응용 프로그램 또는 서비스에 문서 변환 통합
- 사용자 개입 없이 일관된 출력 보장
- 그래픽 인터페이스가 없는 환경에서 작동
이러한 경우 프로그래밍 방식 접근 방식은 더 뛰어난 안정성, 확장성 및 제어 기능을 제공합니다.
Python을 사용하여 프로그래밍 방식으로 ODT를 PDF로 변환
Python은 자동화, 데이터 처리 및 백엔드 개발에 널리 사용됩니다. Python을 사용하여 ODT 파일을 PDF로 변환하면 프로세스를 완전히 자동화하고 더 큰 시스템에 통합할 수 있습니다.
ODT to PDF 변환에 Python을 사용하는 이유는 무엇입니까?
Python은 일괄 처리, 반복 가능한 워크플로 및 기존 응용 프로그램과의 원활한 통합을 가능하게 합니다. 일단 구현되면 변환을 무인으로 실행하여 수동 작업을 줄이면서 일관된 결과를 보장할 수 있습니다.
Spire.Doc for Python 사용
Spire.Doc for Python은 OpenDocument 형식을 지원하고 ODT에서 PDF로의 직접 변환을 가능하게 하는 문서 처리 라이브러리입니다. Microsoft Word나 LibreOffice에 의존하지 않고 텍스트, 이미지 및 레이아웃을 보존하므로 서버 측 및 엔터프라이즈 사용에 적합합니다.
설치
Spire.Doc for Python은 pip를 통해 설치할 수 있습니다.
pip install spire-doc
예: Python으로 ODT를 PDF로 변환
from spire.doc import Document, FileFormat

# Document 객체를 만들고 ODT 파일을 로드합니다.
doc = Document()
doc.LoadFromFile("Sample.odt", FileFormat.Odt)

# ODT 문서를 PDF 파일로 저장합니다.
doc.SaveToFile("output/ODTToPDF.pdf", FileFormat.PDF)
doc.Close()
아래는 Python을 사용하여 ODT에서 변환된 PDF 파일의 미리보기입니다.
이 접근 방식은 일괄 변환을 처리하거나 자동화된 워크플로에 통합되도록 쉽게 확장할 수 있습니다.
ODT 파일을 PDF로 변환한 후 워터마크 추가, 메타데이터 설정 또는 추가 보안 옵션 적용과 같이 Python을 사용하여 생성된 PDF를 추가로 편집할 수 있습니다.
ODT를 스트림에 PDF로 저장 (선택 사항)
백엔드 또는 웹 기반 응용 프로그램에서는 디스크에 쓰지 않고 메모리에서 PDF 파일을 생성할 수 있습니다. Spire.Doc for Python을 사용하면 변환된 문서를 스트림에 저장할 수 있습니다.
from spire.doc import Document, FileFormat, Stream

doc = Document()
doc.LoadFromFile("Sample.odt", FileFormat.Odt)

# ODT 문서를 PDF 스트림에 저장합니다.
pdf_stream = Stream()
doc.SaveToStream(pdf_stream, FileFormat.PDF)
doc.Close()

# 스트림에서 PDF 바이트를 가져옵니다.
pdf_bytes = bytes(pdf_stream.ToArray())
이 접근 방식은 웹 API에서 PDF 파일을 반환하거나, 클라우드 저장소에 업로드하거나, 메모리에서 문서를 처리하는 데 유용합니다.
워크플로에서 문서 병합, 워터마크 추가 또는 보안 설정 적용과 같이 메모리에서 PDF 파일을 추가로 처리해야 하는 경우 스트림에서 직접 PDF 문서로 작업하는 기술을 탐색하는 것이 도움이 될 수 있습니다.
필요에 맞는 올바른 방법 선택
ODT를 PDF로 변환하는 가장 좋은 방법은 작업을 수행하는 빈도와 필요한 제어 수준에 따라 다릅니다.
- 온라인 도구는 편의성이 우선일 때 빠르고 가끔씩 변환하는 데 이상적입니다.
- 데스크톱 소프트웨어는 더 나은 서식 제어가 필요하고 파일을 수동으로 변환하는 사용자에게 적합합니다.
- Python 기반 자동화는 대규모 처리, 백엔드 시스템 및 엔터프라이즈 워크플로에 가장 적합한 옵션입니다.
사용 시나리오를 이해하면 효율성, 안정성 및 유지 관리 가능성의 균형을 맞추는 방법을 선택하는 데 도움이 됩니다.
ODT를 PDF로 변환하는 것에 대한 자주 묻는 질문
온라인에서 ODT를 PDF로 변환하는 것이 안전한가요?
온라인 변환기는 민감하지 않은 문서에는 편리할 수 있지만 개인 정보 보호 문제로 인해 민감한 문서에는 적합하지 않을 수 있습니다.
변환 후 문서 서식이 변경됩니까?
단순한 문서는 일반적으로 정확하게 변환되지만 복잡한 레이아웃은 데스크톱 또는 프로그래밍 방식의 이점을 누릴 수 있습니다.
여러 ODT 파일을 한 번에 변환할 수 있습니까?
일괄 변환은 온라인 도구에서 거의 지원되지 않으며 수동으로는 비효율적입니다. 프로그래밍 방식 솔루션은 이를 보다 효과적으로 처리합니다.
Python 기반 변환에 오피스 소프트웨어가 필요합니까?
아니요. Spire.Doc for Python과 같은 라이브러리는 오피스 응용 프로그램과 독립적으로 작동합니다.
결론
ODT 파일을 PDF로 변환하는 것은 여러 가지 방법으로 수행할 수 있으며 각 방법은 다양한 요구에 적합합니다. 온라인 도구와 데스크톱 응용 프로그램은 일상적인 사용에 효과적이며, Python 기반 자동화는 고급 및 대용량 시나리오에 확장 가능한 솔루션을 제공합니다. 적절한 방법을 선택하면 정확하고 효율적이며 신뢰할 수 있는 문서 변환을 보장할 수 있습니다.
참고 항목
Convertire ODT in PDF è facile: strumenti gratuiti e Python
Indice
I file ODT (OpenDocument Text) sono ampiamente utilizzati per creare e modificare documenti in LibreOffice o Apache OpenOffice. Tuttavia, la condivisione o la distribuzione di file ODT può essere scomoda, poiché non tutti i dispositivi o le piattaforme supportano questo formato. La conversione di file ODT in PDF garantisce che il layout, i caratteri e la formattazione del documento rimangano intatti, rendendolo più facile da condividere, stampare o archiviare in modo affidabile.
Questo articolo ti guida attraverso metodi pratici per convertire ODT in PDF, coprendo strumenti online, software desktop e automazione basata su Python sia per conversioni occasionali che su larga scala.
Navigazione Rapida
- Cos'è un file ODT e perché convertirlo in PDF?
- Converti ODT in PDF online (strumenti gratuiti e basati sul web)
- Converti ODT in PDF utilizzando software desktop
- Converti ODT in PDF programmaticamente con Python
- Scegliere il metodo giusto per le tue esigenze
- Domande frequenti
Cos'è un file ODT e perché convertirlo in PDF?
Un file ODT è un documento di elaborazione testi basato sullo standard OpenDocument. È comunemente usato in ambienti che danno priorità ai formati aperti e alla compatibilità multipiattaforma. I file ODT supportano testo ricco, immagini, tabelle e stili, rendendoli adatti per la creazione di documenti di tutti i giorni.
Tuttavia, ODT non è universalmente supportato al di fuori delle applicazioni per ufficio. Quando i documenti devono essere condivisi con un pubblico più ampio, inviati formalmente o archiviati per un uso a lungo termine, il PDF diventa la scelta più pratica.
La conversione da ODT a PDF aiuta a soddisfare diverse esigenze comuni:
- Layout coerente: i PDF vengono visualizzati allo stesso modo su tutti i dispositivi e sistemi operativi.
- Compatibilità migliorata: i lettori PDF sono ampiamente disponibili e non richiedono software di modifica.
- Integrità del documento: i PDF riducono il rischio di modifiche accidentali del contenuto.
- Distribuzione professionale: i PDF sono spesso preferiti per rapporti, contratti e documenti ufficiali.
Converti ODT in PDF online (strumenti gratuiti e basati sul web)
I convertitori online sono spesso il modo più veloce per convertire un file ODT in PDF, specialmente per gli utenti che necessitano solo di conversioni occasionali e non vogliono installare software aggiuntivo.
Passo dopo passo: converti ODT in PDF online
- Apri un servizio di conversione da ODT a PDF basato sul web nel tuo browser (ad esempio, CloudXDocs ODT to PDF Converter).
- Carica il file ODT dal tuo dispositivo locale o da un archivio cloud supportato.
- Attendi mentre il file viene elaborato e convertito sul server.
- Scarica il file PDF risultante sul tuo computer.
La maggior parte degli strumenti online segue questo semplice flusso di lavoro, rendendoli accessibili anche agli utenti non tecnici.
Vantaggi della conversione online
- Nessuna installazione o configurazione richiesta
- Accessibile da qualsiasi browser moderno
- Adatto per conversioni rapide e una tantum
- Spesso disponibile gratuitamente con un utilizzo di base
Limitazioni dei convertitori online
Gli strumenti online in genere impongono limiti di dimensione dei file o limiti di conversione giornalieri. Il caricamento di documenti su server di terze parti potrebbe anche non essere adatto per file riservati o sensibili. Inoltre, la formattazione complessa, come caratteri personalizzati o layout avanzati, potrebbe non essere sempre conservata accuratamente e la conversione batch è raramente supportata.
Nei casi in cui sono richieste modifiche e collaborazione, la conversione di file ODT in formato Word può essere un'opzione più pratica del PDF.
Converti ODT in PDF utilizzando software desktop
Le applicazioni per ufficio desktop forniscono un ambiente più controllato per la conversione di file ODT in PDF. Sia LibreOffice che Apache OpenOffice includono funzionalità di esportazione PDF integrate.
Passo dopo passo: converti ODT in PDF con LibreOffice o OpenOffice
- Apri il file ODT in LibreOffice Writer (o Apache OpenOffice Writer).
- Rivedi il documento per assicurarti che la formattazione e il layout siano corretti.
- Fai clic su File e seleziona Esporta come PDF.
- Configura le opzioni di esportazione come la qualità dell'immagine, l'incorporamento dei caratteri o l'intervallo di pagine.
- Salva il file PDF esportato sul tuo sistema locale.
Questo approccio offre agli utenti una maggiore fiducia nell'output finale, in particolare per i documenti visivamente complessi.
Vantaggi della conversione basata su desktop
- Migliore conservazione della formattazione e del layout
- Non è necessario caricare file su server esterni
- Maggiore controllo sulle impostazioni di esportazione PDF
- Affidabile per documenti con tabelle, immagini e stili
Limitazioni della conversione manuale
La conversione manuale richiede l'interazione dell'utente per ogni documento, rendendola inefficiente per flussi di lavoro ad alto volume. È anche difficile da automatizzare e non adatta per ambienti lato server o headless in cui non è disponibile un'interfaccia grafica.
Quando i metodi online e manuali non sono sufficienti
Ci sono molti scenari in cui gli strumenti online e il software desktop non soddisfano più i requisiti pratici. Man mano che il volume dei documenti aumenta o i flussi di lavoro diventano più complessi, la conversione manuale si trasforma rapidamente in un collo di bottiglia.
Le situazioni tipiche in cui i metodi tradizionali non sono sufficienti includono:
- Conversione di un gran numero di file ODT su base regolare
- Esecuzione automatica delle conversioni su un server o sistema backend
- Integrazione della conversione di documenti in un'applicazione o servizio esistente
- Garantire un output coerente senza l'intervento dell'utente
- Operare in ambienti senza un'interfaccia grafica
In questi casi, un approccio programmatico offre maggiore affidabilità, scalabilità e controllo.
Converti ODT in PDF programmaticamente con Python
Python è ampiamente utilizzato per l'automazione, l'elaborazione dei dati e lo sviluppo di backend. L'utilizzo di Python per convertire i file ODT in PDF consente di automatizzare completamente il processo e di integrarlo in sistemi più grandi.
Perché usare Python per la conversione da ODT a PDF?
Python consente l'elaborazione batch, flussi di lavoro ripetibili e una perfetta integrazione con le applicazioni esistenti. Una volta implementate, le conversioni possono essere eseguite senza supervisione, garantendo risultati coerenti e riducendo lo sforzo manuale.
Utilizzo di Spire.Doc per Python
Spire.Doc per Python è una libreria di elaborazione di documenti che supporta i formati OpenDocument e consente la conversione diretta da ODT a PDF. Conserva testo, immagini e layout senza fare affidamento su Microsoft Word o LibreOffice, rendendolo adatto per l'uso lato server e aziendale.
Installazione
Spire.Doc per Python può essere installato tramite pip:
pip install spire-doc
Esempio: converti ODT in PDF con Python
from spire.doc import Document, FileFormat

# Create a Document object and load the ODT file
doc = Document()
doc.LoadFromFile("Sample.odt", FileFormat.Odt)

# Save the ODT document as a PDF file
doc.SaveToFile("output/ODTToPDF.pdf", FileFormat.PDF)
doc.Close()
Di seguito è riportata un'anteprima del file PDF convertito da ODT utilizzando Python:
Questo approccio può essere facilmente esteso per gestire conversioni batch o integrato in flussi di lavoro automatizzati.
Dopo aver convertito il file ODT in PDF, puoi modificare ulteriormente il PDF generato utilizzando Python, ad esempio aggiungendo filigrane, impostando metadati o applicando opzioni di sicurezza aggiuntive.
Salva ODT come PDF in uno stream (opzionale)
Nelle applicazioni backend o basate sul web, potresti voler generare un file PDF in memoria senza scriverlo su disco. Spire.Doc per Python consente di salvare il documento convertito in uno stream.
from spire.doc import Document, FileFormat, Stream

doc = Document()
doc.LoadFromFile("Sample.odt", FileFormat.Odt)

# Save the ODT document to a PDF stream
pdf_stream = Stream()
doc.SaveToStream(pdf_stream, FileFormat.PDF)
doc.Close()

# Get PDF bytes from the stream
pdf_bytes = bytes(pdf_stream.ToArray())
Questo approccio è utile per restituire file PDF nelle API web, caricarli su un archivio cloud o elaborare documenti in memoria.
Se il tuo flusso di lavoro richiede un'ulteriore elaborazione dei file PDF in memoria, come l'unione di documenti, l'aggiunta di filigrane o l'applicazione di impostazioni di sicurezza, potresti trovare utile esplorare le tecniche per lavorare con i documenti PDF direttamente negli stream.
Scegliere il metodo giusto per le tue esigenze
Il modo migliore per convertire ODT in PDF dipende dalla frequenza con cui si esegue l'attività e dal livello di controllo richiesto.
- Gli strumenti online sono ideali per conversioni rapide e occasionali quando la praticità è la priorità.
- Il software desktop funziona bene per gli utenti che necessitano di un migliore controllo della formattazione e convertono i file manualmente.
- L'automazione basata su Python è l'opzione più adatta per l'elaborazione su larga scala, i sistemi backend e i flussi di lavoro aziendali.
Comprendere il tuo scenario di utilizzo aiuta a garantire la scelta di un metodo che bilanci efficienza, affidabilità e manutenibilità.
Domande frequenti sulla conversione da ODT a PDF
È sicuro convertire ODT in PDF online?
I convertitori online possono essere convenienti per i documenti non sensibili, ma potrebbero non essere adatti per i documenti sensibili a causa di problemi di privacy.
La formattazione del documento cambierà dopo la conversione?
I documenti semplici di solito vengono convertiti accuratamente, mentre i layout complessi possono trarre vantaggio da metodi desktop o programmatici.
È possibile convertire più file ODT contemporaneamente?
La conversione batch è raramente supportata dagli strumenti online ed è inefficiente manualmente. Le soluzioni programmatiche gestiscono questo problema in modo più efficace.
Le conversioni basate su Python richiedono un software per ufficio?
No. Librerie come Spire.Doc per Python funzionano indipendentemente dalle applicazioni per ufficio.
Conclusione
La conversione di file ODT in PDF può essere eseguita in diversi modi, ognuno adatto a esigenze diverse. Gli strumenti online e le applicazioni desktop sono efficaci per l'uso quotidiano, mentre l'automazione basata su Python fornisce una soluzione scalabile per scenari avanzati e ad alto volume. Selezionando il metodo appropriato, è possibile garantire una conversione dei documenti accurata, efficiente e affidabile.