7 modi intelligenti per inserire blocchi di codice nei documenti Word
Indice
- Metodo 1: Copia il codice da un IDE (evidenziazione della sintassi)
- Metodo 2: Applica uno stile di codice personalizzato in Word
- Metodo 3: Riquadra il codice usando tabelle a 1 cella
- Metodo 4: Aggiungi frammenti di codice a Word come immagini
- Metodo 5: Incorpora il codice come oggetto documento
- Metodo 6: Formatta i blocchi di codice usando i componenti aggiuntivi di Word
- Metodo 7: Automatizza l'inserimento del codice tramite Python
- Confronto: Scegliere il metodo giusto
- Considerazioni finali
- Domande frequenti
Includere frammenti di codice nei documenti di Word è una necessità comune per sviluppatori, redattori tecnici ed educatori. Tuttavia, ottenere blocchi di codice leggibili, visivamente accattivanti e manutenibili in Word può essere complicato.
Alcuni utenti si limitano a copiare e incollare da un IDE, il che può alterare la formattazione, mentre altri applicano manualmente stili al testo o usano screenshot, operazioni che possono richiedere molto tempo. Per i documenti che richiedono coerenza, modifiche o automazione, la scelta del metodo giusto può far risparmiare ore di lavoro.
In questa guida, trattiamo sette modi intelligenti per inserire blocchi di codice in Word — da approcci manuali rapidi a flussi di lavoro completamente automatizzati utilizzando Python e Spire.Doc — in modo da poter scegliere il metodo che meglio si adatta alle tue esigenze.
Panoramica dei metodi
- Metodo 1: Copia il codice da un IDE (evidenziazione della sintassi)
- Metodo 2: Applica uno stile di codice personalizzato in Word
- Metodo 3: Riquadra il codice usando tabelle a 1 cella
- Metodo 4: Aggiungi frammenti di codice a Word come immagini
- Metodo 5: Incorpora il codice come oggetto documento
- Metodo 6: Formatta i blocchi di codice usando i componenti aggiuntivi di Word
- Metodo 7: Automatizza l'inserimento del codice tramite Python
Metodo 1: Copia il codice da un IDE (evidenziazione della sintassi)
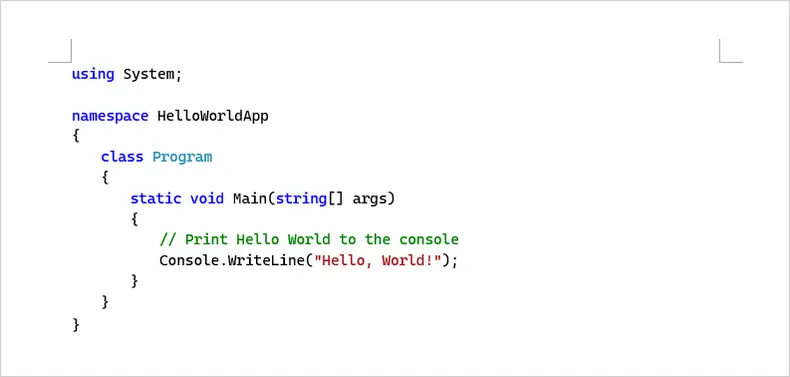
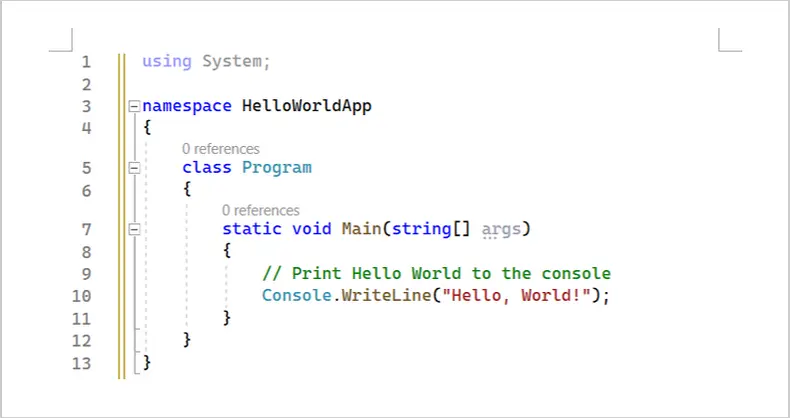
Questo metodo consiste nel copiare il codice direttamente da un IDE (come VS Code, Visual Studio o IntelliJ IDEA) e incollarlo in un documento di Word. La maggior parte degli IDE moderni conserva automaticamente l'evidenziazione della sintassi e la formattazione di base durante la copia del codice.
Quando usare questo metodo:
Questo approccio è adatto per brevi esempi di codice in tutorial, guide tecniche o report in cui il documento è in gran parte di sola lettura. Funziona meglio quando il codice non richiede aggiornamenti frequenti dopo essere stato aggiunto a Word.
Come copiare il codice da un IDE in Word:
- Apri il file di codice nel tuo IDE e seleziona le righe desiderate.
- Copia la selezione usando il comando di copia standard.
- Incolla il codice in Word e scegli Mantieni formattazione originale.
Potrebbe essere necessario regolare la dimensione del carattere o l'interlinea per adattarli meglio al contenuto circostante.
Vantaggi:
- Veloce e comodo
- Conserva l'evidenziazione della sintassi
- Nessuno strumento aggiuntivo richiesto
Svantaggi:
- La formattazione può variare tra le diverse versioni di Word
- Non ideale per blocchi di codice di grandi dimensioni o aggiornati di frequente
Ideale per: Brevi esempi di codice in tutorial o documenti una tantum
Metodo 2: Applica uno stile di codice personalizzato in Word
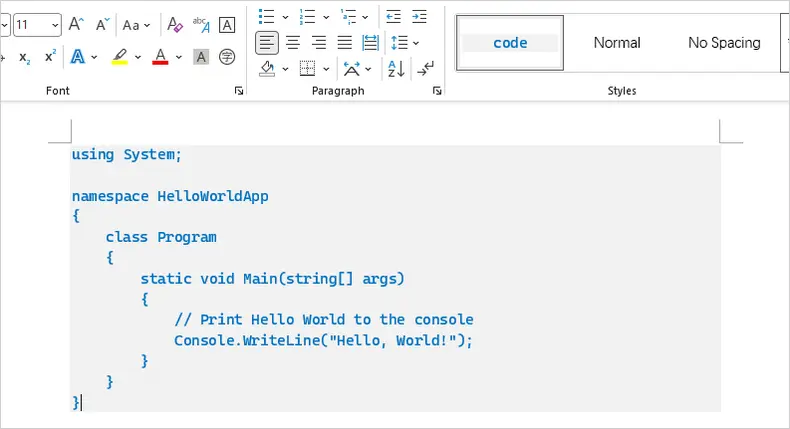
Questo metodo utilizza gli stili predefiniti di Word per creare uno stile "Codice" dedicato per formattare i frammenti di codice in modo coerente. È possibile controllare carattere, dimensione, colore, interlinea e ombreggiatura dello sfondo, garantendo che tutti i blocchi di codice abbiano un aspetto uniforme in tutto il documento.
Quando usare questo metodo:
Ideale per documenti che richiedono più esempi di codice con formattazione coerente, specialmente quando sono previste modifiche o aggiornamenti. Funziona bene per tutorial, guide o report che verranno mantenuti nel tempo.
Come applicare uno stile di codice personalizzato:
- Seleziona il tuo codice in Word.
- Apri il riquadro Stili e crea un nuovo stile chiamato "Codice".
- Imposta il carattere su un tipo monospazio (ad es. Consolas, Courier New), regola la dimensione del carattere e l'interlinea e, facoltativamente, aggiungi un colore di sfondo chiaro (che si trova in Formato > Bordi).
- Applica questo stile a tutti i blocchi di codice per una formattazione coerente.
Vantaggi:
- Aspetto coerente e professionale
- Completamente modificabile e ricercabile
- Facilmente riutilizzabile in tutto il documento
Svantaggi:
- Richiede una configurazione iniziale
- Meno d'impatto visivo rispetto all'evidenziazione della sintassi dell'IDE
- Richiede l'applicazione manuale dello stile per ogni nuovo blocco di codice
Ideale per: Documenti di media e lunga lunghezza con più esempi di codice modificabili
Metodo 3: Riquadra il codice usando tabelle a 1 cella
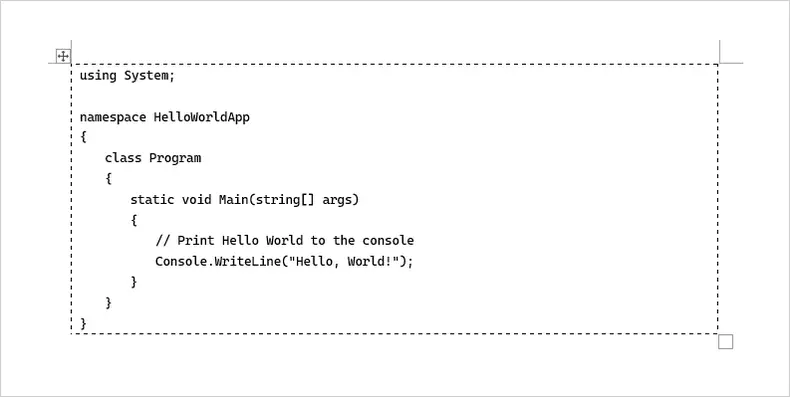
Questo approccio prevede di inserire ogni frammento di codice all'interno di una tabella a cella singola. La tabella funge da contenitore, aiutando il codice a risaltare e impedendo al testo di scorrere attorno ad esso.
Quando usare questo metodo:
Utile per comandi brevi o frammenti in cui è importante la separazione visiva dal testo circostante. È anche pratico per i documenti che possono essere stampati o esportati in PDF.
Come riquadrare il codice in una tabella:
- Inserisci una tabella 1×1 in Word.
- Incolla il tuo codice nella cella della tabella.
- Applica un carattere monospazio e, facoltativamente, imposta un'ombreggiatura di sfondo chiara.
- Regola la spaziatura interna della cella o rimuovi i bordi secondo necessità.
Vantaggi:
- Chiara separazione visiva
- Il layout rimane stabile tra le pagine e le esportazioni
- Funziona senza strumenti aggiuntivi
Svantaggi:
- La modifica di codice lungo all'interno di una tabella può essere macchinosa
- L'aggiunta di molti blocchi di codice può ingombrare il documento
- I bordi della tabella possono richiedere una messa a punto per l'estetica
Ideale per: Comandi brevi o frammenti che necessitano di un layout chiaro e isolato
Metodo 4: Aggiungi frammenti di codice a Word come immagini
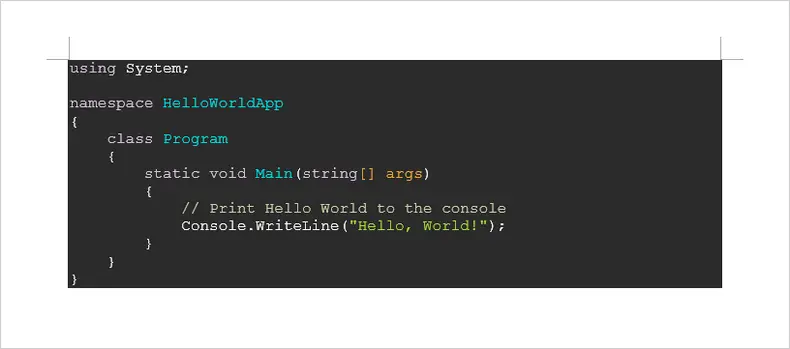
Questo metodo converte il codice in un'immagine, garantendo che la formattazione, i colori e l'allineamento appaiano esattamente come previsto in Word.
Quando usare questo metodo:
Perfetto per i documenti in cui la fedeltà visiva è fondamentale e il codice non deve essere modificato. Esempi includono materiali di marketing, report per clienti esterni o PDF destinati alla distribuzione.
Come inserire il codice come immagine:
- Usa uno strumento per screenshot o la funzione di esportazione dell'IDE per creare un'immagine del tuo codice.
- Inserisci l'immagine in Word usando Inserisci → Immagini.
- Ridimensiona secondo necessità e, facoltativamente, aggiungi un bordo.
Vantaggi:
- Formattazione e colori vengono preservati esattamente
- Aspetto professionale e curato
- Sicuro per PDF stampati o condivisi
Svantaggi:
- Il codice non è modificabile
- Non ricercabile o copiabile
- Problemi di accessibilità per gli screen reader
Ideale per: Documenti di presentazione finali in cui non è richiesta la modifica del codice
Metodo 5: Incorpora il codice come oggetto documento
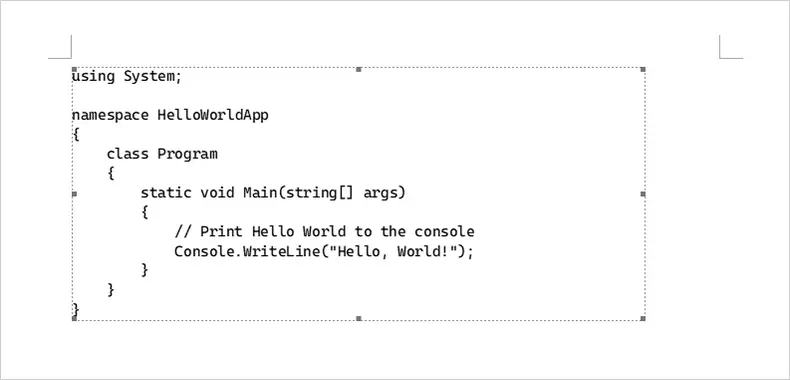
Questo metodo incorpora il codice all'interno del documento di Word come un oggetto separato anziché come testo in linea. Invece di incollare il codice direttamente nel corpo del documento, si inserisce un piccolo documento incorporato che contiene il codice. Ciò mantiene il codice visivamente isolato e impedisce a Word di interferire con la formattazione.
Quando usare questo metodo:
Questo metodo funziona bene quando si desidera separare visivamente il codice dal contenuto circostante o quando il codice deve rimanere invariato e di sola lettura. È particolarmente utile per report, specifiche o documenti in cui il codice è incluso come riferimento anziché per la modifica attiva.
Come incorporare il codice come oggetto in Word:
- Vai alla scheda Inserisci in Word.
- Fai clic sulla freccia a discesa Oggetto e seleziona Oggetto.
- Nella scheda Crea nuovo, scegli Testo OpenDocument come tipo di oggetto.
- Fai clic su OK. Si aprirà una nuova finestra del documento.
- Incolla o digita il tuo codice nel nuovo documento.
- Chiudi la finestra del documento incorporato.
Una volta chiusa, il codice appare nel tuo documento Word originale come un oggetto incorporato. Puoi spostarlo o ridimensionarlo secondo necessità.
Vantaggi:
- Mantiene il codice chiaramente separato dal testo principale del documento
- Impedisce a Word di alterare la formattazione
- L'oggetto può essere ridimensionato o riposizionato facilmente
- Adatto per blocchi di codice di sola lettura
Svantaggi:
- Il codice non può essere modificato direttamente in linea
- Non ideale per codice lungo o aggiornato di frequente
Ideale per: Incorporare frammenti di codice stabili e di sola lettura in report o documentazione in cui il controllo del layout è più importante della modificabilità
Metodo 6: Formatta i blocchi di codice usando i componenti aggiuntivi di Word
Questo approccio utilizza un componente aggiuntivo di Word dedicato per formattare ed evidenziare i frammenti di codice direttamente all'interno del documento. Un componente aggiuntivo popolare disponibile nello store dei componenti aggiuntivi di Office è Easy Syntax Highlighter (gratuito), che supporta molti linguaggi di programmazione e temi.
Quando usare questo metodo:
Usa questo metodo quando desideri che l'evidenziazione della sintassi e la formattazione del codice vengano applicate automaticamente senza incollare immagini o applicare stili manualmente. È particolarmente utile per insiemi più grandi di frammenti nella documentazione in cui è importante un'evidenziazione coerente.
Come usare il componente aggiuntivo Easy Syntax Highlighter:
- In Word, vai alla scheda Inserisci e scegli Ottieni componenti aggiuntivi (o Componenti aggiuntivi di Office).
- Cerca Easy Syntax Highlighter e installalo.
- Dopo l'installazione, seleziona il blocco di codice che desideri formattare.
- Usa la barra multifunzione o il riquadro del componente aggiuntivo per scegliere una lingua e applicare l'evidenziazione.
- Il codice selezionato verrà formattato con colori e stili di sintassi.
(Un componente aggiuntivo alternativo che puoi menzionare è Easy Code Formatter, che formatta anche il testo selezionato come codice utilizzando temi predefiniti.)
Vantaggi:
- Applica l'evidenziazione della sintassi direttamente in Word
- Supporta molte lingue e temi
- Rende l'inserimento ripetuto molto più semplice rispetto allo stile manuale
Svantaggi:
- Richiede l'installazione di un componente aggiuntivo
- Alcune funzionalità/temi potrebbero richiedere una configurazione
Ideale per: Documenti di medie e grandi dimensioni in cui la coerenza e la velocità di formattazione sono importanti
Metodo 7: Automatizza l'inserimento del codice tramite Python
Per documenti di grandi dimensioni o inserimenti di codice ripetuti, è possibile automatizzare il processo utilizzando Python. Questo metodo sfrutta Spire.Doc for Python per creare documenti Word e Pygments per applicare automaticamente l'evidenziazione della sintassi. Funziona per Python, C#, Java e molti altri linguaggi, rendendolo una soluzione universale per la documentazione tecnica.
Quando usare questo metodo:
Usa questo metodo quando hai molti frammenti di codice, hai bisogno di un'evidenziazione della sintassi coerente o vuoi generare documenti automaticamente (per report, tutorial o manuali). È ideale per situazioni in cui il copia-incolla manuale o i componenti aggiuntivi non sono pratici.
Come automatizzare l'inserimento del codice:
-
Installa le librerie richieste se non l'hai già fatto:
pip install spire.doc pygments -
Prepara il tuo codice come una stringa.
-
Usa Pygments per convertire il codice in RTF con evidenziazione della sintassi, specificando il lexer appropriato per il linguaggio, oppure usa guess_lexer per rilevarlo automaticamente.
-
Usa Spire.Doc per creare un documento Word, aggiungere un paragrafo e inserire la stringa RTF.
-
Salva il documento come DOCX.
Ecco un esempio usando il codice Python:
from pygments import highlight
from pygments.lexers import CSharpLexer, guess_lexer
from pygments.formatters import RtfFormatter
from spire.doc import *

# Definisci il codice da inserire (C#, Java, Python, ecc.)
code = """
using System;

namespace HelloWorldApp
{
    class Program
    {
        static void Main(string[] args)
        {
            // Stampa Hello World sulla console
            Console.WriteLine("Hello, World!");
        }
    }
}
"""

# Imposta il nome del carattere
formatter = RtfFormatter(fontface="Consolas")

# Opzione 1: Specifica esplicitamente il lexer (consigliato quando la lingua è nota)
rtf_text = highlight(code, CSharpLexer(), formatter)
rtf_text = rtf_text.replace(r"\f0", r"\f0\fs21")  # dimensione del carattere

# Opzione 2: Rileva automaticamente il linguaggio di programmazione
# Questo è utile quando si elaborano frammenti di codice misti o sconosciuti
# lexer = guess_lexer(code)
# rtf_text = highlight(code, lexer, formatter)

# Carica un documento Word
doc = Document()
doc.LoadFromFile("Input.docx")

# Aggiungi un paragrafo
section = doc.Sections.get_Item(0)
para = section.AddParagraph()

# Inserisci il codice con evidenziazione della sintassi come RTF
para.AppendRTF(rtf_text)

# Salva il documento
doc.SaveToFile("InsertCode.docx", FileFormat.Docx2016)
doc.Close()
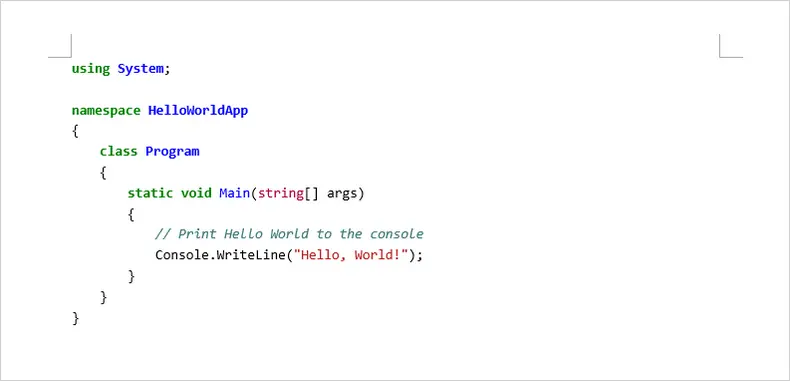
Dopo aver eseguito lo script, il documento Word risultante contiene codice completamente formattato e con evidenziazione della sintassi, modificabile e coerente, indipendentemente dal linguaggio di programmazione utilizzato.
Vantaggi:
- Completamente automatizzato e scalabile per più blocchi di codice
- Funziona per Python, C#, Java e molte altre lingue
- Evidenziazione della sintassi coerente e output Word modificabile
Svantaggi:
- Richiede ambiente Python e librerie
- Leggera configurazione e curva di apprendimento per i nuovi utenti
Ideale per: Generare documenti tecnici di grandi dimensioni, tutorial o report con più frammenti di codice in cui l'automazione e la coerenza sono priorità
Oltre all'inserimento di blocchi di codice con evidenziazione della sintassi tramite RTF, Spire.Doc for Python supporta anche l'aggiunta di frammenti di codice a documenti Word utilizzando HTML o immagini, il che può essere utile quando la formattazione è già preparata altrove. Inoltre, i file Markdown che contengono blocchi di codice possono essere convertiti in documenti Word, preservando la struttura e la leggibilità.
Una volta generato il documento, può essere esportato direttamente in PDF, rendendo questo approccio adatto per flussi di lavoro di documentazione end-to-end che partono dal codice e terminano con un formato di file distribuibile.
Confronto: Scegliere il metodo giusto
| Metodo | Facilità d'uso | Configurazione / Strumenti richiesti | Scalabilità | Ideale per |
|---|---|---|---|---|
| Copia da IDE | ★★★★★ | Nessuno | Bassa | Esempi di codice brevi e una tantum |
| Stile Word personalizzato | ★★★★☆ | Configurazione manuale dello stile | Media | Documenti con blocchi di codice ripetuti |
| Tabella a 1 cella | ★★★★☆ | Solo Word | Bassa | Codice in riquadro con controllo del layout |
| Codice come immagini | ★★★★☆ | Strumento per screenshot o esportazione da IDE | Bassa | Documenti di sola lettura o incentrati sul design |
| Oggetto documento | ★★★☆☆ | Supporto oggetti Word | Bassa | Blocchi di codice incorporati e isolati |
| Componenti aggiuntivi di Word | ★★★★☆ | Installazione componente aggiuntivo | Media | Formattazione rapida senza codice |
| Programmatico (Python) | ★★☆☆☆ | Python + Librerie | Alta | Documenti grandi o aggiornati di frequente |
Considerazioni finali
Non esiste un approccio unico per inserire codice in Word. Per frammenti rapidi e una tantum, la copia manuale o le tabelle possono essere sufficienti. Se il documento verrà modificato di frequente o contiene più frammenti, l'utilizzo di stili Word personalizzati o di un componente aggiuntivo per frammenti garantisce la coerenza. Per flussi di lavoro su larga scala o automatizzati, Python con Spire.Doc e Pygments offre la massima efficienza e controllo.
Comprendendo i punti di forza e i limiti di ciascun metodo, è possibile produrre documenti professionali, leggibili e manutenibili, riducendo al minimo la frustrazione spesso associata alla formattazione del codice in Word.
Domande frequenti
D1: Posso copiare codice da qualsiasi IDE in Word e mantenere la formattazione?
La maggior parte degli IDE moderni, tra cui VS Code, Visual Studio e IntelliJ IDEA, preserva la formattazione di base e l'evidenziazione della sintassi durante la copia. Possono verificarsi alcune differenze a seconda dei temi e dei caratteri di Word.
D2: Posso includere più linguaggi di programmazione in un singolo documento di Word?
Sì. I metodi 1–6 funzionano per qualsiasi lingua, a condizione di scegliere la formattazione corretta. Il metodo 7 (Python + Pygments) supporta molte lingue e guess_lexer può rilevare automaticamente la lingua.
D3: Il metodo Python automatizzato è difficile da configurare?
Richiede l'installazione di Python e delle librerie necessarie (Spire.Doc e pygments), ma il flusso di lavoro è semplice una volta configurato e fa risparmiare tempo per inserimenti di codice di grandi dimensioni o ripetuti.
D4: Qual è il metodo migliore per i documenti finali pronti per la presentazione?
Se la fedeltà visiva è fondamentale e non sono necessarie modifiche, l'inserimento del codice come immagine (Metodo 4) garantisce una formattazione perfetta.
Potrebbe interessarti anche
7 façons intelligentes d'insérer des blocs de code dans des documents Word
Table des matières
- Méthode 1 : Copier le code depuis un IDE (Coloration syntaxique)
- Méthode 2 : Appliquer un style de code personnalisé dans Word
- Méthode 3 : Encadrer le code à l'aide de tableaux à une seule cellule
- Méthode 4 : Ajouter des extraits de code à Word en tant qu'images
- Méthode 5 : Intégrer le code en tant qu'objet document
- Méthode 6 : Mettre en forme les blocs de code à l'aide des compléments Word
- Méthode 7 : Automatiser l'insertion de code via Python
- Comparaison : Choisir la bonne méthode
- Réflexions finales
- FAQ
L'inclusion d'extraits de code dans les documents Word est un besoin courant pour les développeurs, les rédacteurs techniques et les éducateurs. Cependant, obtenir des blocs de code lisibles, visuellement attrayants et maintenables dans Word peut être délicat.
Certains utilisateurs se contentent de copier-coller depuis un IDE, ce qui peut perturber la mise en forme, tandis que d'autres stylisent manuellement le texte ou utilisent des captures d'écran, ce qui peut prendre beaucoup de temps. Pour les documents qui nécessitent cohérence, édition ou automatisation, choisir la bonne méthode peut faire gagner des heures de travail.
Dans ce guide, nous couvrons sept façons intelligentes d'insérer des blocs de code dans Word — des approches manuelles rapides aux flux de travail entièrement automatisés utilisant Python et Spire.Doc — afin que vous puissiez choisir la méthode qui correspond le mieux à vos besoins.
Aperçu des méthodes
- Méthode 1 : Copier le code depuis un IDE (Coloration syntaxique)
- Méthode 2 : Appliquer un style de code personnalisé dans Word
- Méthode 3 : Encadrer le code à l'aide de tableaux à une seule cellule
- Méthode 4 : Ajouter des extraits de code à Word en tant qu'images
- Méthode 5 : Intégrer le code en tant qu'objet document
- Méthode 6 : Mettre en forme les blocs de code à l'aide des compléments Word
- Méthode 7 : Automatiser l'insertion de code via Python
Méthode 1 : Copier le code depuis un IDE (Coloration syntaxique)
Cette méthode consiste à copier le code directement depuis un IDE (tel que VS Code, Visual Studio ou IntelliJ IDEA) et à le coller dans un document Word. La plupart des IDE modernes préservent automatiquement la coloration syntaxique et la mise en forme de base lors de la copie du code.
Quand utiliser cette méthode :
Cette approche est bien adaptée aux exemples de code courts dans les tutoriels, les guides techniques ou les rapports où le document est principalement en lecture seule. Elle fonctionne mieux lorsque le code ne nécessite pas de mises à jour fréquentes après avoir été ajouté à Word.
Comment copier du code d'un IDE dans Word :
- Ouvrez le fichier de code dans votre IDE et sélectionnez les lignes souhaitées.
- Copiez la sélection à l'aide de la commande de copie standard.
- Collez le code dans Word et choisissez Conserver la mise en forme source.
Vous pouvez ajuster la taille de la police ou l'interligne pour mieux correspondre au contenu environnant.
Avantages :
- Rapide et pratique
- Préserve la coloration syntaxique
- Aucun outil supplémentaire requis
Inconvénients :
- La mise en forme peut varier selon les versions de Word
- Pas idéal pour les blocs de code volumineux ou fréquemment mis à jour
Idéal pour : Exemples de code courts dans des tutoriels ou des documents uniques
Méthode 2 : Appliquer un style de code personnalisé dans Word
Cette méthode utilise les styles intégrés de Word pour créer un style « Code » dédié pour formater les extraits de code de manière cohérente. Vous pouvez contrôler la police, la taille, la couleur, l'interligne et l'ombrage de l'arrière-plan, garantissant que tous les blocs de code ont un aspect uniforme dans tout votre document.
Quand utiliser cette méthode :
Idéal pour les documents qui nécessitent plusieurs exemples de code avec une mise en forme cohérente, en particulier lorsque des modifications ou des mises à jour sont attendues. Cela fonctionne bien pour les tutoriels, les guides ou les rapports qui seront maintenus au fil du temps.
Comment appliquer un style de code personnalisé :
- Sélectionnez votre code dans Word.
- Ouvrez le volet Styles et créez un nouveau style nommé « Code ».
- Définissez la police sur un type à espacement fixe (par exemple, Consolas, Courier New), ajustez la taille de la police et l'interligne, et ajoutez éventuellement une couleur d'arrière-plan claire (disponible sous Format > Bordures).
- Appliquez ce style à tous les blocs de code pour une mise en forme cohérente.
Avantages :
- Apparence cohérente et professionnelle
- Entièrement modifiable et consultable
- Facilement réutilisable dans tout le document
Inconvénients :
- Nécessite une configuration initiale
- Moins frappant visuellement que la coloration syntaxique de l'IDE
- Nécessite une application manuelle du style pour chaque nouveau bloc de code
Idéal pour : Documents de taille moyenne à longue avec plusieurs exemples de code modifiables
Méthode 3 : Encadrer le code à l'aide de tableaux à une seule cellule
Cette approche consiste à placer chaque extrait de code dans un tableau à une seule cellule. Le tableau agit comme un conteneur, aidant le code à se démarquer et empêchant le texte de s'écouler autour de lui.
Quand utiliser cette méthode :
Utile pour les commandes courtes ou les extraits où la séparation visuelle du texte environnant est importante. C'est également pratique pour les documents qui peuvent être imprimés ou exportés au format PDF.
Comment encadrer du code dans un tableau :
- Insérez un tableau 1×1 dans Word.
- Collez votre code dans la cellule du tableau.
- Appliquez une police à espacement fixe et définissez éventuellement un ombrage d'arrière-plan clair.
- Ajustez le remplissage des cellules ou supprimez les bordures si nécessaire.
Avantages :
- Séparation visuelle claire
- La mise en page reste stable sur les pages et les exportations
- Fonctionne sans outils supplémentaires
Inconvénients :
- L'édition de code long à l'intérieur d'un tableau peut être fastidieuse
- L'ajout de nombreux blocs de code peut encombrer le document
- Les bordures de tableau peuvent nécessiter un réglage fin pour l'esthétique
Idéal pour : Commandes courtes ou extraits nécessitant une mise en page claire et isolée
Méthode 4 : Ajouter des extraits de code à Word en tant qu'images
Cette méthode convertit le code en une image, garantissant que la mise en forme, les couleurs et l'alignement apparaissent exactement comme prévu dans Word.
Quand utiliser cette méthode :
Parfait pour les documents où la fidélité visuelle est essentielle et où le code n'a pas besoin d'être modifié. Les exemples incluent les supports marketing, les rapports pour les clients externes ou les PDF destinés à la distribution.
Comment insérer du code en tant qu'image :
- Utilisez un outil de capture d'écran ou une fonction d'exportation de l'IDE pour créer une image de votre code.
- Insérez l'image dans Word en utilisant Insertion → Images.
- Redimensionnez si nécessaire et ajoutez éventuellement une bordure.
Avantages :
- La mise en forme et les couleurs sont préservées exactement
- Aspect professionnel et soigné
- Sûr pour les PDF imprimés ou partagés
Inconvénients :
- Le code n'est pas modifiable
- Non consultable ou copiable
- Problèmes d'accessibilité pour les lecteurs d'écran
Idéal pour : Documents de présentation finaux où la modification du code n'est pas requise
Méthode 5 : Intégrer le code en tant qu'objet document
Cette méthode intègre le code à l'intérieur du document Word en tant qu'objet distinct plutôt qu'en tant que texte en ligne. Au lieu de coller le code directement dans le corps du document, vous insérez un petit document incorporé qui contient le code. Cela maintient le code visuellement isolé et empêche Word d'interférer avec la mise en forme.
Quand utiliser cette méthode :
Cette méthode fonctionne bien lorsque vous souhaitez séparer visuellement le code du contenu environnant ou lorsque le code doit rester inchangé et en lecture seule. Elle est particulièrement utile pour les rapports, les spécifications ou les documents où le code est inclus à titre de référence plutôt que pour une édition active.
Comment intégrer du code en tant qu'objet dans Word :
- Allez dans l'onglet Insertion de Word.
- Cliquez sur la flèche déroulante Objet et sélectionnez Objet.
- Dans l'onglet Créer, choisissez Texte OpenDocument comme type d'objet.
- Cliquez sur OK. Une nouvelle fenêtre de document s'ouvrira.
- Collez ou tapez votre code dans le nouveau document.
- Fermez la fenêtre du document incorporé.
Une fois fermée, le code apparaît dans votre document Word d'origine en tant qu'objet incorporé. Vous pouvez le déplacer ou le redimensionner selon vos besoins.
Avantages :
- Maintient le code clairement séparé du texte principal du document
- Empêche Word de modifier la mise en forme
- L'objet peut être redimensionné ou repositionné facilement
- Convient aux blocs de code en lecture seule
Inconvénients :
- Le code ne peut pas être modifié directement en ligne
- Pas idéal pour le code long ou fréquemment mis à jour
Idéal pour : Intégrer des extraits de code stables et en lecture seule dans des rapports ou de la documentation où le contrôle de la mise en page est plus important que la possibilité de modification
Méthode 6 : Mettre en forme les blocs de code à l'aide des compléments Word
Cette approche utilise un complément Word dédié pour formater et surligner les extraits de code directement dans votre document. Un complément populaire disponible dans la boutique de compléments Office est Easy Syntax Highlighter (gratuit), qui prend en charge de nombreux langages de programmation et thèmes.
Quand utiliser cette méthode :
Utilisez cette méthode lorsque vous souhaitez que la coloration syntaxique et la mise en forme du code soient appliquées automatiquement sans coller d'images ou styliser manuellement. C'est particulièrement utile pour les ensembles plus importants d'extraits dans la documentation où une coloration cohérente est importante.
Comment utiliser le complément Easy Syntax Highlighter :
- Dans Word, allez dans l'onglet Insertion et choisissez Obtenir des compléments (ou Compléments Office).
- Recherchez Easy Syntax Highlighter et installez-le.
- Après l'installation, sélectionnez le bloc de code que vous souhaitez formater.
- Utilisez le ruban ou le volet du complément pour choisir une langue et appliquer la coloration.
- Le code sélectionné sera formaté avec des couleurs et des styles de syntaxe.
(Un autre complément que vous pouvez mentionner est Easy Code Formatter, qui formate également le texte sélectionné en tant que code à l'aide de thèmes intégrés.)
Avantages :
- Applique la coloration syntaxique directement dans Word
- Prend en charge de nombreux langages et thèmes
- Rend l'insertion répétée beaucoup plus facile que le style manuel
Inconvénients :
- Nécessite l'installation d'un complément
- Certaines fonctionnalités/thèmes peuvent nécessiter une configuration
Idéal pour : Documents de taille moyenne à grande où la cohérence et la vitesse de formatage sont importantes
Méthode 7 : Automatiser l'insertion de code via Python
Pour les documents volumineux ou les insertions de code répétées, vous pouvez automatiser le processus à l'aide de Python. Cette méthode s'appuie sur Spire.Doc for Python pour créer des documents Word et sur Pygments pour appliquer automatiquement la coloration syntaxique. Elle fonctionne pour Python, C#, Java et de nombreux autres langages, ce qui en fait une solution universelle pour la documentation technique.
Quand utiliser cette méthode :
Utilisez cette méthode lorsque vous avez de nombreux extraits de code, avez besoin d'une coloration syntaxique cohérente ou souhaitez générer des documents automatiquement (pour des rapports, des tutoriels ou des manuels). C'est idéal pour les situations où le copier-coller manuel ou les compléments ne sont pas pratiques.
Comment automatiser l'insertion de code :
-
Installez les bibliothèques requises si vous ne l'avez pas déjà fait :
pip install spire.doc pygments -
Préparez votre code sous forme de chaîne.
-
Utilisez Pygments pour convertir le code en RTF avec coloration syntaxique, en spécifiant le lexer approprié pour le langage, ou utilisez guess_lexer pour le détecter automatiquement.
-
Utilisez Spire.Doc pour créer un document Word, ajouter un paragraphe et insérer la chaîne RTF.
-
Enregistrez le document au format DOCX.
Voici un exemple utilisant du code Python :
from pygments import highlight
from pygments.lexers import CSharpLexer, guess_lexer
from pygments.formatters import RtfFormatter
from spire.doc import *

# Define the code to insert (C#, Java, Python, etc.)
code = """
using System;

namespace HelloWorldApp
{
    class Program
    {
        static void Main(string[] args)
        {
            // Print Hello World to the console
            Console.WriteLine("Hello, World!");
        }
    }
}
"""

# Set font name
formatter = RtfFormatter(fontface="Consolas")

# Option 1: Specify the lexer explicitly (recommended when language is known)
rtf_text = highlight(code, CSharpLexer(), formatter)
rtf_text = rtf_text.replace(r"\f0", r"\f0\fs21")  # font size

# Option 2: Automatically detect the programming language
# This is useful when processing mixed or unknown code snippets
# lexer = guess_lexer(code)
# rtf_text = highlight(code, lexer, formatter)

# Load a Word document
doc = Document()
doc.LoadFromFile("Input.docx")

# Add a paragraph
section = doc.Sections.get_Item(0)
para = section.AddParagraph()

# Insert the syntax-highlighted code as RTF
para.AppendRTF(rtf_text)

# Save the document
doc.SaveToFile("InsertCode.docx", FileFormat.Docx2016)
doc.Close()
Après l'exécution du script, le document Word résultant contient du code entièrement formaté et avec coloration syntaxique, modifiable et cohérent, quel que soit le langage de programmation utilisé.
Avantages :
- Entièrement automatisé et évolutif pour plusieurs blocs de code
- Fonctionne pour Python, C#, Java et de nombreux autres langages
- Coloration syntaxique cohérente et sortie Word modifiable
Inconvénients :
- Nécessite un environnement Python et des bibliothèques
- Légère configuration et courbe d'apprentissage pour les nouveaux utilisateurs
Idéal pour : Générer de volumineux documents techniques, tutoriels ou rapports avec plusieurs extraits de code où l'automatisation et la cohérence sont des priorités
Au-delà de l'insertion de blocs de code avec coloration syntaxique via RTF, Spire.Doc for Python prend également en charge l'ajout d'extraits de code à des documents Word en utilisant du HTML ou des images, ce qui peut être utile lorsque la mise en forme est déjà préparée ailleurs. De plus, les fichiers Markdown contenant des blocs de code peuvent être convertis en documents Word, en préservant la structure et la lisibilité.
Une fois le document généré, il peut être exporté directement au format PDF, ce qui rend cette approche adaptée aux flux de travail de documentation de bout en bout qui partent du code et se terminent par un format de fichier distribuable.
Comparaison : Choisir la bonne méthode
| Méthode | Facilité d'utilisation | Configuration / Outils requis | Évolutivité | Idéal pour |
|---|---|---|---|---|
| Copier depuis l'IDE | ★★★★★ | Aucun | Faible | Exemples de code courts et uniques |
| Style Word personnalisé | ★★★★☆ | Configuration manuelle du style | Moyenne | Documents avec des blocs de code répétés |
| Tableau à 1 cellule | ★★★★☆ | Word uniquement | Faible | Code encadré avec contrôle de la mise en page |
| Code en tant qu'images | ★★★★☆ | Outil de capture d'écran ou exportation IDE | Faible | Documents en lecture seule ou axés sur le design |
| Objet Document | ★★★☆☆ | Prise en charge des objets Word | Faible | Blocs de code intégrés et isolés |
| Compléments Word | ★★★★☆ | Installation du complément | Moyenne | Mise en forme rapide sans codage |
| Programmatique (Python) | ★★☆☆☆ | Python + Bibliothèques | Élevée | Documents volumineux ou fréquemment mis à jour |
Réflexions finales
Il n'y a pas d'approche unique pour insérer du code dans Word. Pour des extraits rapides et uniques, une copie manuelle ou des tableaux peuvent suffire. Si votre document sera modifié fréquemment ou contient plusieurs extraits, l'utilisation de styles Word personnalisés ou d'un complément d'extrait garantit la cohérence. Pour les flux de travail à grande échelle ou automatisés, Python avec Spire.Doc et Pygments offre une efficacité et un contrôle maximum.
En comprenant les forces et les limites de chaque méthode, vous pouvez produire des documents professionnels, lisibles et maintenables, tout en minimisant la frustration souvent associée à la mise en forme du code dans Word.
FAQ
Q1 : Puis-je copier du code de n'importe quel IDE dans Word et conserver la mise en forme ?
La plupart des IDE modernes, y compris VS Code, Visual Studio et IntelliJ IDEA, préservent la mise en forme de base et la coloration syntaxique lors de la copie. Certaines différences peuvent survenir en fonction des thèmes et des polices de Word.
Q2 : Puis-je inclure plusieurs langages de programmation dans un seul document Word ?
Oui. Les méthodes 1 à 6 fonctionnent pour n'importe quel langage tant que vous choisissez la bonne mise en forme. La méthode 7 (Python + Pygments) prend en charge de nombreux langages, et guess_lexer peut détecter automatiquement le langage.
Q3 : La méthode automatisée avec Python est-elle difficile à mettre en place ?
Cela nécessite d'installer Python et les bibliothèques requises (Spire.Doc et pygments), mais le flux de travail est simple une fois configuré et permet de gagner du temps pour les insertions de code volumineuses ou répétées.
Q4 : Quelle est la meilleure méthode pour les documents finaux, prêts pour la présentation ?
Si la fidélité visuelle est essentielle et que l'édition n'est pas nécessaire, l'insertion du code en tant qu'image (Méthode 4) garantit une mise en forme parfaite.
Vous pourriez également être intéressé par
7 formas inteligentes de insertar bloques de código en documentos de Word
Tabla de Contenidos
- Método 1: Copiar Código desde un IDE (Resaltado de Sintaxis)
- Método 2: Aplicar un Estilo de Código Personalizado en Word
- Método 3: Enmarcar Código Usando Tablas de 1 Celda
- Método 4: Añadir Fragmentos de Código a Word como Imágenes
- Método 5: Incrustar Código como un Objeto de Documento
- Método 6: Formatear Bloques de Código Usando Complementos de Word
- Método 7: Automatizar la Inserción de Código a través de Python
- Comparación: Eligiendo el Método Correcto
- Conclusiones Finales
- Preguntas Frecuentes
Incluir fragmentos de código en documentos de Word es una necesidad común para desarrolladores, redactores técnicos y educadores. Sin embargo, lograr bloques de código legibles, visualmente atractivos y mantenibles en Word puede ser complicado.
Algunos usuarios simplemente copian y pegan desde un IDE, lo que puede alterar el formato, mientras que otros aplican estilo manualmente al texto o usan capturas de pantalla, lo que puede llevar mucho tiempo. Para documentos que requieren consistencia, edición o automatización, elegir el método correcto puede ahorrar horas de trabajo.
En esta guía, cubrimos siete formas inteligentes de insertar bloques de código en Word, desde enfoques manuales rápidos hasta flujos de trabajo totalmente automatizados usando Python y Spire.Doc, para que puedas seleccionar el método que mejor se adapte a tus necesidades.
Resumen de Métodos
- Método 1: Copiar Código desde un IDE (Resaltado de Sintaxis)
- Método 2: Aplicar un Estilo de Código Personalizado en Word
- Método 3: Enmarcar Código Usando Tablas de 1 Celda
- Método 4: Añadir Fragmentos de Código a Word como Imágenes
- Método 5: Incrustar Código como un Objeto de Documento
- Método 6: Formatear Bloques de Código Usando Complementos de Word
- Método 7: Automatizar la Inserción de Código a través de Python
Método 1: Copiar Código desde un IDE (Resaltado de Sintaxis)
Este método implica copiar código directamente desde un IDE (como VS Code, Visual Studio o IntelliJ IDEA) y pegarlo en un documento de Word. La mayoría de los IDEs modernos conservan el resaltado de sintaxis y el formato básico automáticamente al copiar código.
Cuándo Usar Este Método:
Este enfoque es adecuado para ejemplos de código cortos en tutoriales, guías técnicas o informes donde el documento es en gran parte de solo lectura. Funciona mejor cuando el código no requiere actualizaciones frecuentes después de ser añadido a Word.
Cómo Copiar Código de un IDE a Word:
- Abre el archivo de código en tu IDE y selecciona las líneas deseadas.
- Copia la selección usando el comando de copia estándar.
- Pega el código en Word y elige Mantener Formato de Origen.
Puedes ajustar el tamaño de la fuente o el interlineado para que coincida mejor con el contenido circundante.
Ventajas:
- Rápido y conveniente
- Conserva el resaltado de sintaxis
- No se requieren herramientas adicionales
Desventajas:
- El formato puede variar entre versiones de Word
- No es ideal para bloques de código grandes o que se actualizan con frecuencia
Ideal para: Ejemplos de código cortos en tutoriales o documentos únicos
Método 2: Aplicar un Estilo de Código Personalizado en Word
Este método utiliza los estilos integrados de Word para crear un estilo "Código" dedicado para formatear fragmentos de código de manera consistente. Puedes controlar la fuente, el tamaño, el color, el interlineado y el sombreado de fondo, asegurando que todos los bloques de código se vean uniformes en todo el documento.
Cuándo Usar Este Método:
Ideal para documentos que requieren múltiples ejemplos de código con formato consistente, especialmente cuando se esperan ediciones o actualizaciones. Funciona bien para tutoriales, guías o informes que se mantendrán a lo largo del tiempo.
Cómo Aplicar un Estilo de Código Personalizado:
- Selecciona tu código en Word.
- Abre el panel de Estilos y crea un nuevo estilo llamado "Código".
- Establece la fuente a un tipo monoespaciado (p. ej., Consolas, Courier New), ajusta el tamaño de la fuente y el interlineado, y opcionalmente añade un color de fondo claro (que se encuentra en Formato > Bordes).
- Aplica este estilo a todos los bloques de código para un formato consistente.
Ventajas:
- Apariencia consistente y profesional
- Totalmente editable y buscable
- Fácilmente reutilizable en todo el documento
Desventajas:
- Requiere configuración inicial
- Menos llamativo visualmente que el resaltado de sintaxis de un IDE
- Necesita aplicación manual del estilo para cada nuevo bloque de código
Ideal para: Documentos de medianos a largos con múltiples ejemplos de código editables
Método 3: Enmarcar Código Usando Tablas de 1 Celda
Este enfoque implica colocar cada fragmento de código dentro de una tabla de una sola celda. La tabla actúa como un contenedor, ayudando a que el código se destaque y evitando que el texto fluya a su alrededor.
Cuándo Usar Este Método:
Útil para comandos cortos o fragmentos donde la separación visual del texto circundante es importante. También es práctico para documentos que se pueden imprimir o exportar a PDF.
Cómo Enmarcar Código en una Tabla:
- Inserta una tabla de 1×1 en Word.
- Pega tu código en la celda de la tabla.
- Aplica una fuente monoespaciada y, opcionalmente, establece un sombreado de fondo claro.
- Ajusta el relleno de la celda o elimina los bordes según sea necesario.
Ventajas:
- Separación visual clara
- El diseño se mantiene estable en todas las páginas y exportaciones
- Funciona sin herramientas adicionales
Desventajas:
- Editar código largo dentro de una tabla puede ser engorroso
- Añadir muchos bloques de código puede desordenar el documento
- Los bordes de la tabla pueden requerir ajustes finos por estética
Ideal para: Comandos cortos o fragmentos que necesitan un diseño claro y aislado
Método 4: Añadir Fragmentos de Código a Word como Imágenes
Este método convierte el código en una imagen, asegurando que el formato, los colores y la alineación aparezcan exactamente como se desea en Word.
Cuándo Usar Este Método:
Perfecto para documentos donde la fidelidad visual es crítica y el código no necesita ser editado. Ejemplos incluyen materiales de marketing, informes para clientes externos o PDFs destinados a la distribución.
Cómo Insertar Código como una Imagen:
- Usa una herramienta de captura de pantalla o la función de exportación del IDE para crear una imagen de tu código.
- Inserta la imagen en Word usando Insertar → Imágenes.
- Cambia el tamaño según sea necesario y opcionalmente añade un borde.
Ventajas:
- El formato y los colores se conservan exactamente
- Se ve profesional y pulido
- Seguro para PDFs impresos o compartidos
Desventajas:
- El código no es editable
- No se puede buscar ni copiar
- Problemas de accesibilidad para lectores de pantalla
Ideal para: Documentos de presentación final donde no se requiere editar el código
Método 5: Incrustar Código como un Objeto de Documento
Este método incrusta el código dentro del documento de Word como un objeto separado en lugar de texto en línea. En lugar de pegar el código directamente en el cuerpo del documento, insertas un pequeño documento incrustado que contiene el código. Esto mantiene el código visualmente aislado y evita que Word interfiera con el formato.
Cuándo Usar Este Método:
Este método funciona bien cuando deseas separar visualmente el código del contenido circundante o cuando el código debe permanecer sin cambios y de solo lectura. Es particularmente útil para informes, especificaciones o documentos donde el código se incluye como referencia en lugar de para edición activa.
Cómo Incrustar Código como un Objeto en Word:
- Ve a la pestaña Insertar en Word.
- Haz clic en la flecha desplegable de Objeto y selecciona Objeto.
- En la pestaña Crear Nuevo, elige Texto de OpenDocument como el tipo de objeto.
- Haz clic en Aceptar. Se abrirá una nueva ventana de documento.
- Pega o escribe tu código en el nuevo documento.
- Cierra la ventana del documento incrustado.
Una vez cerrado, el código aparece en tu documento de Word original como un objeto incrustado. Puedes moverlo o cambiar su tamaño según sea necesario.
Ventajas:
- Mantiene el código claramente separado del texto principal del documento
- Evita que Word altere el formato
- El objeto se puede redimensionar o reposicionar fácilmente
- Adecuado para bloques de código de solo lectura
Desventajas:
- El código no se puede editar directamente en línea
- No es ideal para código largo o que se actualiza con frecuencia
Ideal para: Incrustar fragmentos de código estables y de solo lectura en informes o documentación donde el control del diseño importa más que la capacidad de edición
Método 6: Formatear Bloques de Código Usando Complementos de Word
Este enfoque utiliza un complemento de Word dedicado para formatear y resaltar fragmentos de código directamente dentro de tu documento. Un complemento popular disponible en la tienda de Complementos de Office es Easy Syntax Highlighter (gratuito), que admite muchos lenguajes de programación y temas.
Cuándo Usar Este Método:
Usa este método cuando quieras que el resaltado de sintaxis y el formato de código se apliquen automáticamente sin pegar imágenes o aplicar estilo manualmente. Es especialmente útil para conjuntos más grandes de fragmentos en documentación donde el resaltado consistente es importante.
Cómo Usar el Complemento Easy Syntax Highlighter:
- En Word, ve a la pestaña Insertar y elige Obtener complementos (o Complementos de Office).
- Busca Easy Syntax Highlighter e instálalo.
- Después de instalar, selecciona el bloque de código que deseas formatear.
- Usa la cinta de opciones o el panel del complemento para elegir un idioma y aplicar el resaltado.
- El código seleccionado se formateará con colores y estilos de sintaxis.
(Un complemento alternativo que puedes mencionar es Easy Code Formatter, que también formatea el texto seleccionado como código usando temas integrados.)
Ventajas:
- Aplica resaltado de sintaxis directamente en Word
- Admite muchos idiomas y temas
- Facilita mucho la inserción repetida en comparación con el estilo manual
Desventajas:
- Requiere instalar un complemento
- Algunas características/temas pueden requerir configuración
Ideal para: Documentos medianos a grandes donde la consistencia y la velocidad de formato son importantes
Método 7: Automatizar la Inserción de Código a través de Python
Para documentos grandes o inserciones de código repetidas, puedes automatizar el proceso usando Python. Este método aprovecha Spire.Doc for Python para crear documentos de Word y Pygments para aplicar el resaltado de sintaxis automáticamente. Funciona para Python, C#, Java y muchos otros lenguajes, lo que lo convierte en una solución universal para la documentación técnica.
Cuándo Usar Este Método:
Usa este método cuando tienes muchos fragmentos de código, necesitas resaltado de sintaxis consistente o quieres generar documentos automáticamente (para informes, tutoriales o manuales). Es ideal para situaciones donde el copiado y pegado manual o los complementos no son prácticos.
Cómo Automatizar la Inserción de Código:
-
Instala las bibliotecas necesarias si aún no lo has hecho:
pip install spire.doc pygments -
Prepara tu código como una cadena de texto.
-
Usa Pygments para convertir el código en RTF con resaltado de sintaxis, especificando el lexer apropiado para el lenguaje, o usa guess_lexer para detectarlo automáticamente.
-
Usa Spire.Doc para crear un documento de Word, añadir un párrafo e insertar la cadena RTF.
-
Guarda el documento como DOCX.
Aquí hay un ejemplo usando código Python:
from pygments import highlight
from pygments.lexers import CSharpLexer, guess_lexer
from pygments.formatters import RtfFormatter
from spire.doc import *

# Define el código a insertar (C#, Java, Python, etc.)
code = """
using System;

namespace HelloWorldApp
{
    class Program
    {
        static void Main(string[] args)
        {
            // Imprimir Hello World en la consola
            Console.WriteLine("Hello, World!");
        }
    }
}
"""

# Establecer nombre de fuente
formatter = RtfFormatter(fontface="Consolas")

# Opción 1: Especificar el lexer explícitamente (recomendado cuando se conoce el lenguaje)
rtf_text = highlight(code, CSharpLexer(), formatter)
rtf_text = rtf_text.replace(r"\f0", r"\f0\fs21")  # tamaño de fuente

# Opción 2: Detectar automáticamente el lenguaje de programación
# Esto es útil al procesar fragmentos de código mixtos o desconocidos
# lexer = guess_lexer(code)
# rtf_text = highlight(code, lexer, formatter)

# Cargar un documento de Word
doc = Document()
doc.LoadFromFile("Input.docx")

# Añadir un párrafo
section = doc.Sections.get_Item(0)
para = section.AddParagraph()

# Insertar el código con resaltado de sintaxis como RTF
para.AppendRTF(rtf_text)

# Guardar el documento
doc.SaveToFile("InsertCode.docx", FileFormat.Docx2016)
doc.Close()
Después de ejecutar el script, el documento de Word resultante contiene código completamente formateado y con resaltado de sintaxis, editable y consistente, independientemente del lenguaje de programación utilizado.
Ventajas:
- Totalmente automatizado y escalable para múltiples bloques de código
- Funciona para Python, C#, Java y muchos otros lenguajes
- Resaltado de sintaxis consistente y salida de Word editable
Desventajas:
- Requiere entorno Python y bibliotecas
- Ligera configuración y curva de aprendizaje para usuarios nuevos
Ideal para: Generar documentos técnicos grandes, tutoriales o informes con múltiples fragmentos de código donde la automatización y la consistencia son prioridades
Además de insertar bloques de código con resaltado de sintaxis a través de RTF, Spire.Doc for Python también admite la adición de fragmentos de código a documentos de Word usando HTML o imágenes, lo que puede ser útil cuando el formato ya está preparado en otro lugar. Además, los archivos Markdown que contienen bloques de código se pueden convertir en documentos de Word, conservando la estructura y la legibilidad.
Una vez que se genera el documento, se puede exportar directamente a PDF, lo que hace que este enfoque sea adecuado para flujos de trabajo de documentación de extremo a extremo que comienzan con código y terminan con un formato de archivo distribuible.
Comparación: Eligiendo el Método Correcto
| Método | Facilidad de Uso | Configuración / Herramientas Requeridas | Escalabilidad | Ideal Para |
|---|---|---|---|---|
| Copiar desde IDE | ★★★★★ | Ninguna | Baja | Ejemplos de código cortos y únicos |
| Estilo Personalizado de Word | ★★★★☆ | Configuración manual de estilo | Media | Documentos con bloques de código repetidos |
| Tabla de 1 Celda | ★★★★☆ | Solo Word | Baja | Código enmarcado con control de diseño |
| Código como Imágenes | ★★★★☆ | Herramienta de captura de pantalla o exportación de IDE | Baja | Documentos de solo lectura o centrados en el diseño |
| Objeto de Documento | ★★★☆☆ | Soporte de objetos de Word | Baja | Bloques de código incrustados y aislados |
| Complementos de Word | ★★★★☆ | Instalación de complemento | Media | Formato rápido sin codificación |
| Programático (Python) | ★★☆☆☆ | Python + Bibliotecas | Alta | Documentos grandes o actualizados con frecuencia |
Conclusiones Finales
No existe un enfoque único para insertar código en Word. Para fragmentos rápidos y únicos, la copia manual o las tablas pueden ser suficientes. Si tu documento se editará con frecuencia o contiene múltiples fragmentos, usar estilos personalizados de Word o un complemento de fragmentos garantiza la consistencia. Para flujos de trabajo a gran escala o automatizados, Python con Spire.Doc y Pygments ofrece la máxima eficiencia y control.
Al comprender las fortalezas y limitaciones de cada método, puedes producir documentos que sean profesionales, legibles y mantenibles, mientras minimizas la frustración a menudo asociada con el formato de código en Word.
Preguntas Frecuentes
P1: ¿Puedo copiar código de cualquier IDE a Word y mantener el formato?
La mayoría de los IDEs modernos, incluidos VS Code, Visual Studio e IntelliJ IDEA, conservan el formato básico y el resaltado de sintaxis al copiar. Pueden ocurrir algunas diferencias dependiendo de los temas y fuentes de Word.
P2: ¿Puedo incluir múltiples lenguajes de programación en un solo documento de Word?
Sí. Los métodos 1 a 6 funcionan para cualquier lenguaje siempre que elijas el formato correcto. El método 7 (Python + Pygments) admite muchos lenguajes, y guess_lexer puede detectar el lenguaje automáticamente.
P3: ¿Es difícil de configurar el método automatizado de Python?
Requiere instalar Python y las bibliotecas necesarias (Spire.Doc y pygments), pero el flujo de trabajo es simple una vez configurado y ahorra tiempo para inserciones de código grandes o repetidas.
P4: ¿Qué método es mejor para documentos finales listos para presentación?
Si la fidelidad visual es crítica y no se necesita edición, insertar el código como una imagen (Método 4) garantiza un formato perfecto.
También te puede interesar
7 intelligente Möglichkeiten, Codeblöcke in Word-Dokumente einzufügen
Inhaltsverzeichnis
- Methode 1: Code aus einer IDE kopieren (Syntaxhervorhebung)
- Methode 2: Einen benutzerdefinierten Code-Stil in Word anwenden
- Methode 3: Code mit 1-Zellen-Tabellen einrahmen
- Methode 4: Code-Schnipsel als Bilder in Word einfügen
- Methode 5: Code als Dokumentobjekt einbetten
- Methode 6: Codeblöcke mit Word-Add-Ins formatieren
- Methode 7: Code-Einfügung mit Python automatisieren
- Vergleich: Die richtige Methode wählen
- Abschließende Gedanken
- Häufig gestellte Fragen
Das Einfügen von Code-Schnipseln in Word-Dokumente ist eine häufige Anforderung für Entwickler, technische Redakteure und Lehrkräfte. Jedoch kann es schwierig sein, lesbare, optisch ansprechende und wartbare Codeblöcke in Word zu erstellen.
Einige Benutzer kopieren einfach aus einer IDE und fügen ein, was die Formatierung stören kann, während andere den Text manuell formatieren oder Screenshots verwenden, was zeitaufwändig sein kann. Für Dokumente, die Konsistenz, Bearbeitung oder Automatisierung erfordern, kann die Wahl der richtigen Methode Stunden an Arbeit sparen.
In diesem Leitfaden stellen wir sieben clevere Methoden vor, um Codeblöcke in Word einzufügen – von schnellen manuellen Ansätzen bis hin zu vollständig automatisierten Arbeitsabläufen mit Python und Spire.Doc – damit Sie die Methode auswählen können, die Ihren Anforderungen am besten entspricht.
Methodenübersicht
- Methode 1: Code aus einer IDE kopieren (Syntaxhervorhebung)
- Methode 2: Einen benutzerdefinierten Code-Stil in Word anwenden
- Methode 3: Code mit 1-Zellen-Tabellen einrahmen
- Methode 4: Code-Schnipsel als Bilder in Word einfügen
- Methode 5: Code als Dokumentobjekt einbetten
- Methode 6: Codeblöcke mit Word-Add-Ins formatieren
- Methode 7: Code-Einfügung mit Python automatisieren
Methode 1: Code aus einer IDE kopieren (Syntaxhervorhebung)
Bei dieser Methode wird Code direkt aus einer IDE (wie VS Code, Visual Studio oder IntelliJ IDEA) kopiert und in ein Word-Dokument eingefügt. Die meisten modernen IDEs behalten die Syntaxhervorhebung und die grundlegende Formatierung beim Kopieren automatisch bei.
Wann diese Methode zu verwenden ist:
Dieser Ansatz eignet sich gut für kurze Codebeispiele in Tutorials, technischen Anleitungen oder Berichten, bei denen das Dokument größtenteils schreibgeschützt ist. Er funktioniert am besten, wenn der Code nach dem Einfügen in Word keine häufigen Aktualisierungen erfordert.
So kopieren Sie Code aus einer IDE in Word:
- Öffnen Sie die Codedatei in Ihrer IDE und wählen Sie die gewünschten Zeilen aus.
- Kopieren Sie die Auswahl mit dem Standard-Kopierbefehl.
- Fügen Sie den Code in Word ein und wählen Sie Ursprüngliche Formatierung beibehalten.
Sie können die Schriftgröße oder den Zeilenabstand anpassen, um sie besser an den umgebenden Inhalt anzupassen.
Vorteile:
- Schnell und bequem
- Behält die Syntaxhervorhebung bei
- Keine zusätzlichen Werkzeuge erforderlich
Nachteile:
- Die Formatierung kann je nach Word-Version variieren
- Nicht ideal für große oder häufig aktualisierte Codeblöcke
Am besten für: Kurze Codebeispiele in Tutorials oder einmaligen Dokumenten
Methode 2: Einen benutzerdefinierten Code-Stil in Word anwenden
Diese Methode verwendet die integrierten Stile von Word, um einen dedizierten „Code“-Stil für die konsistente Formatierung von Code-Schnipseln zu erstellen. Sie können Schriftart, Größe, Farbe, Zeilenabstand und Hintergrundschattierung steuern, um sicherzustellen, dass alle Codeblöcke in Ihrem Dokument einheitlich aussehen.
Wann diese Methode zu verwenden ist:
Ideal für Dokumente, die mehrere Codebeispiele mit konsistenter Formatierung erfordern, insbesondere wenn Bearbeitungen oder Aktualisierungen erwartet werden. Es eignet sich gut für Tutorials, Anleitungen oder Berichte, die über die Zeit gepflegt werden.
So wenden Sie einen benutzerdefinierten Code-Stil an:
- Wählen Sie Ihren Code in Word aus.
- Öffnen Sie den Formatvorlagen-Bereich und erstellen Sie eine neue Formatvorlage mit dem Namen „Code“.
- Stellen Sie die Schriftart auf einen Monospace-Typ ein (z. B. Consolas, Courier New), passen Sie Schriftgröße und Zeilenabstand an und fügen Sie optional eine helle Hintergrundfarbe hinzu (zu finden unter Format > Rahmen).
- Wenden Sie diesen Stil auf alle Codeblöcke an, um eine konsistente Formatierung zu gewährleisten.
Vorteile:
- Einheitliches und professionelles Erscheinungsbild
- Vollständig bearbeitbar und durchsuchbar
- Leicht im gesamten Dokument wiederverwendbar
Nachteile:
- Erfordert eine Ersteinrichtung
- Optisch weniger ansprechend als die Syntaxhervorhebung einer IDE
- Manuelle Anwendung des Stils für jeden neuen Codeblock erforderlich
Am besten für: Mittlere bis lange Dokumente mit mehreren, bearbeitbaren Codebeispielen
Methode 3: Code mit 1-Zellen-Tabellen einrahmen
Bei diesem Ansatz wird jeder Code-Schnipsel in eine Einzeltabellen-Zelle platziert. Die Tabelle fungiert als Container, der den Code hervorhebt und verhindert, dass Text um ihn herumfließt.
Wann diese Methode zu verwenden ist:
Nützlich für kurze Befehle oder Schnipsel, bei denen eine visuelle Trennung vom umgebenden Text wichtig ist. Es ist auch praktisch für Dokumente, die gedruckt oder als PDF exportiert werden sollen.
So rahmen Sie Code in einer Tabelle ein:
- Fügen Sie eine 1×1-Tabelle in Word ein.
- Fügen Sie Ihren Code in die Tabellenzelle ein.
- Wenden Sie eine Monospace-Schriftart an und legen Sie optional eine helle Hintergrundschattierung fest.
- Passen Sie den Zellenabstand an oder entfernen Sie bei Bedarf die Ränder.
Vorteile:
- Klare visuelle Trennung
- Das Layout bleibt über Seiten und Exporte hinweg stabil
- Funktioniert ohne zusätzliche Werkzeuge
Nachteile:
- Das Bearbeiten von langem Code in einer Tabelle kann umständlich sein
- Das Hinzufügen vieler Codeblöcke kann das Dokument unübersichtlich machen
- Tabellenränder erfordern möglicherweise eine Feinabstimmung für die Ästhetik
Am besten für: Kurze Befehle oder Schnipsel, die ein klares, isoliertes Layout benötigen
Methode 4: Code-Schnipsel als Bilder in Word einfügen
Diese Methode wandelt Code in ein Bild um und stellt sicher, dass Formatierung, Farben und Ausrichtung genau wie beabsichtigt in Word erscheinen.
Wann diese Methode zu verwenden ist:
Perfekt für Dokumente, bei denen visuelle Genauigkeit entscheidend ist und der Code nicht bearbeitet werden muss. Beispiele hierfür sind Marketingmaterialien, Berichte für externe Kunden oder PDFs, die zur Verteilung bestimmt sind.
So fügen Sie Code als Bild ein:
- Verwenden Sie ein Screenshot-Tool oder eine IDE-Exportfunktion, um ein Bild Ihres Codes zu erstellen.
- Fügen Sie das Bild mit Einfügen → Bilder in Word ein.
- Passen Sie die Größe nach Bedarf an und fügen Sie optional einen Rahmen hinzu.
Vorteile:
- Formatierung und Farben werden exakt beibehalten
- Sieht professionell und poliert aus
- Sicher für gedruckte oder geteilte PDFs
Nachteile:
- Code ist nicht bearbeitbar
- Nicht durchsuchbar oder kopierbar
- Barrierefreiheitsprobleme für Bildschirmleser
Am besten für: Finale Präsentationsdokumente, bei denen keine Codebearbeitung erforderlich ist
Methode 5: Code als Dokumentobjekt einbetten
Diese Methode bettet Code als separates Objekt anstelle von Inline-Text in das Word-Dokument ein. Anstatt den Code direkt in den Dokumentkörper einzufügen, fügen Sie ein kleines eingebettetes Dokument ein, das den Code enthält. Dies hält den Code visuell isoliert und verhindert, dass Word die Formatierung beeinträchtigt.
Wann diese Methode zu verwenden ist:
Diese Methode eignet sich gut, wenn Sie Code visuell vom umgebenden Inhalt trennen möchten oder wenn der Code unverändert und schreibgeschützt bleiben soll. Sie ist besonders nützlich für Berichte, Spezifikationen oder Dokumente, in denen Code zu Referenzzwecken und nicht zur aktiven Bearbeitung enthalten ist.
So betten Sie Code als Objekt in Word ein:
- Gehen Sie zum Tab Einfügen in Word.
- Klicken Sie auf den Dropdown-Pfeil Objekt und wählen Sie Objekt.
- Wählen Sie auf dem Tab Neu erstellen als Objekttyp OpenDocument-Text.
- Klicken Sie auf OK. Ein neues Dokumentfenster wird geöffnet.
- Fügen Sie Ihren Code in das neue Dokument ein oder geben Sie ihn ein.
- Schließen Sie das Fenster des eingebetteten Dokuments.
Nach dem Schließen erscheint der Code in Ihrem ursprünglichen Word-Dokument als eingebettetes Objekt. Sie können es nach Bedarf verschieben oder in der Größe ändern.
Vorteile:
- Hält den Code klar vom Hauptdokumenttext getrennt
- Verhindert, dass Word die Formatierung ändert
- Objekt kann leicht in der Größe geändert oder neu positioniert werden
- Geeignet für schreibgeschützte Codeblöcke
Nachteile:
- Code kann nicht direkt inline bearbeitet werden
- Nicht ideal für langen oder häufig aktualisierten Code
Am besten für: Einbetten von stabilen, schreibgeschützten Code-Schnipseln in Berichten oder Dokumentationen, bei denen die Layoutkontrolle wichtiger ist als die Bearbeitbarkeit
Methode 6: Codeblöcke mit Word-Add-Ins formatieren
Dieser Ansatz verwendet ein dediziertes Word-Add-In, um Code-Schnipsel direkt in Ihrem Dokument zu formatieren und hervorzuheben. Ein beliebtes Add-In, das im Office Add-Ins Store erhältlich ist, ist Easy Syntax Highlighter (kostenlos), das viele Programmiersprachen und Themen unterstützt.
Wann diese Methode zu verwenden ist:
Verwenden Sie diese Methode, wenn Sie Syntaxhervorhebung und Codeformatierung automatisch anwenden möchten, ohne Bilder einzufügen oder manuell zu formatieren. Sie ist besonders nützlich für größere Mengen von Schnipseln in Dokumentationen, bei denen eine konsistente Hervorhebung wichtig ist.
So verwenden Sie das Easy Syntax Highlighter Add-In:
- Gehen Sie in Word zum Tab Einfügen und wählen Sie Add-Ins abrufen (oder Office-Add-Ins).
- Suchen Sie nach Easy Syntax Highlighter und installieren Sie es.
- Wählen Sie nach der Installation den Codeblock aus, den Sie formatieren möchten.
- Verwenden Sie das Menüband oder den Bereich des Add-Ins, um eine Sprache auszuwählen und die Hervorhebung anzuwenden.
- Der ausgewählte Code wird mit Syntaxfarben und -stilen formatiert.
(Ein alternatives Add-In, das Sie erwähnen können, ist Easy Code Formatter, das ebenfalls ausgewählten Text als Code mit integrierten Themen formatiert.)
Vorteile:
- Wendet Syntaxhervorhebung direkt in Word an
- Unterstützt viele Sprachen und Themen
- Macht wiederholtes Einfügen viel einfacher als manuelle Formatierung
Nachteile:
- Erfordert die Installation eines Add-Ins
- Einige Funktionen/Themen erfordern möglicherweise eine Konfiguration
Am besten für: Mittlere bis große Dokumente, bei denen Konsistenz und Formatierungsgeschwindigkeit wichtig sind
Methode 7: Code-Einfügung mit Python automatisieren
Für große Dokumente oder wiederholte Code-Einfügungen können Sie den Prozess mit Python automatisieren. Diese Methode nutzt Spire.Doc for Python, um Word-Dokumente zu erstellen, und Pygments, um die Syntaxhervorhebung automatisch anzuwenden. Es funktioniert für Python, C#, Java und viele andere Sprachen und ist somit eine universelle Lösung für technische Dokumentationen.
Wann diese Methode zu verwenden ist:
Verwenden Sie diese Methode, wenn Sie viele Code-Schnipsel haben, konsistente Syntaxhervorhebung benötigen oder Dokumente automatisch generieren möchten (für Berichte, Tutorials oder Handbücher). Sie ist ideal für Situationen, in denen manuelles Kopieren und Einfügen oder Add-Ins unpraktisch sind.
So automatisieren Sie die Code-Einfügung:
-
Installieren Sie die erforderlichen Bibliotheken, falls Sie dies noch nicht getan haben:
pip install spire.doc pygments -
Bereiten Sie Ihren Code als Zeichenfolge vor.
-
Verwenden Sie Pygments, um den Code in RTF mit Syntaxhervorhebung umzuwandeln, indem Sie den entsprechenden Lexer für die Sprache angeben oder guess_lexer verwenden, um ihn automatisch zu erkennen.
-
Verwenden Sie Spire.Doc, um ein Word-Dokument zu erstellen, einen Absatz hinzuzufügen und die RTF-Zeichenfolge einzufügen.
-
Speichern Sie das Dokument als DOCX.
Hier ist ein Beispiel mit Python-Code:
from pygments import highlight
from pygments.lexers import CSharpLexer, guess_lexer
from pygments.formatters import RtfFormatter
from spire.doc import *

# Definieren Sie den einzufügenden Code (C#, Java, Python usw.)
code = """
using System;

namespace HelloWorldApp
{
    class Program
    {
        static void Main(string[] args)
        {
            // „Hello World“ in die Konsole ausgeben
            Console.WriteLine("Hello, World!");
        }
    }
}
"""

# Schriftartnamen festlegen
formatter = RtfFormatter(fontface="Consolas")

# Option 1: Den Lexer explizit angeben (empfohlen, wenn die Sprache bekannt ist)
rtf_text = highlight(code, CSharpLexer(), formatter)
rtf_text = rtf_text.replace(r"\f0", r"\f0\fs21")  # Schriftgröße

# Option 2: Die Programmiersprache automatisch erkennen
# Dies ist nützlich bei der Verarbeitung von gemischten oder unbekannten Code-Schnipseln
# lexer = guess_lexer(code)
# rtf_text = highlight(code, lexer, formatter)

# Ein Word-Dokument laden
doc = Document()
doc.LoadFromFile("Input.docx")

# Einen Absatz hinzufügen
section = doc.Sections.get_Item(0)
para = section.AddParagraph()

# Den syntaxhervorgehobenen Code als RTF einfügen
para.AppendRTF(rtf_text)

# Das Dokument speichern
doc.SaveToFile("InsertCode.docx", FileFormat.Docx2016)
doc.Close()
Nach Ausführung des Skripts enthält das resultierende Word-Dokument vollständig formatierten und syntaxhervorgehobenen Code, der bearbeitbar und konsistent ist, unabhängig von der verwendeten Programmiersprache.
Vorteile:
- Vollständig automatisiert und skalierbar für mehrere Codeblöcke
- Funktioniert für Python, C#, Java und viele andere Sprachen
- Konsistente Syntaxhervorhebung und bearbeitbare Word-Ausgabe
Nachteile:
- Erfordert eine Python-Umgebung und Bibliotheken
- Leichte Einrichtung und Lernkurve für Erstanwender
Am besten für: Generierung großer technischer Dokumente, Tutorials oder Berichte mit mehreren Code-Schnipseln, bei denen Automatisierung und Konsistenz Priorität haben
Über das Einfügen von syntaxhervorgehobenen Codeblöcken per RTF hinaus unterstützt Spire.Doc for Python auch das Hinzufügen von Code-Schnipseln zu Word-Dokumenten mittels HTML oder Bildern, was nützlich sein kann, wenn die Formatierung bereits an anderer Stelle vorbereitet wurde. Darüber hinaus können Markdown-Dateien, die Codeblöcke enthalten, in Word-Dokumente konvertiert werden, wobei Struktur und Lesbarkeit erhalten bleiben.
Sobald das Dokument generiert ist, kann es direkt als PDF exportiert werden, was diesen Ansatz für durchgängige Dokumentations-Workflows geeignet macht, die vom Code ausgehen und mit einem verteilbaren Dateiformat enden.
Vergleich: Die richtige Methode wählen
| Methode | Benutzerfreundlichkeit | Einrichtung / Erforderliche Werkzeuge | Skalierbarkeit | Am besten für |
|---|---|---|---|---|
| Kopieren aus IDE | ★★★★★ | Keine | Niedrig | Kurze, einmalige Codebeispiele |
| Benutzerdefinierter Word-Stil | ★★★★☆ | Manuelle Stileinrichtung | Mittel | Dokumente mit wiederholten Codeblöcken |
| 1-Zellen-Tabelle | ★★★★☆ | Nur Word | Niedrig | Eingerahmter Code mit Layoutkontrolle |
| Code als Bilder | ★★★★☆ | Screenshot-Tool oder IDE-Export | Niedrig | Schreibgeschützte oder designorientierte Dokumente |
| Dokumentobjekt | ★★★☆☆ | Word-Objektunterstützung | Niedrig | Eingebettete, isolierte Codeblöcke |
| Word-Add-Ins | ★★★★☆ | Add-In-Installation | Mittel | Schnelle Formatierung ohne Programmierung |
| Programmatisch (Python) | ★★☆☆☆ | Python + Bibliotheken | Hoch | Große oder häufig aktualisierte Dokumente |
Abschließende Gedanken
Es gibt keinen Einheitsansatz für das Einfügen von Code in Word. Für schnelle, einmalige Schnipsel können manuelles Kopieren oder Tabellen ausreichen. Wenn Ihr Dokument häufig bearbeitet wird oder mehrere Schnipsel enthält, gewährleistet die Verwendung von benutzerdefinierten Word-Stilen oder einem Schnipsel-Add-In Konsistenz. Für groß angelegte oder automatisierte Arbeitsabläufe bietet Python mit Spire.Doc und Pygments maximale Effizienz und Kontrolle.
Indem Sie die Stärken und Grenzen jeder Methode verstehen, können Sie professionelle, lesbare und wartbare Dokumente erstellen und gleichzeitig die Frustration minimieren, die oft mit der Formatierung von Code in Word verbunden ist.
Häufig gestellte Fragen
F1: Kann ich Code aus jeder IDE in Word kopieren und die Formatierung beibehalten?
Die meisten modernen IDEs, einschließlich VS Code, Visual Studio und IntelliJ IDEA, behalten die grundlegende Formatierung und Syntaxhervorhebung beim Kopieren bei. Je nach Word-Themen und Schriftarten können einige Unterschiede auftreten.
F2: Kann ich mehrere Programmiersprachen in einem einzigen Word-Dokument verwenden?
Ja. Die Methoden 1–6 funktionieren für jede Sprache, solange Sie die richtige Formatierung wählen. Methode 7 (Python + Pygments) unterstützt viele Sprachen, und guess_lexer kann die Sprache automatisch erkennen.
F3: Ist die automatisierte Python-Methode schwierig einzurichten?
Es erfordert die Installation von Python und den erforderlichen Bibliotheken (Spire.Doc und pygments), aber der Arbeitsablauf ist nach der Einrichtung einfach und spart Zeit bei großen oder wiederholten Code-Einfügungen.
F4: Welche Methode eignet sich am besten für finale, präsentationsreife Dokumente?
Wenn visuelle Genauigkeit entscheidend ist und keine Bearbeitung erforderlich ist, gewährleistet das Einfügen des Codes als Bild (Methode 4) eine perfekte Formatierung.
Das könnte Sie auch interessieren
7 умных способов вставить блоки кода в документы Word
Содержание
- Метод 1: Копирование кода из IDE (с подсветкой синтаксиса)
- Метод 2: Применение пользовательского стиля кода в Word
- Метод 3: Размещение кода в таблицах с одной ячейкой
- Метод 4: Добавление фрагментов кода в Word в виде изображений
- Метод 5: Встраивание кода как объекта документа
- Метод 6: Форматирование блоков кода с помощью надстроек Word
- Метод 7: Автоматизация вставки кода с помощью Python
- Сравнение: выбор подходящего метода
- Заключительные мысли
- Часто задаваемые вопросы
Включение фрагментов кода в документы Word — обычная потребность для разработчиков, технических писателей и преподавателей. Однако добиться читаемых, визуально привлекательных и удобных для сопровождения блоков кода в Word может быть непросто.
Некоторые пользователи просто копируют и вставляют код из IDE, что может нарушить форматирование, в то время как другие вручную стилизуют текст или используют скриншоты, что может отнимать много времени. Для документов, требующих согласованности, редактирования или автоматизации, выбор правильного метода может сэкономить часы работы.
В этом руководстве мы рассмотрим семь умных способов вставки блоков кода в Word — от быстрых ручных подходов до полностью автоматизированных рабочих процессов с использованием Python и Spire.Doc — чтобы вы могли выбрать метод, который наилучшим образом соответствует вашим потребностям.
Обзор методов
- Метод 1: Копирование кода из IDE (с подсветкой синтаксиса)
- Метод 2: Применение пользовательского стиля кода в Word
- Метод 3: Размещение кода в таблицах с одной ячейкой
- Метод 4: Добавление фрагментов кода в Word в виде изображений
- Метод 5: Встраивание кода как объекта документа
- Метод 6: Форматирование блоков кода с помощью надстроек Word
- Метод 7: Автоматизация вставки кода с помощью Python
Метод 1: Копирование кода из IDE (с подсветкой синтаксиса)
Этот метод заключается в копировании кода непосредственно из IDE (например, VS Code, Visual Studio или IntelliJ IDEA) и вставке его в документ Word. Большинство современных IDE автоматически сохраняют подсветку синтаксиса и базовое форматирование при копировании кода.
Когда использовать этот метод:
Этот подход хорошо подходит для коротких примеров кода в учебных пособиях, технических руководствах или отчетах, где документ в основном предназначен только для чтения. Он лучше всего работает, когда код не требует частых обновлений после добавления в Word.
Как скопировать код из IDE в Word:
- Откройте файл с кодом в вашей IDE и выделите нужные строки.
- Скопируйте выделенное с помощью стандартной команды копирования.
- Вставьте код в Word и выберите Сохранить исходное форматирование.
Вы можете настроить размер шрифта или межстрочный интервал, чтобы лучше соответствовать окружающему контенту.
Плюсы:
- Быстро и удобно
- Сохраняет подсветку синтаксиса
- Не требуются дополнительные инструменты
Минусы:
- Форматирование может отличаться в разных версиях Word
- Не идеально для больших или часто обновляемых блоков кода
Лучше всего подходит для: коротких примеров кода в учебных пособиях или разовых документах
Метод 2: Применение пользовательского стиля кода в Word
Этот метод использует встроенные стили Word для создания специального стиля «Код» для последовательного форматирования фрагментов кода. Вы можете контролировать шрифт, размер, цвет, межстрочный интервал и фоновую заливку, обеспечивая единообразный вид всех блоков кода в документе.
Когда использовать этот метод:
Идеально подходит для документов, требующих нескольких примеров кода с единообразным форматированием, особенно когда ожидаются правки или обновления. Он хорошо работает для учебных пособий, руководств или отчетов, которые будут поддерживаться со временем.
Как применить пользовательский стиль кода:
- Выделите ваш код в Word.
- Откройте панель Стили и создайте новый стиль с именем «Код».
- Установите моноширинный шрифт (например, Consolas, Courier New), настройте размер шрифта и межстрочный интервал и, при желании, добавьте светлый цвет фона (находится в меню Формат > Границы).
- Примените этот стиль ко всем блокам кода для единообразного форматирования.
Плюсы:
- Единообразный и профессиональный вид
- Полностью редактируемый и доступный для поиска
- Легко использовать повторно в документе
Минусы:
- Требуется начальная настройка
- Менее визуально эффектно, чем подсветка синтаксиса в IDE
- Требуется ручное применение стиля для каждого нового блока кода
Лучше всего подходит для: средних и длинных документов с несколькими редактируемыми примерами кода
Метод 3: Размещение кода в таблицах с одной ячейкой
Этот подход заключается в размещении каждого фрагмента кода внутри таблицы с одной ячейкой. Таблица действует как контейнер, помогая коду выделиться и предотвращая обтекание его текстом.
Когда использовать этот метод:
Полезно для коротких команд или фрагментов, где важно визуальное отделение от окружающего текста. Это также удобно для документов, которые могут быть распечатаны или экспортированы в PDF.
Как разместить код в таблице:
- Вставьте в Word таблицу 1×1.
- Вставьте ваш код в ячейку таблицы.
- Примените моноширинный шрифт и, при желании, установите светлую фоновую заливку.
- При необходимости настройте отступы в ячейке или удалите границы.
Плюсы:
- Четкое визуальное разделение
- Макет остается стабильным на разных страницах и при экспорте
- Работает без дополнительных инструментов
Минусы:
- Редактирование длинного кода внутри таблицы может быть неудобным
- Добавление множества блоков кода может загромождать документ
- Границы таблицы могут потребовать тонкой настройки для эстетики
Лучше всего подходит для: коротких команд или фрагментов, требующих четкого, изолированного макета
Метод 4: Добавление фрагментов кода в Word в виде изображений
Этот метод преобразует код в изображение, гарантируя, что форматирование, цвета и выравнивание будут выглядеть в Word именно так, как задумано.
Когда использовать этот метод:
Идеально подходит для документов, где важна визуальная точность, а код не нужно редактировать. Примеры включают маркетинговые материалы, отчеты для внешних клиентов или PDF-файлы, предназначенные для распространения.
Как вставить код в виде изображения:
- Используйте инструмент для создания скриншотов или функцию экспорта в IDE, чтобы создать изображение вашего кода.
- Вставьте изображение в Word, используя Вставка → Изображения.
- При необходимости измените размер и, по желанию, добавьте рамку.
Плюсы:
- Форматирование и цвета сохраняются в точности
- Выглядит профессионально и отточено
- Безопасно для печатных или распространяемых PDF-файлов
Минусы:
- Код не редактируется
- Не доступен для поиска или копирования
- Проблемы с доступностью для программ чтения с экрана
Лучше всего подходит для: финальных презентационных документов, где редактирование кода не требуется
Метод 5: Встраивание кода как объекта документа
Этот метод встраивает код в документ Word как отдельный объект, а не как встроенный текст. Вместо того чтобы вставлять код непосредственно в тело документа, вы вставляете небольшой встроенный документ, содержащий код. Это позволяет визуально изолировать код и предотвращает вмешательство Word в форматирование.
Когда использовать этот метод:
Этот метод хорошо работает, когда вы хотите визуально отделить код от окружающего контента или когда код должен оставаться неизменным и доступным только для чтения. Он особенно полезен для отчетов, спецификаций или документов, где код включен для справки, а не для активного редактирования.
Как встроить код как объект в Word:
- Перейдите на вкладку Вставка в Word.
- Нажмите на выпадающую стрелку Объект и выберите Объект.
- На вкладке Создать новый выберите Текст OpenDocument в качестве типа объекта.
- Нажмите OK. Откроется новое окно документа.
- Вставьте или введите ваш код в новый документ.
- Закройте окно встроенного документа.
После закрытия код появится в вашем исходном документе Word как встроенный объект. Вы можете перемещать его или изменять его размер по мере необходимости.
Плюсы:
- Четко отделяет код от основного текста документа
- Предотвращает изменение форматирования Word
- Объект можно легко изменять в размере или перемещать
- Подходит для блоков кода, предназначенных только для чтения
Минусы:
- Код нельзя редактировать непосредственно в тексте
- Не идеально для длинного или часто обновляемого кода
Лучше всего подходит для: встраивания стабильных, предназначенных только для чтения фрагментов кода в отчеты или документацию, где контроль макета важнее возможности редактирования
Метод 6: Форматирование блоков кода с помощью надстроек Word
Этот подход использует специальную надстройку Word для форматирования и подсветки фрагментов кода непосредственно в вашем документе. Одной из популярных надстроек, доступных в магазине надстроек Office, является Easy Syntax Highlighter (бесплатная), которая поддерживает множество языков программирования и тем.
Когда использовать этот метод:
Используйте этот метод, когда вам нужна автоматическая подсветка синтаксиса и форматирование кода без вставки изображений или ручной стилизации. Это особенно полезно для больших наборов фрагментов в документации, где важна последовательная подсветка.
Как использовать надстройку Easy Syntax Highlighter:
- В Word перейдите на вкладку Вставка и выберите Получить надстройки (или Надстройки Office).
- Найдите Easy Syntax Highlighter и установите его.
- После установки выделите блок кода, который вы хотите отформатировать.
- Используйте ленту или панель надстройки, чтобы выбрать язык и применить подсветку.
- Выделенный код будет отформатирован с использованием синтаксических цветов и стилей.
(Альтернативная надстройка, которую вы можете упомянуть, — это Easy Code Formatter, которая также форматирует выделенный текст как код, используя встроенные темы.)
Плюсы:
- Применяет подсветку синтаксиса непосредственно в Word
- Поддерживает множество языков и тем
- Значительно упрощает повторную вставку по сравнению с ручной стилизацией
Минусы:
- Требуется установка надстройки
- Некоторые функции/темы могут требовать настройки
Лучше всего подходит для: средних и больших документов, где важны последовательность и скорость форматирования
Метод 7: Автоматизация вставки кода с помощью Python
Для больших документов или повторяющихся вставок кода вы можете автоматизировать процесс с помощью Python. Этот метод использует Spire.Doc for Python для создания документов Word и Pygments для автоматического применения подсветки синтаксиса. Он работает для Python, C#, Java и многих других языков, что делает его универсальным решением для технической документации.
Когда использовать этот метод:
Используйте этот метод, когда у вас есть много фрагментов кода, нужна последовательная подсветка синтаксиса или вы хотите автоматически генерировать документы (для отчетов, учебных пособий или руководств). Он идеально подходит для ситуаций, когда ручное копирование-вставка или надстройки непрактичны.
Как автоматизировать вставку кода:
-
Установите необходимые библиотеки, если вы еще этого не сделали:
pip install spire.doc pygments -
Подготовьте ваш код в виде строки.
-
Используйте Pygments для преобразования кода в RTF с подсветкой синтаксиса, указав соответствующий лексер для языка, или используйте guess_lexer для его автоматического определения.
-
Используйте Spire.Doc для создания документа Word, добавления абзаца и вставки строки RTF.
-
Сохраните документ как DOCX.
Вот пример с использованием кода Python:
from pygments import highlight
from pygments.lexers import CSharpLexer, guess_lexer
from pygments.formatters import RtfFormatter
from spire.doc import *

# Define the code to insert (C#, Java, Python, etc.)
code = """
using System;

namespace HelloWorldApp
{
    class Program
    {
        static void Main(string[] args)
        {
            // Print Hello World to the console
            Console.WriteLine("Hello, World!");
        }
    }
}
"""

# Set font name
formatter = RtfFormatter(fontface="Consolas")

# Option 1: Specify the lexer explicitly (recommended when language is known)
rtf_text = highlight(code, CSharpLexer(), formatter)
rtf_text = rtf_text.replace(r"\f0", r"\f0\fs21")  # font size

# Option 2: Automatically detect the programming language
# This is useful when processing mixed or unknown code snippets
# lexer = guess_lexer(code)
# rtf_text = highlight(code, lexer, formatter)

# Load a Word document
doc = Document()
doc.LoadFromFile("Input.docx")

# Add a paragraph
section = doc.Sections.get_Item(0)
para = section.AddParagraph()

# Insert the syntax-highlighted code as RTF
para.AppendRTF(rtf_text)

# Save the document
doc.SaveToFile("InsertCode.docx", FileFormat.Docx2016)
doc.Close()
После запуска скрипта полученный документ Word содержит полностью отформатированный и подсвеченный синтаксически код, редактируемый и единообразный, независимо от используемого языка программирования.
Плюсы:
- Полностью автоматизирован и масштабируем для нескольких блоков кода
- Работает для Python, C#, Java и многих других языков
- Последовательная подсветка синтаксиса и редактируемый вывод в Word
Минусы:
- Требуется среда Python и библиотеки
- Небольшая настройка и кривая обучения для начинающих пользователей
Лучше всего подходит для: создания больших технических документов, учебных пособий или отчетов с несколькими фрагментами кода, где автоматизация и последовательность являются приоритетами
Помимо вставки блоков кода с подсветкой синтаксиса через RTF, Spire.Doc for Python также поддерживает добавление фрагментов кода в документы Word с использованием HTML или изображений, что может быть полезно, когда форматирование уже подготовлено в другом месте. Кроме того, файлы Markdown, содержащие блоки кода, можно конвертировать в документы Word, сохраняя структуру и читаемость.
После создания документа его можно экспортировать непосредственно в PDF, что делает этот подход подходящим для сквозных рабочих процессов документирования, которые начинаются с кода и заканчиваются распространяемым форматом файла.
Сравнение: выбор подходящего метода
| Метод | Простота использования | Настройка / Требуемые инструменты | Масштабируемость | Лучше всего подходит для |
|---|---|---|---|---|
| Копирование из IDE | ★★★★★ | Нет | Низкая | Короткие, разовые примеры кода |
| Пользовательский стиль Word | ★★★★☆ | Ручная настройка стиля | Средняя | Документы с повторяющимися блоками кода |
| Таблица с 1 ячейкой | ★★★★☆ | Только Word | Низкая | Код в рамке с контролем макета |
| Код как изображения | ★★★★☆ | Инструмент для скриншотов или экспорт из IDE | Низкая | Документы только для чтения или с акцентом на дизайн |
| Объект документа | ★★★☆☆ | Поддержка объектов Word | Низкая | Встроенные, изолированные блоки кода |
| Надстройки Word | ★★★★☆ | Установка надстройки | Средняя | Быстрое форматирование без программирования |
| Программный (Python) | ★★☆☆☆ | Python + Библиотеки | Высокая | Большие или часто обновляемые документы |
Заключительные мысли
Не существует универсального подхода к вставке кода в Word. Для быстрых, разовых фрагментов может быть достаточно ручного копирования или таблиц. Если ваш документ будет часто редактироваться или содержит несколько фрагментов, использование пользовательских стилей Word или надстройки для фрагментов обеспечивает единообразие. Для крупномасштабных или автоматизированных рабочих процессов Python с Spire.Doc и Pygments предлагает максимальную эффективность и контроль.
Понимая сильные и слабые стороны каждого метода, вы можете создавать профессиональные, читаемые и удобные для сопровождения документы, сводя к минимуму разочарование, часто связанное с форматированием кода в Word.
Часто задаваемые вопросы
В1: Могу ли я скопировать код из любой IDE в Word и сохранить форматирование?
Большинство современных IDE, включая VS Code, Visual Studio и IntelliJ IDEA, сохраняют базовое форматирование и подсветку синтаксиса при копировании. Некоторые различия могут возникать в зависимости от тем и шрифтов Word.
В2: Могу ли я включить несколько языков программирования в один документ Word?
Да. Методы 1–6 работают для любого языка, если вы выберете правильное форматирование. Метод 7 (Python + Pygments) поддерживает множество языков, а guess_lexer может автоматически определять язык.
В3: Сложно ли настроить автоматизированный метод с Python?
Это требует установки Python и необходимых библиотек (Spire.Doc и pygments), но рабочий процесс прост после настройки и экономит время при больших или повторяющихся вставках кода.
В4: Какой метод лучше всего подходит для финальных, готовых к презентации документов?
Если важна визуальная точность и редактирование не требуется, вставка кода в виде изображения (Метод 4) обеспечивает идеальное форматирование.
Вам также может быть интересно
Como converter Word para EPUB (3 maneiras fáceis)
Na era digital de hoje, os eBooks se tornaram uma das formas mais populares de compartilhar informações, histórias e conteúdo profissional. Embora os documentos do Word sejam perfeitos para redigir e editar texto, eles não são ideais para leitura digital em eReaders e dispositivos móveis. Para tornar seu conteúdo acessível, legível e visualmente atraente, converter arquivos do Word para o formato EPUB é um passo necessário para autores, editores e criadores de conteúdo.
Neste guia, abordaremos três maneiras práticas de converter Word para EPUB, juntamente com dicas para otimizar seu eBook para máxima legibilidade e compatibilidade.
O que você vai aprender
- O que é EPUB
- Por que converter Word para EPUB
- Como converter Word para EPUB
- Melhores práticas para conversão de Word para EPUB
- Conclusão
- Perguntas frequentes sobre Word para EPUB
O que é EPUB
EPUB, abreviação de Publicação Eletrônica, é um formato de livro digital de padrão aberto amplamente utilizado na publicação de eBooks. Diferente dos arquivos do Word, o EPUB é projetado especificamente para eBooks de qualidade profissional, oferecendo uma estrutura flexível que permite que o conteúdo seja organizado e apresentado de forma consistente em todos os dispositivos.
Como padrão da indústria para publicação digital, o EPUB é amplamente adotado por autores, editores e instituições de ensino para criar livros digitais fáceis de distribuir, manter e gerenciar. Seu formato estruturado garante que os eBooks atendam aos requisitos de publicação profissional, permanecendo versáteis para uma variedade de dispositivos e plataformas.
Por que converter Word para EPUB
Embora os arquivos do Word sejam comumente usados para criar conteúdo, eles não são estruturados para distribuição profissional de eBooks em vários dispositivos. A conversão de Word para EPUB oferece múltiplos benefícios:
- Legibilidade aprimorada em todos os dispositivos: O EPUB ajusta o fluxo do texto, tornando seu conteúdo legível em telas pequenas, como smartphones.
- Apresentação profissional: Títulos, listas, tabelas, imagens e hiperlinks são preservados e formatados para eReaders.
- Compatibilidade mais ampla: O EPUB funciona no Kindle, Nook, Kobo, Apple Books e outros eReaders populares.
- Tamanho de arquivo menor: Os arquivos EPUB são leves e mais fáceis de distribuir online.
- Acessibilidade: Suporta recursos como conversão de texto em fala e redimensionamento de fonte para leitores com deficiência visual.
Resumindo, converter Word para EPUB transforma um documento básico em um eBook de qualidade profissional, amigável ao leitor e pronto para publicação ou distribuição.
Como converter Word para EPUB
Existem vários métodos que você pode usar para converter Word para EPUB, desde conversores online rápidos até software de desktop e soluções automatizadas em Python. Abaixo, exploraremos cada método em detalhes.
Método 1: Converter Word para EPUB usando ferramentas online
As ferramentas de conversão online são a maneira mais rápida e fácil de transformar documentos do Word em EPUB. Elas são perfeitas para conversões únicas, arquivos pequenos ou usuários que preferem não instalar software.
Sites como Zamzar, Convertio e Online-Convert oferecem serviços gratuitos para converter Word para EPUB. Aqui, usaremos o Convertio para demonstração.
Passos para converter Word para EPUB online:
- Acesse o Convertio: Abra o Conversor Online de Word para EPUB do Convertio.
- Carregue seu documento do Word: Clique no botão "Escolher arquivos" e selecione o arquivo do Word (DOCX ou DOC) que deseja converter.
- Selecione EPUB como formato de saída: Escolha EPUB na lista de formatos de saída disponíveis.
- Converter e baixar: Clique em "Converter" e espere a ferramenta processar seu arquivo. Assim que a conversão estiver concluída, você pode baixar o arquivo EPUB.
Prós:
- Gratuito e fácil de usar.
- Nenhuma instalação de software necessária.
- Acessível de qualquer dispositivo (laptops, celulares e mais) com conexão à internet.
Contras:
- Controle limitado sobre formatação e metadados.
- A maioria das ferramentas de conversão gratuitas geralmente tem restrições de tamanho de arquivo.
- Não é ideal para conteúdo sensível devido a preocupações com a privacidade.
Você também pode gostar: Converter Word para ODT: 4 métodos fáceis e confiáveis
Método 2: Converter Word para EPUB usando software de desktop gratuito (Calibre)
Para maior controle sobre a formatação e conversão offline, o software de desktop é a escolha ideal. Calibre, uma ferramenta de gerenciamento de eBooks gratuita e de código aberto, é uma das opções mais populares para converter documentos do Word para EPUB. Ele oferece uma ampla gama de opções de personalização, tornando-o uma solução versátil para usuários que precisam ajustar formatação, metadados e muito mais durante o processo de conversão.
Passos para converter Word para EPUB com o Calibre:
-
Baixe e instale o Calibre: Visite o site do Calibre para baixar e instalar o software.
-
Adicione seu documento do Word: Inicie o Calibre e clique em "Adicionar livros" para importar seu arquivo do Word.
-
Converta o arquivo: Depois que seu arquivo for adicionado, selecione-o, clique em "Converter livros" e escolha EPUB como formato de saída.
-
Ajustar configurações de conversão (opcional): O Calibre permite que você ajuste configurações como fontes, margens e metadados. Se você está procurando mais controle sobre a aparência do seu eBook, este é um ótimo lugar para personalizar.
-
Salve o arquivo EPUB: Clique em "OK" para iniciar a conversão. Quando terminar, o arquivo EPUB convertido será salvo no mesmo diretório do seu arquivo original do Word.
Prós:
- Gratuito e de código aberto.
- Funciona offline, sem necessidade de conexão com a internet.
- Fornece controle total sobre a aparência e os metadados do eBook.
Contras:
- Leve curva de aprendizado para iniciantes.
- A interface do usuário pode parecer esmagadora no início.
Método 3: Converter em lote Word para EPUB automaticamente com Python
Se você precisa converter frequentemente vários documentos do Word para EPUB, a automação com Python é uma solução eficiente. Com as bibliotecas Python, você pode automatizar facilmente as conversões em lote sem a necessidade de intervenção manual.
Spire.Doc for Python é uma biblioteca popular para esta tarefa. Permite aos usuários criar, manipular e converter documentos do Word em vários formatos, incluindo EPUB. Oferece recursos robustos como:
- Retenção de formatação: Garante que a estrutura do seu documento permaneça intacta.
- Edição de metadados: Personalize autor, título e outras propriedades.
- Processamento em lote: Converta vários arquivos de uma vez, economizando tempo e esforço.
Isso torna o Spire.Doc uma escolha ideal para automatizar a conversão de Word para EPUB, especialmente para empresas ou editores de conteúdo que lidam com grandes volumes de documentos.
Passos para converter em lote Word para EPUB com Python:
-
Instale o Spire.Doc for Python:
Para começar, primeiro instale a biblioteca Spire.Doc for Python usando pip. Execute o seguinte comando:
pip install spire.doc -
Escreva o script Python:
Depois que a biblioteca estiver instalada, crie um script Python para automatizar o processo de conversão. Aqui está o script básico para converter todos os arquivos Word DOC ou DOCX em uma pasta para EPUB:
from spire.doc import * import os # Defina os diretórios de entrada e saída input_dir = 'caminho_para_arquivos_de_entrada' output_dir = 'caminho_para_arquivos_de_saida' # Obtenha uma lista de todos os arquivos do Word no diretório de entrada word_files = [f for f in os.listdir(input_dir) if f.endswith('.docx') or f.endswith('.doc')] # Processe cada arquivo do Word for word_file in word_files: input_file = os.path.join(input_dir, word_file) output_file = os.path.join(output_dir, os.path.splitext(word_file)[0] + '.epub') # Crie um objeto Document doc = Document() # Carregue o documento do Word doc.LoadFromFile(input_file) # Salve o documento do Word como EPUB doc.SaveToFile(output_file, FileFormat.EPub) # Feche o objeto Document doc.Close() print("Conversão em lote concluída com sucesso!") -
Execute o script Python:
Depois de salvar o script, execute-o a partir do seu terminal ou IDE. O script processará automaticamente todos os arquivos do Word na pasta de entrada e os salvará como arquivos EPUB na pasta de saída.
Notas:
- Você precisa modificar as variáveis input_dir e output_dir neste exemplo para apontar para as pastas apropriadas em seu sistema.
- Você pode personalizar a aparência do arquivo EPUB durante a conversão, como adicionar uma imagem de capa para ele. Consulte o guia oficial: Python: Converter Word para EPUB
Prós:
- Ideal para lidar com grandes volumes de documentos.
- Totalmente automatizado uma vez que o script é configurado, economizando tempo e esforço.
- Pode ser facilmente integrado em fluxos de trabalho existentes ou sistemas de publicação automatizados.
Contras:
- Requer algum conhecimento de programação para configurar o script.
- Não é tão amigável quanto os conversores online ou software de desktop para usuários não técnicos.
- A configuração inicial pode levar tempo para configurar e testar o processo de automação.
Melhores práticas para conversão de Word para EPUB
Para criar eBooks EPUB de alta qualidade a partir de documentos do Word, siga estas melhores práticas essenciais:
- Use estilos do Word de forma consistente: Aplique estilos de título, listas e parágrafos para preservar a formatação no arquivo EPUB.
- Otimize imagens: Redimensione e comprima imagens para reduzir o tamanho do arquivo sem sacrificar a qualidade.
- Inclua metadados: Adicione informações importantes como autor, título, idioma e imagem de capa para melhorar a apresentação e a descoberta.
- Valide arquivos EPUB: Use o EPUBCheck para garantir que seu arquivo atenda aos padrões EPUB e funcione em todos os dispositivos.
- Visualize em vários dispositivos: Verifique a legibilidade e o layout em vários eReaders, tablets e smartphones.
- Mantenha a formatação simples: Evite layouts complexos do Word que podem não ser bem convertidos para EPUB.
Seguindo estas melhores práticas, você garantirá que a conversão de Word para EPUB resulte em um eBook polido e profissional, pronto para qualquer dispositivo.
Conclusão
A conversão de Word para EPUB é um passo crucial na criação de eBooks profissionais, amigáveis ao leitor e amplamente compatíveis. Dependendo de suas necessidades e conhecimentos técnicos, você pode escolher o método que melhor se adapta ao seu fluxo de trabalho.
- Conversores online: Ideais para conversões rápidas de um único arquivo com o mínimo de esforço. Essas ferramentas são perfeitas para projetos pessoais ou uso ocasional.
- Software de desktop (por exemplo, Calibre): Mais adequado para usuários que precisam de controle preciso sobre formatação e metadados. O Calibre é uma ferramenta poderosa que permite personalizar a aparência e a estrutura do seu eBook.
- Automação com Python: A melhor opção para fluxos de trabalho repetíveis em grande escala. O Python é perfeito para editores de conteúdo ou equipes que precisam automatizar conversões em massa de forma eficiente.
O método certo depende de seus requisitos específicos, habilidades técnicas e do volume de documentos que você precisa processar. Ao escolher a ferramenta de conversão apropriada e seguir as melhores práticas, você pode garantir que seus eBooks sejam polidos, profissionais e prontos para distribuição.
Procurando por mais tutoriais de Word de alta qualidade? Confira nossos recursos gratuitos de Word.
Perguntas frequentes sobre Word para EPUB
P1: Qual é a maneira mais fácil de converter documentos do Word para EPUB?
R1: A maneira mais fácil de converter Word para EPUB é usando um conversor online, como Convertio ou Zamzar. No entanto, evite usá-los para documentos sensíveis ou grandes.
P2: Posso converter Word para EPUB gratuitamente?
R2: Sim, você pode converter Word para EPUB gratuitamente usando conversores online ou software de desktop gratuito como o Calibre. Embora as ferramentas online sejam convenientes para conversões rápidas, o Calibre oferece mais controle sobre a formatação e os metadados para uso offline.
P3: Como preservo a formatação ao converter Word para EPUB?
R3: Para preservar a formatação, use ferramentas como o Calibre, que mantêm a estrutura do documento, títulos, tabelas e imagens durante a conversão.
P4: O EPUB é o melhor formato para eBooks?
R4: Sim, o EPUB é o melhor formato para eBooks devido ao seu conteúdo refluxível, ampla compatibilidade com eReaders e suporte para multimídia e recursos interativos.
P5: Como converto em lote vários arquivos do Word para EPUB?
R5: Você pode converter em lote vários arquivos do Word para EPUB usando Python e a biblioteca Spire.Doc for Python. Este método permite processar com eficiência grandes volumes de documentos, economizando tempo e garantindo resultados de conversão consistentes.
Veja também
Word를 EPUB로 변환하는 방법 (3가지 쉬운 방법)
오늘날 디지털 시대에 eBook은 정보, 이야기 및 전문 콘텐츠를 공유하는 가장 인기 있는 방법 중 하나가 되었습니다. Word 문서는 텍스트 초안 작성 및 편집에 적합하지만 e-리더 및 모바일 장치에서 디지털로 읽기에는 이상적이지 않습니다. 콘텐츠에 접근하고, 읽기 쉽고, 시각적으로 매력적으로 만들려면 Word 파일을 EPUB 형식으로 변환하는 것이 작가, 출판사 및 콘텐츠 제작자에게 필수적인 단계입니다.
이 가이드에서는 최대의 가독성과 호환성을 위해 eBook을 최적화하는 팁과 함께 Word를 EPUB으로 변환하는 세 가지 실용적인 방법을 다룹니다.
학습 내용
- EPUB이란 무엇인가
- Word를 EPUB으로 변환해야 하는 이유
- Word를 EPUB으로 변환하는 방법
- Word를 EPUB으로 변환하기 위한 모범 사례
- 결론
- Word를 EPUB으로 변환하는 것에 대한 자주 묻는 질문
EPUB이란 무엇인가
EPUB(전자 출판)은 eBook 출판에 널리 사용되는 개방형 표준 디지털 책 형식입니다. Word 파일과 달리 EPUB은 전문가 수준의 eBook을 위해 특별히 설계되었으며, 콘텐츠를 여러 장치에서 일관되게 구성하고 표시할 수 있는 유연한 구조를 제공합니다.
디지털 출판의 업계 표준인 EPUB은 작가, 출판사 및 교육 기관에서 배포, 유지 관리 및 관리가 쉬운 디지털 책을 만들기 위해 널리 채택되었습니다. 구조화된 형식은 eBook이 전문 출판 요구 사항을 충족하면서 다양한 장치 및 플랫폼에 대해 다용도로 유지되도록 보장합니다.
Word를 EPUB으로 변환해야 하는 이유
Word 파일은 콘텐츠를 만드는 데 일반적으로 사용되지만 여러 장치에 걸쳐 전문적인 eBook 배포를 위해 구조화되어 있지는 않습니다. Word를 EPUB으로 변환하면 다음과 같은 여러 이점이 있습니다.
- 여러 장치에서의 가독성 향상: EPUB은 텍스트 흐름을 조정하여 스마트폰과 같은 작은 화면에서도 콘텐츠를 읽을 수 있도록 합니다.
- 전문적인 프레젠테이션: 제목, 목록, 표, 이미지 및 하이퍼링크가 보존되고 e-리더용으로 형식이 지정됩니다.
- 더 넓은 호환성: EPUB은 Kindle, Nook, Kobo, Apple Books 및 기타 인기 있는 e-리더에서 작동합니다.
- 더 작은 파일 크기: EPUB 파일은 가볍고 온라인으로 배포하기 쉽습니다.
- 접근성: 시각 장애가 있는 독자를 위해 텍스트 음성 변환 및 글꼴 크기 조정과 같은 기능을 지원합니다.
요컨대, Word를 EPUB으로 변환하면 기본 문서가 출판 또는 배포 준비가 된 독자 친화적이고 전문가 수준의 eBook으로 바뀝니다.
Word를 EPUB으로 변환하는 방법
빠른 온라인 변환기에서 데스크톱 소프트웨어 및 자동화된 Python 솔루션에 이르기까지 Word를 EPUB으로 변환하는 데 사용할 수 있는 몇 가지 방법이 있습니다. 아래에서는 각 방법을 자세히 살펴보겠습니다.
방법 1: 온라인 도구를 사용하여 Word를 EPUB으로 변환
온라인 변환 도구는 Word 문서를 EPUB으로 바꾸는 가장 빠르고 쉬운 방법입니다. 일회성 변환, 작은 파일 또는 소프트웨어를 설치하지 않으려는 사용자에게 적합합니다.
Zamzar, Convertio 및 Online-Convert와 같은 웹사이트는 Word를 EPUB으로 변환하는 무료 서비스를 제공합니다. 여기서는 시연을 위해 Convertio를 사용하겠습니다.
온라인에서 Word를 EPUB으로 변환하는 단계:
- Convertio로 이동: Convertio 온라인 Word를 EPUB으로 변환기를 엽니다.
- Word 문서 업로드: "파일 선택" 버튼을 클릭하고 변환하려는 Word 파일(DOCX 또는 DOC)을 선택합니다.
- 출력 형식으로 EPUB 선택: 사용 가능한 출력 형식 목록에서 EPUB을 선택합니다.
- 변환 및 다운로드: "변환"을 클릭하고 도구가 파일을 처리할 때까지 기다립니다. 변환이 완료되면 EPUB 파일을 다운로드할 수 있습니다.
장점:
- 무료이며 사용하기 쉽습니다.
- 소프트웨어 설치가 필요 없습니다.
- 인터넷에 연결된 모든 장치(노트북, 모바일 등)에서 액세스할 수 있습니다.
단점:
- 서식 및 메타데이터에 대한 제한된 제어.
- 대부분의 무료 변환 도구에는 종종 파일 크기 제한이 있습니다.
- 개인 정보 보호 문제로 인해 민감한 콘텐츠에는 적합하지 않습니다.
관심 있을 만한 다른 글: Word를 ODT로 변환: 4가지 쉽고 신뢰할 수 있는 방법
방법 2: 무료 데스크톱 소프트웨어(Calibre)를 사용하여 Word를 EPUB으로 변환
서식 및 오프라인 변환에 대한 더 큰 제어를 위해 데스크톱 소프트웨어가 이상적인 선택입니다. Calibre는 무료 오픈 소스 eBook 관리 도구로, Word 문서를 EPUB으로 변환하는 가장 인기 있는 옵션 중 하나입니다. 다양한 사용자 지정 옵션을 제공하므로 변환 과정에서 서식, 메타데이터 등을 조정해야 하는 사용자에게 다용도 솔루션입니다.
Calibre로 Word를 EPUB으로 변환하는 단계:
-
Calibre 다운로드 및 설치: Calibre 웹사이트를 방문하여 소프트웨어를 다운로드하고 설치합니다.
-
Word 문서 추가: Calibre를 실행하고 "책 추가"를 클릭하여 Word 파일을 가져옵니다.
-
파일 변환: 파일이 추가되면 파일을 선택한 다음 "책 변환"을 클릭하고 출력 형식으로 EPUB을 선택합니다.
-
변환 설정 조정(선택 사항): Calibre를 사용하면 글꼴, 여백 및 메타데이터와 같은 설정을 조정할 수 있습니다. eBook의 모양을 더 많이 제어하고 싶다면 이곳에서 사용자 지정할 수 있습니다.
-
EPUB 파일 저장: "확인"을 클릭하여 변환을 시작합니다. 변환이 끝나면 변환된 EPUB 파일이 원본 Word 파일과 동일한 디렉토리에 저장됩니다.
장점:
- 무료이며 오픈 소스입니다.
- 오프라인으로 작동하며 인터넷 연결이 필요 없습니다.
- eBook 모양 및 메타데이터에 대한 전체 제어를 제공합니다.
단점:
- 초보자를 위한 약간의 학습 곡선.
- 사용자 인터페이스가 처음에는 부담스러워 보일 수 있습니다.
방법 3: Python을 사용하여 Word를 EPUB으로 자동 일괄 변환
여러 Word 문서를 EPUB으로 자주 변환해야 하는 경우 Python 자동화가 효율적인 솔루션입니다. Python 라이브러리를 사용하면 수동 개입 없이 일괄 변환을 쉽게 자동화할 수 있습니다.
Spire.Doc for Python은 이 작업을 위한 인기 있는 라이브러리입니다. 사용자가 Word 문서를 생성, 조작 및 변환하여 EPUB을 포함한 다양한 형식으로 변환할 수 있도록 합니다. 다음과 같은 강력한 기능을 제공합니다.
- 서식 유지: 문서 구조가 그대로 유지되도록 합니다.
- 메타데이터 편집: 작성자, 제목 및 기타 속성을 사용자 지정합니다.
- 일괄 처리: 한 번에 여러 파일을 변환하여 시간과 노력을 절약합니다.
따라서 Spire.Doc은 특히 대량의 문서를 처리하는 기업이나 콘텐츠 게시자에게 Word를 EPUB으로 변환하는 자동화를 위한 이상적인 선택입니다.
Python으로 Word를 EPUB으로 일괄 변환하는 단계:
-
Spire.Doc for Python 설치:
시작하려면 먼저 pip를 사용하여 Spire.Doc for Python 라이브러리를 설치합니다. 다음 명령을 실행합니다:
pip install spire.doc -
Python 스크립트 작성:
라이브러리가 설치되면 변환 프로세스를 자동화하는 Python 스크립트를 만듭니다. 다음은 폴더의 모든 Word DOC 또는 DOCX 파일을 EPUB으로 변환하는 기본 스크립트입니다.
from spire.doc import * import os # 입력 및 출력 디렉토리 정의 input_dir = 'path_to_input_files' output_dir = 'path_to_output_files' # 입력 디렉토리의 모든 Word 파일 목록 가져오기 word_files = [f for f in os.listdir(input_dir) if f.endswith('.docx') or f.endswith('.doc')] # 각 Word 파일 처리 for word_file in word_files: input_file = os.path.join(input_dir, word_file) output_file = os.path.join(output_dir, os.path.splitext(word_file)[0] + '.epub') # Document 객체 생성 doc = Document() # Word 문서 로드 doc.LoadFromFile(input_file) # Word 문서를 EPUB으로 저장 doc.SaveToFile(output_file, FileFormat.EPub) # Document 객체 닫기 doc.Close() print("일괄 변환이 성공적으로 완료되었습니다!") -
Python 스크립트 실행:
스크립트를 저장한 후 터미널 또는 IDE에서 실행합니다. 스크립트는 입력 폴더의 모든 Word 파일을 자동으로 처리하고 출력 폴더에 EPUB 파일로 저장합니다.
참고:
- 이 예제의 input_dir 및 output_dir 변수를 시스템의 적절한 폴더를 가리키도록 수정해야 합니다.
- 변환 중에 표지 이미지를 추가하는 등 EPUB 파일의 모양을 사용자 지정할 수 있습니다. 공식 가이드 참조: Python: Word를 EPUB으로 변환
장점:
- 대량의 문서를 처리하는 데 이상적입니다.
- 스크립트가 설정되면 완전히 자동화되어 시간과 노력을 절약합니다.
- 기존 워크플로 또는 자동화된 게시 시스템에 쉽게 통합할 수 있습니다.
단점:
- 스크립트를 설정하려면 약간의 프로그래밍 지식이 필요합니다.
- 비기술적 사용자를 위한 온라인 변환기나 데스크톱 소프트웨어만큼 사용자 친화적이지 않습니다.
- 초기 설정은 자동화 프로세스를 구성하고 테스트하는 데 시간이 걸릴 수 있습니다.
Word를 EPUB으로 변환하기 위한 모범 사례
Word 문서에서 고품질 EPUB eBook을 만들려면 다음과 같은 필수 모범 사례를 따르십시오.
- Word 스타일 일관성 있게 사용: 제목 스타일, 목록 및 단락을 적용하여 EPUB 파일의 서식을 유지합니다.
- 이미지 최적화: 품질 저하 없이 파일 크기를 줄이기 위해 이미지 크기를 조정하고 압축합니다.
- 메타데이터 포함: 프레젠테이션 및 검색 가능성을 향상시키기 위해 저자, 제목, 언어 및 표지 이미지와 같은 주요 정보를 추가합니다.
- EPUB 파일 유효성 검사: EPUBCheck를 사용하여 파일이 EPUB 표준을 충족하고 여러 장치에서 작동하는지 확인합니다.
- 여러 장치에서 미리보기: 다양한 e-리더, 태블릿 및 스마트폰에서 가독성 및 레이아웃을 확인합니다.
- 서식 단순화: EPUB으로 잘 변환되지 않을 수 있는 복잡한 Word 레이아웃을 피합니다.
이러한 모범 사례를 따르면 Word를 EPUB으로 변환한 결과 모든 장치에 적합한 세련되고 전문적인 eBook이 만들어집니다.
결론
Word를 EPUB으로 변환하는 것은 전문적이고 독자 친화적이며 널리 호환되는 eBook을 만드는 데 중요한 단계입니다. 필요와 기술 전문 지식에 따라 워크플로에 가장 적합한 방법을 선택할 수 있습니다.
- 온라인 변환기: 최소한의 노력으로 빠른 단일 파일 변환에 이상적입니다. 이러한 도구는 개인 프로젝트나 가끔 사용하는 데 적합합니다.
- 데스크톱 소프트웨어(예: Calibre): 서식 및 메타데이터에 대한 정밀한 제어가 필요한 사용자에게 가장 적합합니다. Calibre는 eBook의 모양과 구조를 사용자 지정할 수 있는 강력한 도구입니다.
- Python 자동화: 대규모의 반복 가능한 워크플로를 위한 최상의 옵션입니다. Python은 대량 변환을 효율적으로 자동화해야 하는 콘텐츠 게시자나 팀에 적합합니다.
올바른 방법은 특정 요구 사항, 기술 능력 및 처리해야 하는 문서의 양에 따라 다릅니다. 적절한 변환 도구를 선택하고 모범 사례를 따르면 eBook이 세련되고 전문적이며 배포 준비가 되었는지 확인할 수 있습니다.
더 많은 고품질 Word 튜토리얼을 찾고 계십니까? 무료 Word 리소스를 확인하십시오.
Word를 EPUB으로 변환하는 것에 대한 자주 묻는 질문
Q1: Word 문서를 EPUB으로 변환하는 가장 쉬운 방법은 무엇입니까?
A1: Word를 EPUB으로 변환하는 가장 쉬운 방법은 Convertio 또는 Zamzar와 같은 온라인 변환기를 사용하는 것입니다. 그러나 민감하거나 큰 문서에는 사용하지 마십시오.
Q2: Word를 EPUB으로 무료로 변환할 수 있습니까?
A2: 예, 온라인 변환기나 Calibre와 같은 무료 데스크톱 소프트웨어를 사용하여 Word를 EPUB으로 무료로 변환할 수 있습니다. 온라인 도구는 빠른 변환에 편리하지만 Calibre는 오프라인 사용을 위해 서식 및 메타데이터에 대한 더 많은 제어를 제공합니다.
Q3: Word를 EPUB으로 변환할 때 서식을 어떻게 유지합니까?
A3: 서식을 유지하려면 변환 중에 문서 구조, 제목, 표 및 이미지를 유지하는 Calibre와 같은 도구를 사용하십시오.
Q4: EPUB이 eBook에 가장 적합한 형식입니까?
A4: 예, EPUB은 리플로우 가능한 콘텐츠, e-리더와의 폭넓은 호환성, 멀티미디어 및 대화형 기능 지원으로 인해 eBook에 가장 적합한 형식입니다.
Q5: 여러 Word 파일을 EPUB으로 일괄 변환하려면 어떻게 해야 합니까?
A5: Python 및 Spire.Doc for Python 라이브러리를 사용하여 여러 Word 파일을 EPUB으로 일괄 변환할 수 있습니다. 이 방법을 사용하면 대량의 문서를 효율적으로 처리하여 시간을 절약하고 일관된 변환 결과를 보장할 수 있습니다.
참고 항목
Come convertire Word in EPUB (3 modi semplici)
Nell'era digitale di oggi, gli eBook sono diventati uno dei modi più popolari per condividere informazioni, storie e contenuti professionali. Sebbene i documenti Word siano perfetti per la stesura e la modifica del testo, non sono ideali per la lettura digitale su eReader e dispositivi mobili. Per rendere i tuoi contenuti accessibili, leggibili e visivamente accattivanti, la conversione dei file Word in formato EPUB è un passo necessario per autori, editori e creatori di contenuti.
In questa guida, tratteremo tre modi pratici per convertire da Word a EPUB, insieme a suggerimenti per ottimizzare il tuo eBook per la massima leggibilità e compatibilità.
Cosa imparerai
- Cos'è l'EPUB
- Perché convertire da Word a EPUB
- Come convertire da Word a EPUB
- Migliori pratiche per la conversione da Word a EPUB
- Conclusione
- Domande frequenti sulla conversione da Word a EPUB
Cos'è l'EPUB
EPUB, abbreviazione di Electronic Publication, è un formato di libro digitale open-standard ampiamente utilizzato nell'editoria di eBook. A differenza dei file Word, l'EPUB è progettato specificamente per eBook di qualità professionale, offrendo una struttura flessibile che consente di organizzare e presentare i contenuti in modo coerente su tutti i dispositivi.
Essendo lo standard del settore per l'editoria digitale, l'EPUB è ampiamente adottato da autori, editori e istituzioni educative per creare libri digitali facili da distribuire, mantenere e gestire. Il suo formato strutturato garantisce che gli eBook soddisfino i requisiti di pubblicazione professionali pur rimanendo versatili per una vasta gamma di dispositivi e piattaforme.
Perché convertire da Word a EPUB
Sebbene i file Word siano comunemente usati per creare contenuti, non sono strutturati per la distribuzione professionale di eBook su più dispositivi. La conversione da Word a EPUB offre molteplici vantaggi:
- Migliore leggibilità su tutti i dispositivi: l'EPUB regola il flusso del testo, rendendo i tuoi contenuti leggibili su schermi piccoli come quelli degli smartphone.
- Presentazione professionale: intestazioni, elenchi, tabelle, immagini e collegamenti ipertestuali vengono conservati e formattati per gli eReader.
- Compatibilità più ampia: l'EPUB funziona su Kindle, Nook, Kobo, Apple Books e altri eReader popolari.
- Dimensioni del file più piccole: i file EPUB sono leggeri e più facili da distribuire online.
- Accessibilità: supporta funzionalità come la sintesi vocale e il ridimensionamento dei caratteri per i lettori con disabilità visive.
In breve, la conversione da Word a EPUB trasforma un documento di base in un eBook di qualità professionale e di facile lettura, pronto per la pubblicazione o la distribuzione.
Come convertire da Word a EPUB
Esistono diversi metodi che puoi utilizzare per convertire da Word a EPUB, che vanno dai convertitori online veloci al software desktop e alle soluzioni Python automatizzate. Di seguito, esploreremo ogni metodo in dettaglio.
Metodo 1: Convertire da Word a EPUB utilizzando strumenti online
Gli strumenti di conversione online sono il modo più veloce e semplice per trasformare i documenti Word in EPUB. Sono perfetti per conversioni una tantum, file di piccole dimensioni o utenti che preferiscono non installare software.
Siti web come Zamzar, Convertio e Online-Convert offrono servizi gratuiti per convertire da Word a EPUB. Qui, useremo Convertio per la dimostrazione.
Passaggi per convertire da Word a EPUB online:
- Vai su Convertio: apri il convertitore online da Word a EPUB di Convertio.
- Carica il tuo documento Word: fai clic sul pulsante "Scegli file" e seleziona il file Word (DOCX o DOC) che desideri convertire.
- Seleziona EPUB come formato di output: scegli EPUB dall'elenco dei formati di output disponibili.
- Converti e scarica: fai clic su "Converti" e attendi che lo strumento elabori il tuo file. Una volta completata la conversione, puoi scaricare il file EPUB.
Pro:
- Gratuito e facile da usare.
- Nessuna installazione di software richiesta.
- Accessibile da qualsiasi dispositivo (laptop, cellulari e altro) con una connessione Internet.
Contro:
- Controllo limitato sulla formattazione e sui metadati.
- La maggior parte degli strumenti di conversione gratuiti ha spesso restrizioni sulle dimensioni dei file.
- Non ideale per contenuti sensibili a causa di problemi di privacy.
Potrebbe piacerti anche: Convertire da Word a ODT: 4 metodi facili e affidabili
Metodo 2: Convertire da Word a EPUB utilizzando software desktop gratuito (Calibre)
Per un maggiore controllo sulla formattazione e la conversione offline, il software desktop è la scelta ideale. Calibre, uno strumento di gestione di eBook gratuito e open source, è una delle opzioni più popolari per la conversione di documenti Word in EPUB. Offre una vasta gamma di opzioni di personalizzazione, rendendolo una soluzione versatile per gli utenti che necessitano di regolare la formattazione, i metadati e altro durante il processo di conversione.
Passaggi per convertire da Word a EPUB con Calibre:
-
Scarica e installa Calibre: visita il sito web di Calibre per scaricare e installare il software.
-
Aggiungi il tuo documento Word: avvia Calibre e fai clic su "Aggiungi libri" per importare il tuo file Word.
-
Converti il file: una volta aggiunto il file, selezionalo, quindi fai clic su "Converti libri" e scegli EPUB come formato di output.
-
Regola le impostazioni di conversione (opzionale): Calibre ti consente di modificare impostazioni come caratteri, margini e metadati. Se stai cercando un maggiore controllo sull'aspetto del tuo eBook, questo è un ottimo posto per personalizzare.
-
Salva il file EPUB: fai clic su "OK" per avviare la conversione. Una volta terminato, il file EPUB convertito verrà salvato nella stessa directory del file Word originale.
Pro:
- Gratuito e open-source.
- Funziona offline, non è richiesta alcuna connessione a Internet.
- Fornisce il pieno controllo sull'aspetto e sui metadati dell'eBook.
Contro:
- Leggera curva di apprendimento per i principianti.
- L'interfaccia utente potrebbe sembrare opprimente all'inizio.
Metodo 3: Conversione batch automatica da Word a EPUB con Python
Se hai bisogno di convertire frequentemente più documenti Word in EPUB, l'automazione Python è una soluzione efficiente. Con le librerie Python, puoi facilmente automatizzare le conversioni batch senza la necessità di un intervento manuale.
Spire.Doc for Python è una libreria popolare per questo compito. Consente agli utenti di creare, manipolare e convertire documenti Word in vari formati, incluso EPUB. Offre funzionalità robuste come:
- Mantenimento della formattazione: assicura che la struttura del documento rimanga intatta.
- Modifica dei metadati: personalizza autore, titolo e altre proprietà.
- Elaborazione batch: converti più file contemporaneamente, risparmiando tempo e fatica.
Questo rende Spire.Doc una scelta ideale per automatizzare la conversione da Word a EPUB, specialmente per le aziende o gli editori di contenuti che gestiscono grandi volumi di documenti.
Passaggi per la conversione batch da Word a EPUB con Python:
-
Installa Spire.Doc for Python:
Per iniziare, installa prima la libreria Spire.Doc for Python usando pip. Esegui il seguente comando:
pip install spire.doc -
Scrivi lo script Python:
Una volta installata la libreria, crea uno script Python per automatizzare il processo di conversione. Ecco lo script di base per convertire tutti i file Word DOC o DOCX in una cartella in EPUB:
from spire.doc import * import os # Definisci le directory di input e output input_dir = 'percorso_dei_file_di_input' output_dir = 'percorso_dei_file_di_output' # Ottieni un elenco di tutti i file Word nella directory di input word_files = [f for f in os.listdir(input_dir) if f.endswith('.docx') or f.endswith('.doc')] # Elabora ogni file Word for word_file in word_files: input_file = os.path.join(input_dir, word_file) output_file = os.path.join(output_dir, os.path.splitext(word_file)[0] + '.epub') # Crea un oggetto Document doc = Document() # Carica il documento Word doc.LoadFromFile(input_file) # Salva il documento Word come EPUB doc.SaveToFile(output_file, FileFormat.EPub) # Chiudi l'oggetto Document doc.Close() print("Conversione batch completata con successo!") -
Esegui lo script Python:
Dopo aver salvato lo script, eseguilo dal tuo terminale o IDE. Lo script elaborerà automaticamente tutti i file Word nella cartella di input e li salverà come file EPUB nella cartella di output.
Note:
- È necessario modificare le variabili input_dir e output_dir in questo esempio per puntare alle cartelle appropriate sul proprio sistema.
- È possibile personalizzare l'aspetto del file EPUB durante la conversione, ad esempio aggiungendo un'immagine di copertina. Fare riferimento alla guida ufficiale: Python: Convertire da Word a EPUB
Pro:
- Ideale per la gestione di grandi volumi di documenti.
- Completamente automatizzato una volta impostato lo script, risparmiando tempo e fatica.
- Può essere facilmente integrato nei flussi di lavoro esistenti o nei sistemi di pubblicazione automatizzati.
Contro:
- Richiede alcune conoscenze di programmazione per impostare lo script.
- Non è facile da usare come i convertitori online o il software desktop per gli utenti non tecnici.
- La configurazione iniziale potrebbe richiedere tempo per configurare e testare il processo di automazione.
Migliori pratiche per la conversione da Word a EPUB
Per creare eBook EPUB di alta qualità da documenti Word, segui queste pratiche essenziali:
- Usa gli stili di Word in modo coerente: applica stili di intestazione, elenchi e paragrafi per preservare la formattazione nel file EPUB.
- Ottimizza le immagini: ridimensiona e comprimi le immagini per ridurre le dimensioni del file senza sacrificare la qualità.
- Includi metadati: aggiungi informazioni chiave come autore, titolo, lingua e immagine di copertina per migliorare la presentazione e la reperibilità.
- Convalida i file EPUB: usa EPUBCheck per assicurarti che il tuo file soddisfi gli standard EPUB e funzioni su tutti i dispositivi.
- Anteprima su più dispositivi: controlla la leggibilità e il layout su vari eReader, tablet e smartphone.
- Mantieni la formattazione semplice: evita layout di Word complessi che potrebbero non convertirsi bene in EPUB.
Seguendo queste migliori pratiche, ti assicurerai che la tua conversione da Word a EPUB si traduca in un eBook raffinato e professionale pronto per qualsiasi dispositivo.
Conclusione
La conversione da Word a EPUB è un passo cruciale nella creazione di eBook professionali, di facile lettura e ampiamente compatibili. A seconda delle tue esigenze e competenze tecniche, puoi scegliere il metodo che meglio si adatta al tuo flusso di lavoro.
- Convertitori online: ideali per conversioni rapide di singoli file con il minimo sforzo. Questi strumenti sono perfetti per progetti personali o per un uso occasionale.
- Software desktop (ad es. Calibre): più adatto per gli utenti che necessitano di un controllo preciso sulla formattazione e sui metadati. Calibre è un potente strumento che ti consente di personalizzare l'aspetto e la struttura del tuo eBook.
- Automazione Python: l'opzione migliore per flussi di lavoro su larga scala e ripetibili. Python è perfetto per editori di contenuti o team che necessitano di automatizzare in modo efficiente le conversioni di massa.
Il metodo giusto dipende dalle tue esigenze specifiche, dalle tue competenze tecniche e dal volume di documenti che devi elaborare. Scegliendo lo strumento di conversione appropriato e seguendo le migliori pratiche, puoi assicurarti che i tuoi eBook siano raffinati, professionali e pronti per la distribuzione.
Cerchi altri tutorial di Word di alta qualità? Dai un'occhiata alle nostre risorse gratuite su Word.
Domande frequenti sulla conversione da Word a EPUB
D1: Qual è il modo più semplice per convertire documenti Word in EPUB?
R1: Il modo più semplice per convertire da Word a EPUB è utilizzare un convertitore online, come Convertio o Zamzar. Tuttavia, evita di usarli per documenti sensibili o di grandi dimensioni.
D2: Posso convertire da Word a EPUB gratuitamente?
R2: Sì, puoi convertire da Word a EPUB gratuitamente utilizzando convertitori online o software desktop gratuito come Calibre. Sebbene gli strumenti online siano convenienti per conversioni rapide, Calibre offre un maggiore controllo sulla formattazione e sui metadati per l'uso offline.
D3: Come posso preservare la formattazione durante la conversione da Word a EPUB?
R3: Per preservare la formattazione, utilizza strumenti come Calibre, che mantengono la struttura del documento, le intestazioni, le tabelle e le immagini durante la conversione.
D4: L'EPUB è il formato migliore per gli eBook?
R4: Sì, l'EPUB è il formato migliore per gli eBook grazie al suo contenuto ridisponibile, all'ampia compatibilità con gli eReader e al supporto per funzionalità multimediali e interattive.
D5: Come posso convertire in batch più file Word in EPUB?
R5: Puoi convertire in batch più file Word in EPUB usando Python e la libreria Spire.Doc for Python. Questo metodo ti consente di elaborare in modo efficiente grandi volumi di documenti, risparmiando tempo e garantendo risultati di conversione coerenti.
Vedi anche
Comment convertir Word en EPUB (3 méthodes faciles)
À l'ère numérique d'aujourd'hui, les livres électroniques sont devenus l'un des moyens les plus populaires de partager des informations, des histoires et du contenu professionnel. Bien que les documents Word soient parfaits pour la rédaction et l'édition de texte, ils ne sont pas idéaux pour la lecture numérique sur les liseuses et les appareils mobiles. Pour rendre votre contenu accessible, lisible et visuellement attrayant, la conversion de fichiers Word au format EPUB est une étape nécessaire pour les auteurs, les éditeurs et les créateurs de contenu.
Dans ce guide, nous aborderons trois manières pratiques de convertir Word en EPUB, ainsi que des conseils pour optimiser votre livre électronique pour une lisibilité et une compatibilité maximales.
Ce que vous apprendrez
- Qu'est-ce que l'EPUB
- Pourquoi convertir Word en EPUB
- Comment convertir Word en EPUB
- Meilleures pratiques pour la conversion de Word en EPUB
- Conclusion
- Foire aux questions sur Word en EPUB
Qu'est-ce que l'EPUB
EPUB, abréviation de Publication Électronique, est un format de livre numérique standard ouvert largement utilisé dans l'édition de livres électroniques. Contrairement aux fichiers Word, l'EPUB est conçu spécifiquement pour les livres électroniques de qualité professionnelle, offrant une structure flexible qui permet d'organiser et de présenter le contenu de manière cohérente sur tous les appareils.
En tant que norme de l'industrie pour l'édition numérique, l'EPUB est largement adopté par les auteurs, les éditeurs et les établissements d'enseignement pour créer des livres numériques faciles à distribuer, à entretenir et à gérer. Son format structuré garantit que les livres électroniques répondent aux exigences de l'édition professionnelle tout en restant polyvalents pour une gamme d'appareils et de plateformes.
Pourquoi convertir Word en EPUB
Bien que les fichiers Word soient couramment utilisés pour créer du contenu, ils ne sont pas structurés pour une distribution professionnelle de livres électroniques sur plusieurs appareils. La conversion de Word en EPUB offre de multiples avantages :
- Lisibilité améliorée sur tous les appareils : L'EPUB ajuste le flux de texte, rendant votre contenu lisible sur de petits écrans comme les smartphones.
- Présentation professionnelle : Les titres, listes, tableaux, images et hyperliens sont conservés et formatés pour les liseuses.
- Compatibilité plus large : L'EPUB fonctionne sur Kindle, Nook, Kobo, Apple Books et d'autres liseuses populaires.
- Taille de fichier plus petite : Les fichiers EPUB sont légers et plus faciles à distribuer en ligne.
- Accessibilité : Prend en charge des fonctionnalités telles que la synthèse vocale et le redimensionnement de la police pour les lecteurs malvoyants.
En bref, la conversion de Word en EPUB transforme un document de base en un livre électronique convivial et de qualité professionnelle, prêt à être publié ou distribué.
Comment convertir Word en EPUB
Il existe plusieurs méthodes que vous pouvez utiliser pour convertir Word en EPUB, allant des convertisseurs en ligne rapides aux logiciels de bureau et aux solutions Python automatisées. Ci-dessous, nous explorerons chaque méthode en détail.
Méthode 1 : Convertir Word en EPUB à l'aide d'outils en ligne
Les outils de conversion en ligne sont le moyen le plus rapide et le plus simple de transformer des documents Word en EPUB. Ils sont parfaits pour les conversions uniques, les petits fichiers ou les utilisateurs qui préfèrent ne pas installer de logiciel.
Des sites Web comme Zamzar, Convertio et Online-Convert offrent des services gratuits pour convertir Word en EPUB. Ici, nous utiliserons Convertio pour la démonstration.
Étapes pour convertir Word en EPUB en ligne :
- Allez sur Convertio : Ouvrez le convertisseur en ligne Word vers EPUB de Convertio.
- Téléchargez votre document Word : Cliquez sur le bouton "Choisir les fichiers" et sélectionnez le fichier Word (DOCX ou DOC) que vous souhaitez convertir.
- Sélectionnez EPUB comme format de sortie : Choisissez EPUB dans la liste des formats de sortie disponibles.
- Convertir et télécharger : Cliquez sur "Convertir" et attendez que l'outil traite votre fichier. Une fois la conversion terminée, vous pouvez télécharger le fichier EPUB.
Avantages :
- Gratuit et facile à utiliser.
- Aucune installation de logiciel requise.
- Accessible depuis n'importe quel appareil (ordinateurs portables, mobiles et plus) avec une connexion Internet.
Inconvénients :
- Contrôle limité sur le formatage et les métadonnées.
- La plupart des outils de conversion gratuits ont souvent des restrictions de taille de fichier.
- Non idéal pour le contenu sensible en raison de problèmes de confidentialité.
Vous aimerez peut-être aussi : Convertir Word en ODT : 4 méthodes simples et fiables
Méthode 2 : Convertir Word en EPUB à l'aide d'un logiciel de bureau gratuit (Calibre)
Pour un meilleur contrôle sur le formatage et la conversion hors ligne, un logiciel de bureau est le choix idéal. Calibre, un outil de gestion de livres électroniques gratuit et open-source, est l'une des options les plus populaires pour convertir des documents Word en EPUB. Il offre un large éventail d'options de personnalisation, ce qui en fait une solution polyvalente pour les utilisateurs qui ont besoin d'ajuster le formatage, les métadonnées, etc. pendant le processus de conversion.
Étapes pour convertir Word en EPUB avec Calibre :
-
Téléchargez et installez Calibre : Visitez le site Web de Calibre pour télécharger et installer le logiciel.
-
Ajoutez votre document Word : Lancez Calibre et cliquez sur "Ajouter des livres" pour importer votre fichier Word.
-
Convertir le fichier : Une fois votre fichier ajouté, sélectionnez-le, puis cliquez sur "Convertir des livres" et choisissez EPUB comme format de sortie.
-
Ajuster les paramètres de conversion (facultatif) : Calibre vous permet de modifier des paramètres tels que les polices, les marges et les métadonnées. Si vous recherchez plus de contrôle sur l'apparence de votre livre électronique, c'est un excellent endroit pour personnaliser.
-
Enregistrez le fichier EPUB : Cliquez sur "OK" pour démarrer la conversion. Une fois terminée, le fichier EPUB converti sera enregistré dans le même répertoire que votre fichier Word d'origine.
Avantages :
- Gratuit et open-source.
- Fonctionne hors ligne, aucune connexion Internet requise.
- Fournit un contrôle total sur l'apparence et les métadonnées du livre électronique.
Inconvénients :
- Légère courbe d'apprentissage pour les débutants.
- L'interface utilisateur peut sembler écrasante au début.
Méthode 3 : Convertir par lots Word en EPUB automatiquement avec Python
Si vous avez besoin de convertir fréquemment plusieurs documents Word en EPUB, l'automatisation Python est une solution efficace. Avec les bibliothèques Python, vous pouvez facilement automatiser les conversions par lots sans avoir besoin d'une intervention manuelle.
Spire.Doc for Python est une bibliothèque populaire pour cette tâche. Elle permet aux utilisateurs de créer, manipuler et convertir des documents Word dans divers formats, y compris EPUB. Elle offre des fonctionnalités robustes telles que :
- Conservation du formatage : garantit que la structure de votre document reste intacte.
- Édition des métadonnées : personnalisez l'auteur, le titre et d'autres propriétés.
- Traitement par lots : convertissez plusieurs fichiers à la fois, ce qui vous fait gagner du temps et des efforts.
Cela fait de Spire.Doc un choix idéal pour automatiser la conversion de Word en EPUB, en particulier pour les entreprises ou les éditeurs de contenu qui gèrent de gros volumes de documents.
Étapes pour convertir par lots Word en EPUB avec Python :
-
Installez Spire.Doc for Python :
Pour commencer, installez d'abord la bibliothèque Spire.Doc for Python à l'aide de pip. Exécutez la commande suivante :
pip install spire.doc -
Écrivez le script Python :
Une fois la bibliothèque installée, créez un script Python pour automatiser le processus de conversion. Voici le script de base pour convertir tous les fichiers Word DOC ou DOCX d'un dossier en EPUB :
from spire.doc import * import os # Define the input and output directories input_dir = 'path_to_input_files' output_dir = 'path_to_output_files' # Get a list of all Word files in the input directory word_files = [f for f in os.listdir(input_dir) if f.endswith('.docx') or f.endswith('.doc')] # Process each Word file for word_file in word_files: input_file = os.path.join(input_dir, word_file) output_file = os.path.join(output_dir, os.path.splitext(word_file)[0] + '.epub') # Create a Document object doc = Document() # Load the Word document doc.LoadFromFile(input_file) # Save the Word document as EPUB doc.SaveToFile(output_file, FileFormat.EPub) # Close the Document object doc.Close() print("Batch conversion completed successfully!") -
Exécutez le script Python :
Après avoir enregistré le script, exécutez-le depuis votre terminal ou votre IDE. Le script traitera automatiquement tous les fichiers Word du dossier d'entrée et les enregistrera en tant que fichiers EPUB dans le dossier de sortie.
Remarques :
- Vous devez modifier les variables input_dir et output_dir dans cet exemple pour qu'elles pointent vers les dossiers appropriés sur votre système.
- Vous pouvez personnaliser l'apparence du fichier EPUB pendant la conversion, par exemple en y ajoutant une image de couverture. Reportez-vous au guide officiel : Python : Convertir Word en EPUB
Avantages :
- Idéal pour gérer de gros volumes de documents.
- Entièrement automatisé une fois le script configuré, ce qui permet d'économiser du temps et des efforts.
- Peut être facilement intégré dans les flux de travail existants ou les systèmes de publication automatisés.
Inconvénients :
- Nécessite quelques connaissances en programmation pour configurer le script.
- Pas aussi convivial que les convertisseurs en ligne ou les logiciels de bureau pour les utilisateurs non techniques.
- La configuration initiale peut prendre du temps pour configurer et tester le processus d'automatisation.
Meilleures pratiques pour la conversion de Word en EPUB
Pour créer des livres électroniques EPUB de haute qualité à partir de documents Word, suivez ces meilleures pratiques essentielles :
- Utilisez les styles Word de manière cohérente : appliquez des styles de titre, des listes et des paragraphes pour préserver le formatage dans le fichier EPUB.
- Optimisez les images : redimensionnez et compressez les images pour réduire la taille du fichier sans sacrifier la qualité.
- Incluez des métadonnées : ajoutez des informations clés telles que l'auteur, le titre, la langue et l'image de couverture pour améliorer la présentation et la découvrabilité.
- Validez les fichiers EPUB : utilisez EPUBCheck pour vous assurer que votre fichier respecte les normes EPUB et fonctionne sur tous les appareils.
- Prévisualisez sur plusieurs appareils : vérifiez la lisibilité et la mise en page sur diverses liseuses, tablettes et smartphones.
- Gardez un formatage simple : évitez les mises en page Word complexes qui pourraient ne pas bien se convertir en EPUB.
En suivant ces meilleures pratiques, vous vous assurerez que votre conversion de Word en EPUB aboutit à un livre électronique soigné et professionnel, prêt pour n'importe quel appareil.
Conclusion
La conversion de Word en EPUB est une étape cruciale dans la création de livres électroniques professionnels, conviviaux et largement compatibles. En fonction de vos besoins et de votre expertise technique, vous pouvez choisir la méthode qui convient le mieux à votre flux de travail.
- Convertisseurs en ligne : Idéal pour les conversions rapides de fichiers uniques avec un minimum d'effort. Ces outils sont parfaits pour les projets personnels ou une utilisation occasionnelle.
- Logiciels de bureau (par exemple, Calibre) : Idéal pour les utilisateurs qui ont besoin d'un contrôle précis sur le formatage et les métadonnées. Calibre est un outil puissant qui vous permet de personnaliser l'apparence et la structure de votre livre électronique.
- Automatisation Python : La meilleure option pour les flux de travail répétables à grande échelle. Python est parfait pour les éditeurs de contenu ou les équipes qui ont besoin d'automatiser efficacement les conversions en masse.
La bonne méthode dépend de vos besoins spécifiques, de vos compétences techniques et du volume de documents que vous devez traiter. En choisissant l'outil de conversion approprié et en suivant les meilleures pratiques, vous pouvez vous assurer que vos livres électroniques sont soignés, professionnels et prêts à être distribués.
Vous cherchez d'autres tutoriels Word de haute qualité ? Consultez nos ressources Word gratuites.
Foire aux questions sur Word en EPUB
Q1 : Quel est le moyen le plus simple de convertir des documents Word en EPUB ?
R1 : Le moyen le plus simple de convertir Word en EPUB est d'utiliser un convertisseur en ligne, tel que Convertio ou Zamzar. Cependant, évitez de les utiliser pour des documents sensibles ou volumineux.
Q2 : Puis-je convertir Word en EPUB gratuitement ?
R2 : Oui, vous pouvez convertir Word en EPUB gratuitement à l'aide de convertisseurs en ligne ou de logiciels de bureau gratuits comme Calibre. Bien que les outils en ligne soient pratiques pour des conversions rapides, Calibre offre plus de contrôle sur le formatage et les métadonnées pour une utilisation hors ligne.
Q3 : Comment préserver le formatage lors de la conversion de Word en EPUB ?
R3 : Pour préserver le formatage, utilisez des outils comme Calibre, qui conservent la structure du document, les titres, les tableaux et les images pendant la conversion.
Q4 : L'EPUB est-il le meilleur format pour les livres électroniques ?
R4 : Oui, l'EPUB est le meilleur format pour les livres électroniques en raison de son contenu redistribuable, de sa large compatibilité avec les liseuses et de sa prise en charge des fonctionnalités multimédias et interactives.
Q5 : Comment convertir par lots plusieurs fichiers Word en EPUB ?
R5 : Vous pouvez convertir par lots plusieurs fichiers Word en EPUB à l'aide de Python et de la bibliothèque Spire.Doc for Python. Cette méthode vous permet de traiter efficacement de gros volumes de documents, ce qui vous fait gagner du temps et garantit des résultats de conversion cohérents.
Voir aussi
Cómo convertir Word a EPUB (3 formas fáciles)
Tabla de Contenidos
En la era digital actual, los eBooks se han convertido en una de las formas más populares de compartir información, historias y contenido profesional. Aunque los documentos de Word son perfectos para redactar y editar texto, no son ideales para la lectura digital en eReaders y dispositivos móviles. Para que su contenido sea accesible, legible y visualmente atractivo, convertir archivos de Word al formato EPUB es un paso necesario para autores, editores y creadores de contenido.
En esta guía, cubriremos tres formas prácticas de convertir de Word a EPUB, junto con consejos para optimizar su eBook para una máxima legibilidad y compatibilidad.
Lo que aprenderá
- Qué es EPUB
- Por qué convertir de Word a EPUB
- Cómo convertir de Word a EPUB
- Mejores prácticas para la conversión de Word a EPUB
- Conclusión
- Preguntas frecuentes sobre Word a EPUB
Qué es EPUB
EPUB, abreviatura de Publicación Electrónica, es un formato de libro digital de estándar abierto ampliamente utilizado en la publicación de eBooks. A diferencia de los archivos de Word, EPUB está diseñado específicamente para eBooks de calidad profesional, ofreciendo una estructura flexible que permite que el contenido se organice y presente de manera consistente en todos los dispositivos.
Como el estándar de la industria para la publicación digital, EPUB es ampliamente adoptado por autores, editores e instituciones educativas para crear libros digitales que son fáciles de distribuir, mantener y gestionar. Su formato estructurado asegura que los eBooks cumplan con los requisitos de publicación profesional mientras se mantienen versátiles para una variedad de dispositivos y plataformas.
Por qué convertir de Word a EPUB
Aunque los archivos de Word se usan comúnmente para crear contenido, no están estructurados para la distribución profesional de eBooks en múltiples dispositivos. Convertir de Word a EPUB ofrece múltiples beneficios:
- Legibilidad mejorada en todos los dispositivos: EPUB ajusta el flujo del texto, haciendo que su contenido sea legible en pantallas pequeñas como las de los teléfonos inteligentes.
- Presentación profesional: Los encabezados, listas, tablas, imágenes e hipervínculos se conservan y formatean para los eReaders.
- Compatibilidad más amplia: EPUB funciona en Kindle, Nook, Kobo, Apple Books y otros eReaders populares.
- Tamaño de archivo más pequeño: Los archivos EPUB son ligeros y más fáciles de distribuir en línea.
- Accesibilidad: Admite funciones como texto a voz y ajuste del tamaño de la fuente para lectores con discapacidades visuales.
En resumen, convertir de Word a EPUB transforma un documento básico en un eBook fácil de leer y de calidad profesional, listo para su publicación o distribución.
Cómo convertir de Word a EPUB
Existen varios métodos que puede utilizar para convertir de Word a EPUB, desde convertidores en línea rápidos hasta software de escritorio y soluciones automatizadas con Python. A continuación, exploraremos cada método en detalle.
Método 1: Convertir de Word a EPUB usando herramientas en línea
Las herramientas de conversión en línea son la forma más rápida y sencilla de convertir documentos de Word a EPUB. Son perfectas para conversiones únicas, archivos pequeños o usuarios que prefieren no instalar software.
Sitios web como Zamzar, Convertio y Online-Convert ofrecen servicios gratuitos para convertir de Word a EPUB. Aquí, usaremos Convertio para la demostración.
Pasos para convertir de Word a EPUB en línea:
- Vaya a Convertio: Abra el Convertidor en línea de Word a EPUB de Convertio.
- Suba su documento de Word: Haga clic en el botón "Elegir archivos" y seleccione el archivo de Word (DOCX o DOC) que desea convertir.
- Seleccione EPUB como formato de salida: Elija EPUB de la lista de formatos de salida disponibles.
- Convertir y descargar: Haga clic en "Convertir" y espere a que la herramienta procese su archivo. Una vez que la conversión esté completa, puede descargar el archivo EPUB.
Ventajas:
- Gratis y fácil de usar.
- No requiere instalación de software.
- Accesible desde cualquier dispositivo (portátiles, móviles y más) con conexión a internet.
Desventajas:
- Control limitado sobre el formato y los metadatos.
- La mayoría de las herramientas de conversión gratuitas suelen tener restricciones de tamaño de archivo.
- No es ideal para contenido sensible debido a preocupaciones de privacidad.
También le puede interesar: Convertir de Word a ODT: 4 métodos fáciles y fiables
Método 2: Convertir de Word a EPUB usando software de escritorio gratuito (Calibre)
Para un mayor control sobre el formato y la conversión sin conexión, el software de escritorio es la opción ideal. Calibre, una herramienta de gestión de eBooks gratuita y de código abierto, es una de las opciones más populares para convertir documentos de Word a EPUB. Ofrece una amplia gama de opciones de personalización, lo que la convierte en una solución versátil para los usuarios que necesitan ajustar el formato, los metadatos y más durante el proceso de conversión.
Pasos para convertir de Word a EPUB con Calibre:
-
Descargue e instale Calibre: Visite el sitio web de Calibre para descargar e instalar el software.
-
Añada su documento de Word: Inicie Calibre y haga clic en "Añadir libros" para importar su archivo de Word.
-
Convierta el archivo: Una vez que se haya añadido su archivo, selecciónelo, luego haga clic en "Convertir libros" y elija EPUB como formato de salida.
-
Ajuste la configuración de conversión (Opcional): Calibre le permite ajustar configuraciones como fuentes, márgenes y metadatos. Si busca más control sobre la apariencia de su eBook, este es un excelente lugar para personalizar.
-
Guarde el archivo EPUB: Haga clic en "Aceptar" para iniciar la conversión. Una vez que haya terminado, el archivo EPUB convertido se guardará en el mismo directorio que su archivo de Word original.
Ventajas:
- Gratuito y de código abierto.
- Funciona sin conexión, no se requiere conexión a internet.
- Proporciona control total sobre la apariencia y los metadatos del eBook.
Desventajas:
- Ligera curva de aprendizaje para principiantes.
- La interfaz de usuario puede parecer abrumadora al principio.
Método 3: Convertir por lotes de Word a EPUB automáticamente con Python
Si necesita convertir con frecuencia múltiples documentos de Word a EPUB, la automatización con Python es una solución eficiente. Con las bibliotecas de Python, puede automatizar fácilmente las conversiones por lotes sin necesidad de intervención manual.
Spire.Doc for Python es una biblioteca popular para esta tarea. Permite a los usuarios crear, manipular y convertir documentos de Word a varios formatos, incluido EPUB. Ofrece características robustas como:
- Retención de formato: Asegura que la estructura de su documento permanezca intacta.
- Edición de metadatos: Personalice el autor, el título y otras propiedades.
- Procesamiento por lotes: Convierta múltiples archivos a la vez, ahorrando tiempo y esfuerzo.
Esto convierte a Spire.Doc en una opción ideal para automatizar la conversión de Word a EPUB, especialmente para empresas o editores de contenido que manejan grandes volúmenes de documentos.
Pasos para convertir por lotes de Word a EPUB con Python:
-
Instale Spire.Doc for Python:
Para comenzar, primero instale la biblioteca Spire.Doc for Python usando pip. Ejecute el siguiente comando:
pip install spire.doc -
Escriba el script de Python:
Una vez instalada la biblioteca, cree un script de Python para automatizar el proceso de conversión. Aquí está el script básico para convertir todos los archivos DOC o DOCX de Word en una carpeta a EPUB:
from spire.doc import * import os # Define las directorios de entrada y salida input_dir = 'ruta_a_los_archivos_de_entrada' output_dir = 'ruta_a_los_archivos_de_salida' # Obtiene una lista de todos los archivos de Word en el directorio de entrada word_files = [f for f in os.listdir(input_dir) if f.endswith('.docx') or f.endswith('.doc')] # Procesa cada archivo de Word for word_file in word_files: input_file = os.path.join(input_dir, word_file) output_file = os.path.join(output_dir, os.path.splitext(word_file)[0] + '.epub') # Crea un objeto Document doc = Document() # Carga el documento de Word doc.LoadFromFile(input_file) # Guarda el documento de Word como EPUB doc.SaveToFile(output_file, FileFormat.EPub) # Cierra el objeto Document doc.Close() print("¡La conversión por lotes se completó con éxito!") -
Ejecute el script de Python:
Después de guardar el script, ejecútelo desde su terminal o IDE. El script procesará automáticamente todos los archivos de Word en la carpeta de entrada y los guardará como archivos EPUB en la carpeta de salida.
Notas:
- Debe modificar las variables input_dir y output_dir en este ejemplo para que apunten a las carpetas apropiadas en su sistema.
- Puede personalizar la apariencia del archivo EPUB durante la conversión, como agregarle una imagen de portada. Consulte la guía oficial: Python: Convertir de Word a EPUB
Ventajas:
- Ideal para manejar grandes volúmenes de documentos.
- Totalmente automatizado una vez que se configura el script, ahorrando tiempo y esfuerzo.
- Se puede integrar fácilmente en flujos de trabajo existentes o sistemas de publicación automatizados.
Desventajas:
- Requiere algunos conocimientos de programación para configurar el script.
- No es tan fácil de usar como los convertidores en línea o el software de escritorio para usuarios no técnicos.
- La configuración inicial puede llevar tiempo para configurar y probar el proceso de automatización.
Mejores prácticas para la conversión de Word a EPUB
Para crear eBooks EPUB de alta calidad a partir de documentos de Word, siga estas mejores prácticas esenciales:
- Use los estilos de Word de manera consistente: Aplique estilos de encabezado, listas y párrafos para preservar el formato en el archivo EPUB.
- Optimice las imágenes: Redimensione y comprima las imágenes para reducir el tamaño del archivo sin sacrificar la calidad.
- Incluya metadatos: Agregue información clave como autor, título, idioma e imagen de portada para mejorar la presentación y la visibilidad.
- Valide los archivos EPUB: Use EPUBCheck para asegurarse de que su archivo cumpla con los estándares EPUB y funcione en todos los dispositivos.
- Previsualice en múltiples dispositivos: Verifique la legibilidad y el diseño en varios eReaders, tabletas y teléfonos inteligentes.
- Mantenga el formato simple: Evite diseños complejos de Word que pueden no convertirse bien a EPUB.
Al seguir estas mejores prácticas, se asegurará de que la conversión de Word a EPUB resulte en un eBook pulido y profesional, listo para cualquier dispositivo.
Conclusión
Convertir de Word a EPUB es un paso crucial para crear eBooks profesionales, fáciles de leer y ampliamente compatibles. Dependiendo de sus necesidades y experiencia técnica, puede elegir el método que mejor se adapte a su flujo de trabajo.
- Convertidores en línea: Ideales para conversiones rápidas de un solo archivo con un esfuerzo mínimo. Estas herramientas son perfectas para proyectos personales o uso ocasional.
- Software de escritorio (p. ej., Calibre): Más adecuado para usuarios que necesitan un control preciso sobre el formato y los metadatos. Calibre es una herramienta poderosa que le permite personalizar la apariencia y estructura de su eBook.
- Automatización con Python: La mejor opción para flujos de trabajo repetibles a gran escala. Python es perfecto para editores de contenido o equipos que necesitan automatizar conversiones masivas de manera eficiente.
El método correcto depende de sus requisitos específicos, habilidades técnicas y el volumen de documentos que necesita procesar. Al elegir la herramienta de conversión adecuada y seguir las mejores prácticas, puede asegurarse de que sus eBooks estén pulidos, sean profesionales y estén listos para su distribución.
¿Busca más tutoriales de Word de alta calidad? Consulte nuestros recursos gratuitos de Word.
Preguntas frecuentes sobre Word a EPUB
P1: ¿Cuál es la forma más fácil de convertir documentos de Word a EPUB?
R1: La forma más fácil de convertir de Word a EPUB es usando un convertidor en línea, como Convertio o Zamzar. Sin embargo, evite usarlos para documentos sensibles o grandes.
P2: ¿Puedo convertir de Word a EPUB gratis?
R2: Sí, puede convertir de Word a EPUB de forma gratuita utilizando convertidores en línea o software de escritorio gratuito como Calibre. Si bien las herramientas en línea son convenientes para conversiones rápidas, Calibre ofrece más control sobre el formato y los metadatos para uso sin conexión.
P3: ¿Cómo conservo el formato al convertir de Word a EPUB?
R3: Para preservar el formato, use herramientas como Calibre, que mantienen la estructura del documento, los encabezados, las tablas y las imágenes durante la conversión.
P4: ¿Es EPUB el mejor formato para eBooks?
R4: Sí, EPUB es el mejor formato para eBooks debido a su contenido redistribuible, amplia compatibilidad con eReaders y soporte para funciones multimedia e interactivas.
P5: ¿Cómo convierto por lotes múltiples archivos de Word a EPUB?
R5: Puede convertir por lotes múltiples archivos de Word a EPUB usando Python y la biblioteca Spire.Doc for Python. Este método le permite procesar eficientemente grandes volúmenes de documentos, ahorrando tiempo y asegurando resultados de conversión consistentes.