Cómo contar celdas con texto en Excel: Una guía completa

Gestionar hojas de cálculo masivas a menudo se siente como buscar una aguja en un pajar. Ya sea que estés limpiando datos brutos o preparando un resumen financiero, una de las tareas más fundamentales es saber cómo contar celdas con texto en Excel. Aunque suena simple, la presencia de números, espacios ocultos y cadenas vacías generadas por fórmulas puede llevar fácilmente a resultados inexactos. En esta guía, desglosaremos las fórmulas de Excel más fiables para contar texto y te mostraremos cómo automatizar estas soluciones sin esfuerzo.
- Fórmulas Esenciales de Excel para Contar Celdas con Texto
- Contar Celdas con Texto en Microsoft Excel
- Contar Celdas con Texto en Excel Automáticamente
- Manejo de Casos Especiales: Errores Comunes
Conceptos Clave: Fórmulas Esenciales de Excel para Contar Celdas con Texto
Para dominar la validación de datos, primero necesitas entender la mecánica de la función CONTAR.SI. Es la herramienta más intuitiva cuando se trata de contar celdas con texto en un archivo de Excel, pero su verdadero poder reside en cómo defines tus criterios.
La Base: Usando CONTAR.SI para un Conteo Rápido
La sintaxis básica, =CONTAR.SI(rango, criterio), te permite escanear un conjunto de datos en busca de patrones específicos. Cuando se trata de texto genérico, usamos comodines para decirle a Excel exactamente qué califica como "contenido".
Cuatro Escenarios Comunes para Contar Texto
Los archivos de Excel a menudo contienen múltiples tipos de datos, por lo que es posible que necesites usar uno o más de los siguientes cuatro enfoques especializados:
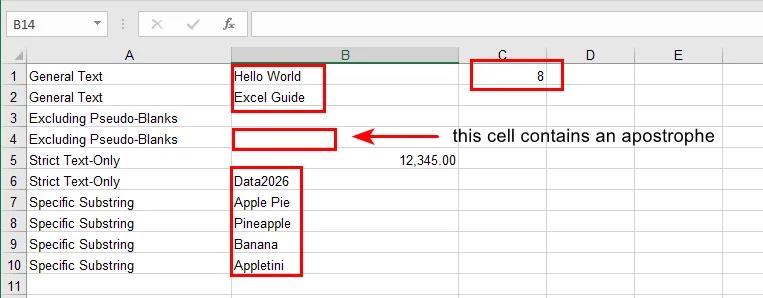
Escenario 1: La Forma Estándar (Texto General)
- Fórmula:
=CONTAR.SI(rango, "*") - Análisis: Esta es la fórmula de Excel más común para contar celdas con texto. El asterisco (*) actúa como un comodín que coincide con cualquier cadena de texto, por lo que solo se cuentan los valores de texto, por ejemplo, las celdas que contienen "Manzana", "Banana", o "Texto123" se incluirán, mientras que las celdas con solo números se excluyen.
Escenario 2: La Forma de Limpieza de Datos (Excluyendo Pseudo-Blancos)
- Fórmula:
=CONTAR.SI.CONJUNTO(rango, "*", rango, "<> ") - Análisis: Algunas celdas pueden parecer vacías pero en realidad contienen un solo carácter de espacio. Al combinar múltiples criterios con
CONTAR.SI.CONJUNTO, esta fórmula cuenta las celdas que contienen texto mientras excluye los valores que son exactamente un espacio. Por ejemplo, se incluyen entradas como "Manzana" o "Texto123", mientras que se ignoran las celdas que contienen " ". Sin embargo, este enfoque no excluye las celdas que contienen dos o más espacios, por lo que se puede combinar con otras fórmulas para obtener resultados más precisos.
Escenario 3: La Forma Técnica (Solo Texto Estricto)
- Fórmula:
=SUMAPRODUCTO(--ESTEXTO(rango)) - Análisis: Cuando una hoja de trabajo contiene una mezcla de fechas, valores de error (#N/A) y valores lógicos (VERDADERO/FALSO), ESTEXTO proporciona una forma estricta de identificar texto. Comprueba el tipo de datos subyacente en lugar de los caracteres mostrados, por lo que se cuentan valores como "Manzana" o "Texto123", mientras que se excluyen fechas, booleanos y errores.
Escenario 4: La Forma Avanzada (Subcadenas Específicas)
- Fórmula:
=CONTAR.SI(rango, "*palabraclave*") - Análisis: Este enfoque es útil para el análisis de registros o el etiquetado de palabras clave. Al usar comodines en ambos lados, la fórmula cuenta las celdas que contienen una subcadena específica en cualquier parte del texto, por ejemplo, se incluyen valores como "error_404" o "login_error" al buscar "error".
Cómo Contar Celdas con Texto en Microsoft Excel
Usar estas fórmulas directamente en Excel ofrece varias ventajas prácticas. La mayoría de los usuarios ya tienen Excel instalado y están familiarizados con su interfaz, lo que facilita la introducción de fórmulas, la navegación por las hojas y la validación rápida de los resultados. Aplicar formato condicional puede servir como una verificación visual, ayudándote a comprobar qué celdas cumplen los criterios de texto.
Pasos para Contar Texto en Excel Usando CONTAR.SI
-
Selecciona un rango, por ejemplo, B1:B10.
-
Introduce la fórmula apropiada en cualquier celda en blanco:
=CONTAR.SI(B1:B10, "*")=CONTAR.SI(B1:B10, "*palabraclave*")(opcional)=CONTAR.SI.CONJUNTO(B1:B10, "*", B1:B10, "<> ")(opcional)
-
Presiona Enter y la celda mostrará el resultado del conteo.
Consejo: Si quieres ver qué celdas se cuentan, puedes usar formato condicional con una fórmula como =ESTEXTO(B1) para resaltar las celdas de texto. Esto facilita la identificación visual de las entradas contadas.
Cómo Contar Celdas con Texto en Excel Automáticamente Usando Free Spire.XLS
El formato manual está bien para tareas puntuales, pero ¿qué pasa si tienes 500 libros de trabajo? Aquí es donde brilla Free Spire.XLS. Te permite inyectar estas lógicas profesionales de conteo de texto directamente en tus archivos de Excel de forma programática.
¿Por Qué Automatizar?
La automatización elimina el error humano y ahorra horas de clics repetitivos. Con Free Spire.XLS, puedes aplicar fórmulas complejas de conteo en celdas de Excel con lógica de texto a través de miles de filas en segundos.
Implementación Paso a Paso (Ejemplo de Python)
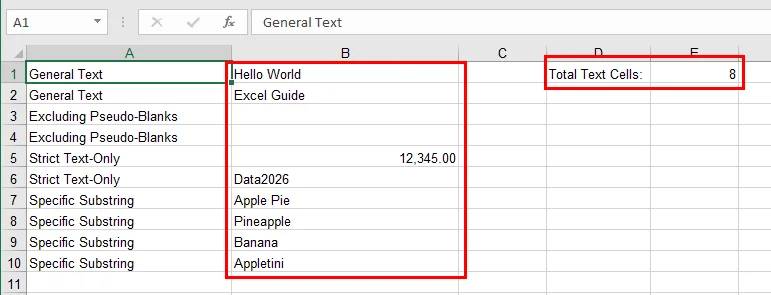
Free Spire.XLS facilita la aplicación de fórmulas CONTAR.SI de forma programática. En este ejemplo, contamos el número de celdas de texto en un rango especificado y escribimos el resultado directamente en la hoja de trabajo.
from spire.xls import *

# Create a Workbook and load an Excel file
workbook = Workbook()
workbook.LoadFromFile("/sample.xlsx")

# Get the first worksheet
sheet = workbook.Worksheets[0]

# Specify the cell range for counting
source_range = "B1:B10"

# Count cells with text using COUNTIF
sheet.Range["D1"].Text = "Total Text Cells:"
sheet.Range["E1"].Formula = f'=COUNTIF({source_range}, "*")'

# Save the modified Excel file
workbook.SaveToFile("/Text_Count_Simple.xlsx", ExcelVersion.Version2016)
workbook.Dispose()
Aquí está el resultado del conteo:
Manejo de Casos Especiales: Errores Comunes
Incluso los usuarios experimentados de Excel pueden tropezar con peculiaridades sutiles de los datos. Al contar texto con CONTAR.SI, ten en cuenta los siguientes puntos:
- Cadenas Vacías:
Las celdas que contienen fórmulas como ="" devuelven cadenas vacías en lugar de verdaderos espacios en blanco. Aunque CONTAR.SI(rango, "*") no cuenta estas celdas, todavía pueden causar confusión al inspeccionar visualmente los datos o al usar funciones como CONTARA. Si es necesario, se puede usar LARGO(A2)>0 para probar explícitamente si hay texto no vacío.
- Caracteres Ocultos:
Los datos copiados de páginas web o sistemas externos a menudo incluyen espacios de no separación (CARACTER(160)), que no se eliminan con ESPACIOS(). En tales casos, combinar SUSTITUIR(A2, CARACTER(160), "") con ESPACIOS() ayuda a garantizar que solo se cuente el texto significativo. También puede resultarte útil convertir números a texto en Excel al preparar los datos para un conteo consistente.
- Rangos Incorrectos:
Los resultados mal contados a menudo son causados por seleccionar el rango de celdas incorrecto en lugar de usar una fórmula incorrecta. Siempre verifica dos veces las celdas de inicio y fin, especialmente al comparar los resultados manuales de Excel con los resultados automatizados.
- Rendimiento:
El uso de fórmulas integradas de Excel como CONTAR.SI permite que Free Spire.XLS dependa del motor de fórmulas nativo de Excel para el cálculo. Este enfoque es significativamente más eficiente que iterar a través de cada celda en el código para evaluar su valor, particularmente cuando se trabaja con hojas de trabajo grandes.
Conclusión
Aprender a contar celdas con texto en Excel es una pequeña habilidad que produce enormes dividendos en la precisión de los datos. Al pasar de las fórmulas manuales a la automatización con Free Spire.XLS, transformas una tarea tediosa en un flujo de trabajo escalable y sin errores. Ya sea que estés gestionando listas simples o bases de datos complejas, estas herramientas aseguran que tus conocimientos se basen siempre en datos limpios y bien categorizados.
¿Listo para llevar tu juego de hojas de cálculo al siguiente nivel? ¡Prueba Free Spire.XLS y comienza a automatizar tu validación de datos con facilidad!
También Leer
So zählen Sie Zellen mit Text in Excel: Eine vollständige Anleitung
Die Verwaltung riesiger Tabellenkalkulationen fühlt sich oft an wie die Suche nach der Nadel im Heuhaufen. Egal, ob Sie Rohdaten bereinigen oder eine Finanzübersicht erstellen, eine der grundlegendsten Aufgaben ist es zu wissen, wie man Zellen mit Text in Excel zählt. Obwohl es einfach klingt, können Zahlen, versteckte Leerzeichen und durch Formeln erzeugte leere Zeichenfolgen leicht zu ungenauen Ergebnissen führen. In diesem Leitfaden werden wir die zuverlässigsten Excel-Formeln zum Zählen von Text aufschlüsseln und Ihnen zeigen, wie Sie diese Lösungen mühelos automatisieren können.
- Wesentliche Excel-Formeln zum Zählen von Zellen mit Text
- Zellen mit Text in Microsoft Excel zählen
- Zellen mit Text in Excel automatisch zählen
- Umgang mit Sonderfällen: Häufige Fallstricke
Grundkonzepte: Wesentliche Excel-Formeln zum Zählen von Zellen mit Text
Um die Datenvalidierung zu meistern, müssen Sie zunächst die Funktionsweise der COUNTIF-Funktion verstehen. Sie ist das intuitivste Werkzeug, wenn es darum geht, Zellen mit Text in einer Excel-Datei zu zählen, aber ihre wahre Stärke liegt darin, wie Sie Ihre Kriterien definieren.
Die Grundlage: Verwendung von COUNTIF für schnelles Zählen
Die grundlegende Syntax, =COUNTIF(range, criteria), ermöglicht es Ihnen, einen Datensatz nach bestimmten Mustern zu durchsuchen. Wenn es um allgemeinen Text geht, verwenden wir Platzhalter, um Excel genau mitzuteilen, was als "Inhalt" gilt.
Vier häufige Szenarien zum Zählen von Text
Excel-Dateien enthalten oft mehrere Datentypen, daher müssen Sie möglicherweise einen oder mehrere der folgenden vier spezialisierten Ansätze verwenden:
Szenario 1: Der Standardweg (Allgemeiner Text)
- Formel:
=COUNTIF(range, "*") - Analyse: Dies ist die gebräuchlichste Excel-Formel zum Zählen von Zellen mit Text. Das Sternchen (*) fungiert als Platzhalter, der auf jede Textzeichenfolge passt, sodass nur Textwerte gezählt werden. Zum Beispiel werden Zellen, die "Apple", "Banana" oder "Text123" enthalten, berücksichtigt, während Zellen mit nur Zahlen ausgeschlossen werden.
Szenario 2: Der Datenbereinigungsweg (Ausschluss von Pseudo-Leerzeichen)
- Formel:
=COUNTIFS(range, "*", range, "<> ") - Analyse: Einige Zellen mögen leer erscheinen, enthalten aber tatsächlich ein einzelnes Leerzeichen. Durch die Kombination mehrerer Kriterien mit
COUNTIFSzählt diese Formel Zellen, die Text enthalten, während Werte, die genau ein Leerzeichen sind, ausgeschlossen werden. Zum Beispiel werden Einträge wie "Apple" oder "Text123" berücksichtigt, während Zellen, die " " enthalten, ignoriert werden. Dieser Ansatz schließt jedoch keine Zellen aus, die zwei oder mehr Leerzeichen enthalten, sodass er für präzisere Ergebnisse mit anderen Formeln kombiniert werden kann.
Szenario 3: Der technische Weg (Nur-Text)
- Formel:
=SUMPRODUCT(--ISTEXT(range)) - Analyse: Wenn ein Arbeitsblatt eine Mischung aus Daten, Fehlerwerten (#N/A) und logischen Werten (WAHR/FALSCH) enthält, bietet ISTEXT eine strikte Möglichkeit, Text zu identifizieren. Es prüft den zugrunde liegenden Datentyp anstelle der angezeigten Zeichen, sodass Werte wie "Apple" oder "Text123" gezählt werden, während Daten, boolesche Werte und Fehler ausgeschlossen werden.
Szenario 4: Der fortgeschrittene Weg (Spezifische Teilzeichenfolgen)
- Formel:
=COUNTIF(range, "*keyword*") - Analyse: Dieser Ansatz ist nützlich für die Protokollanalyse oder das Keyword-Tagging. Durch die Verwendung von Platzhaltern auf beiden Seiten zählt die Formel Zellen, die eine bestimmte Teilzeichenfolge an einer beliebigen Stelle im Text enthalten. Zum Beispiel werden Werte wie "error_404" oder "login_error" bei der Suche nach "error" berücksichtigt.
Wie man Zellen mit Text in Microsoft Excel zählt
Die direkte Verwendung dieser Formeln in Excel bietet mehrere praktische Vorteile. Die meisten Benutzer haben Excel bereits installiert und sind mit seiner Oberfläche vertraut, was es einfach macht, Formeln einzugeben, in Blättern zu navigieren und Ergebnisse schnell zu überprüfen. Die Anwendung der bedingten Formatierung kann als visuelle Plausibilitätsprüfung dienen und Ihnen helfen zu verifizieren, welche Zellen die Textkriterien erfüllen.
Schritte zum Zählen von Text in Excel mit COUNTIF
-
Wählen Sie einen Bereich aus, zum Beispiel B1:B10.
-
Geben Sie die entsprechende Formel in eine leere Zelle ein:
=COUNTIF(B1:B10, "*")=COUNTIF(B1:B10, "*keyword*")(optional)=COUNTIFS(B1:B10, "*", B1:B10, "<> ")(optional)
-
Drücken Sie Enter und die Zelle zeigt das Zählergebnis an.
Tipp: Wenn Sie sehen möchten, welche Zellen gezählt werden, können Sie die bedingte Formatierung mit einer Formel wie =ISTEXT(B1) verwenden, um die Textzellen hervorzuheben. Dies erleichtert die visuelle Identifizierung der gezählten Einträge.
Wie man Zellen mit Text in Excel automatisch mit Free Spire.XLS zählt
Manuelle Formatierung ist für einmalige Aufgaben in Ordnung, aber was ist, wenn Sie 500 Arbeitsmappen haben? Hier glänzt Free Spire.XLS. Es ermöglicht Ihnen, diese professionellen Logiken zum Zählen von Text programmatisch direkt in Ihre Excel-Dateien einzufügen.
Warum automatisieren?
Automatisierung eliminiert menschliche Fehler und spart Stunden repetitiver Klicks. Mit Free Spire.XLS können Sie komplexe Zählformeln in Excel-Zellen mit Textlogik in Sekundenschnelle auf Tausende von Zeilen anwenden.
Schritt-für-Schritt-Implementierung (Python-Beispiel)
Free Spire.XLS macht es einfach, COUNTIF-Formeln programmatisch anzuwenden. In diesem Beispiel zählen wir die Anzahl der Textzellen in einem bestimmten Bereich und schreiben das Ergebnis direkt in das Arbeitsblatt.
from spire.xls import *

# Erstellen Sie eine Arbeitsmappe und laden Sie eine Excel-Datei
workbook = Workbook()
workbook.LoadFromFile("/sample.xlsx")

# Holen Sie sich das erste Arbeitsblatt
sheet = workbook.Worksheets[0]

# Geben Sie den Zellbereich zum Zählen an
source_range = "B1:B10"

# Zählen Sie Zellen mit Text mit COUNTIF
sheet.Range["D1"].Text = "Textzellen gesamt:"
sheet.Range["E1"].Formula = f'=COUNTIF({source_range}, "*")'

# Speichern Sie die geänderte Excel-Datei
workbook.SaveToFile("/Text_Count_Simple.xlsx", ExcelVersion.Version2016)
workbook.Dispose()
Hier ist das Zählergebnis:
Umgang mit Sonderfällen: Häufige Fallstricke
Selbst erfahrene Excel-Benutzer können über subtile Daten-Eigenheiten stolpern. Beachten Sie beim Zählen von Text mit COUNTIF die folgenden Punkte:
- Leere Zeichenfolgen:
Zellen, die Formeln wie ="" enthalten, geben leere Zeichenfolgen anstelle von echten Leerzeichen zurück. Obwohl COUNTIF(range, "*") diese Zellen nicht zählt, können sie bei der visuellen Überprüfung von Daten oder bei der Verwendung von Funktionen wie COUNTA dennoch zu Verwirrung führen. Falls erforderlich, kann LEN(A2)>0 verwendet werden, um explizit auf nicht leeren Text zu testen.
- Versteckte Zeichen:
Daten, die von Webseiten oder externen Systemen kopiert wurden, enthalten oft geschützte Leerzeichen (CHAR(160)), die nicht von TRIM() entfernt werden. In solchen Fällen hilft die Kombination von SUBSTITUTE(A2, CHAR(160), "") mit TRIM(), um sicherzustellen, dass nur sinnvoller Text gezählt wird. Möglicherweise finden Sie auch das Konvertieren von Zahlen in Text in Excel nützlich, wenn Sie Daten für eine konsistente Zählung vorbereiten.
- Falsche Bereiche:
Fehlzählungen werden oft durch die Auswahl des falschen Zellbereichs verursacht und nicht durch die Verwendung einer falschen Formel. Überprüfen Sie immer die Start- und Endzellen, insbesondere beim Vergleich von manuellen Excel-Ergebnissen mit automatisierten Ausgaben.
- Leistung:
Die Verwendung integrierter Excel-Formeln wie COUNTIF ermöglicht es Free Spire.XLS, sich auf die native Formel-Engine von Excel für die Berechnung zu verlassen. Dieser Ansatz ist wesentlich effizienter als das Durchlaufen jeder Zelle im Code, um ihren Wert auszuwerten, insbesondere bei der Arbeit mit großen Arbeitsblättern.
Fazit
Zu lernen, wie man Zellen mit Text in Excel zählt, ist eine kleine Fähigkeit, die massive Dividenden in der Datengenauigkeit bringt. Indem Sie von manuellen Formeln zur Automatisierung mit Free Spire.XLS übergehen, verwandeln Sie eine mühsame Aufgabe in einen skalierbaren, fehlerfreien Arbeitsablauf. Egal, ob Sie einfache Listen oder komplexe Datenbanken verwalten, diese Tools stellen sicher, dass Ihre Erkenntnisse immer auf sauberen, gut kategorisierten Daten basieren.
Bereit, Ihr Tabellenkalkulationsspiel auf die nächste Stufe zu heben? Probieren Sie Free Spire.XLS aus und beginnen Sie, Ihre Datenvalidierung mit Leichtigkeit zu automatisieren!
Lesen Sie auch
Как подсчитать ячейки с текстом в Excel: Полное руководство
Управление огромными электронными таблицами часто похоже на поиск иголки в стоге сена. Независимо от того, очищаете ли вы необработанные данные или готовите финансовый отчет, одной из самых фундаментальных задач является знание, как подсчитать ячейки с текстом в Excel. Хотя это звучит просто, наличие чисел, скрытых пробелов и пустых строк, сгенерированных формулами, может легко привести к неточным результатам. В этом руководстве мы разберем самые надежные формулы Excel для подсчета текста и покажем, как легко автоматизировать эти решения.
- Основные формулы Excel для подсчета ячеек с текстом
- Подсчет ячеек с текстом в Microsoft Excel
- Автоматический подсчет ячеек с текстом в Excel
- Работа с крайними случаями: распространенные ошибки
Основные концепции: основные формулы Excel для подсчета ячеек с текстом
Чтобы освоить проверку данных, сначала необходимо понять механику функции COUNTIF. Это самый интуитивно понятный инструмент для подсчета ячеек с текстом в файле Excel, но его истинная сила заключается в том, как вы определяете свои критерии.
Основа: использование COUNTIF для быстрого подсчета
Базовый синтаксис, =COUNTIF(диапазон, критерий), позволяет сканировать набор данных на предмет определенных шаблонов. При работе с обычным текстом мы используем подстановочные знаки, чтобы точно указать Excel, что квалифицируется как "содержимое."
Четыре распространенных сценария подсчета текста
Файлы Excel часто содержат несколько типов данных, поэтому вам может потребоваться использовать один или несколько из следующих четырех специализированных подходов:
Сценарий 1: Стандартный способ (общий текст)
- Формула:
=COUNTIF(range, "*") - Анализ: Это самая распространенная формула Excel для подсчета ячеек с текстом. Звездочка (*) действует как подстановочный знак, который соответствует любой текстовой строке, поэтому подсчитываются только текстовые значения, например, ячейки, содержащие "Apple", "Banana", или "Text123" будут включены, в то время как ячейки только с числами исключаются.
Сценарий 2: Способ очистки данных (исключая псевдопустые ячейки)
- Формула:
=COUNTIFS(range, "*", range, "<> ") - Анализ: Некоторые ячейки могут казаться пустыми, но на самом деле содержат один пробел. Комбинируя несколько критериев с помощью
COUNTIFS, эта формула подсчитывает ячейки, содержащие текст, исключая при этом значения, которые представляют собой ровно один пробел. Например, записи типа "Apple" или "Text123" включаются, а ячейки, содержащие " " игнорируются. Однако этот подход не исключает ячейки, содержащие два или более пробелов, поэтому его можно комбинировать с другими формулами для получения более точных результатов.
Сценарий 3: Технический способ (только строгий текст)
- Формула:
=SUMPRODUCT(--ISTEXT(range)) - Анализ: Когда рабочий лист содержит смесь дат, значений ошибок (#N/A) и логических значений (TRUE/FALSE), ISTEXT предоставляет строгий способ идентификации текста. Он проверяет базовый тип данных, а не отображаемые символы, поэтому значения типа "Apple" или "Text123" подсчитываются, а даты, логические значения и ошибки исключаются.
Сценарий 4: Продвинутый способ (определенные подстроки)
- Формула:
=COUNTIF(range, "*keyword*") - Анализ: Этот подход полезен для анализа журналов или тегирования ключевых слов. Используя подстановочные знаки с обеих сторон, формула подсчитывает ячейки, содержащие определенную подстроку в любом месте текста, например, значения типа "error_404" или "login_error" включаются при поиске "error".
Как подсчитать ячейки с текстом в Microsoft Excel
Использование этих формул непосредственно в Excel дает несколько практических преимуществ. У большинства пользователей уже установлен Excel, и они знакомы с его интерфейсом, что позволяет легко вводить формулы, перемещаться по листам и быстро проверять результаты. Применение условного форматирования может служить визуальной проверкой, помогая вам убедиться, какие ячейки соответствуют текстовым критериям.
Шаги для подсчета текста в Excel с использованием COUNTIF
-
Выберите диапазон, например, B1:B10.
-
Введите соответствующую формулу в любую пустую ячейку:
=COUNTIF(B1:B10, "*")=COUNTIF(B1:B10, "*keyword*")(необязательно)=COUNTIFS(B1:B10, "*", B1:B10, "<> ")(необязательно)
-
Нажмите Enter, и ячейка покажет результат подсчета.
Совет: если вы хотите увидеть, какие ячейки подсчитываются, вы можете использовать условное форматирование с формулой типа =ISTEXT(B1), чтобы выделить текстовые ячейки. Это позволяет легко визуально идентифицировать подсчитанные записи.
Как автоматически подсчитывать ячейки с текстом в Excel с помощью Free Spire.XLS
Ручное форматирование подходит для разовых задач, но что, если у вас 500 рабочих книг? Именно здесь Free Spire.XLS проявляет себя во всей красе. Он позволяет программно внедрять эту профессиональную логику подсчета текста непосредственно в ваши файлы Excel.
Зачем автоматизировать?
Автоматизация устраняет человеческие ошибки и экономит часы повторяющихся кликов. С помощью Free Spire.XLS вы можете применять сложные формулы подсчета в ячейках Excel с текстовой логикой к тысячам строк за секунды.
Пошаговая реализация (пример на Python)
Free Spire.XLS позволяет легко применять формулы COUNTIF программно. В этом примере мы подсчитываем количество текстовых ячеек в указанном диапазоне и записываем результат непосредственно на рабочий лист.
from spire.xls import *

# Create a Workbook and load an Excel file
workbook = Workbook()
workbook.LoadFromFile("/sample.xlsx")

# Get the first worksheet
sheet = workbook.Worksheets[0]

# Specify the cell range for counting
source_range = "B1:B10"

# Count cells with text using COUNTIF
sheet.Range["D1"].Text = "Total Text Cells:"
sheet.Range["E1"].Formula = f'=COUNTIF({source_range}, "*")'

# Save the modified Excel file
workbook.SaveToFile("/Text_Count_Simple.xlsx", ExcelVersion.Version2016)
workbook.Dispose()
Вот результат подсчета:
Работа с крайними случаями: распространенные ошибки
Даже опытные пользователи Excel могут столкнуться с тонкими особенностями данных. При подсчете текста с помощью COUNTIF помните о следующих моментах:
- Пустые строки:
Ячейки, содержащие формулы типа ="", возвращают пустые строки, а не истинно пустые ячейки. Хотя COUNTIF(диапазон, "*") не подсчитывает эти ячейки, они все же могут вызывать путаницу при визуальном осмотре данных или при использовании таких функций, как COUNTA. При необходимости можно использовать LEN(A2)>0 для явной проверки на непустой текст.
- Скрытые символы:
Данные, скопированные с веб-страниц или из внешних систем, часто содержат неразрывные пробелы (CHAR(160)), которые не удаляются функцией TRIM(). В таких случаях комбинация SUBSTITUTE(A2, CHAR(160), "") с TRIM() помогает гарантировать, что подсчитывается только значимый текст. Вам также может быть полезно преобразование чисел в текст в Excel при подготовке данных для последовательного подсчета.
- Неправильные диапазоны:
Ошибки в подсчетах часто вызваны выбором неправильного диапазона ячеек, а не использованием неверной формулы. Всегда дважды проверяйте начальные и конечные ячейки, особенно при сравнении ручных результатов Excel с автоматизированными.
- Производительность:
Использование встроенных формул Excel, таких как COUNTIF, позволяет Free Spire.XLS полагаться на собственный механизм вычисления формул Excel. Этот подход значительно эффективнее, чем перебор каждой ячейки в коде для оценки ее значения, особенно при работе с большими рабочими листами.
Заключение
Умение подсчитывать ячейки с текстом в Excel — это небольшой навык, который приносит огромные дивиденды в точности данных. Переходя от ручных формул к автоматизации с помощью Free Spire.XLS, вы превращаете утомительную рутину в масштабируемый, безошибочный рабочий процесс. Независимо от того, управляете ли вы простыми списками или сложными базами данных, эти инструменты гарантируют, что ваши выводы всегда будут основаны на чистых, хорошо классифицированных данных.
Готовы поднять свою работу с электронными таблицами на новый уровень? Попробуйте Free Spire.XLS и начните с легкостью автоматизировать проверку данных!
Также читайте
Conversão de ODT para PDF facilitada: Ferramentas gratuitas e Python
Índice
Os arquivos ODT (OpenDocument Text) são amplamente utilizados para criar e editar documentos no LibreOffice ou Apache OpenOffice. No entanto, compartilhar ou distribuir arquivos ODT pode ser inconveniente, pois nem todos os dispositivos ou plataformas suportam este formato. Converter arquivos ODT para PDF garante que o layout, as fontes e a formatação do seu documento permaneçam intactos, facilitando o compartilhamento, a impressão ou o arquivamento de forma confiável.
Este artigo orienta você através de métodos práticos para converter ODT para PDF, abrangendo ferramentas online, software de desktop e automação baseada em Python para conversões ocasionais e em grande escala.
Navegação Rápida
- O que é um arquivo ODT e por que convertê-lo para PDF?
- Converter ODT para PDF Online (Ferramentas Gratuitas e Baseadas na Web)
- Converter ODT para PDF usando software de desktop
- Converter ODT para PDF programaticamente com Python
- Escolhendo o método certo para suas necessidades
- Perguntas Frequentes
O que é um arquivo ODT e por que convertê-lo para PDF?
Um arquivo ODT é um documento de processamento de texto baseado no padrão OpenDocument. É comumente usado em ambientes que priorizam formatos abertos e compatibilidade entre plataformas. Os arquivos ODT suportam texto rico, imagens, tabelas e estilos, tornando-os adequados para a criação de documentos do dia a dia.
No entanto, o ODT não é universalmente suportado fora das aplicações de escritório. Quando os documentos precisam ser compartilhados com um público mais amplo, enviados formalmente ou arquivados para uso a longo prazo, o PDF se torna a escolha mais prática.
A conversão de ODT para PDF ajuda a atender a várias necessidades comuns:
- Layout consistente: os PDFs são exibidos da mesma forma em todos os dispositivos e sistemas operacionais.
- Compatibilidade aprimorada: os leitores de PDF estão amplamente disponíveis e não requerem software de edição.
- Integridade do documento: os PDFs reduzem o risco de alterações acidentais no conteúdo.
- Distribuição profissional: os PDFs são frequentemente preferidos para relatórios, contratos e documentos oficiais.
Converter ODT para PDF Online (Ferramentas Gratuitas e Baseadas na Web)
Os conversores online costumam ser a maneira mais rápida de converter um arquivo ODT para PDF, especialmente para usuários que precisam apenas de conversões ocasionais e não desejam instalar software adicional.
Passo a passo: Converter ODT para PDF Online
- Abra um serviço de conversão de ODT para PDF baseado na web em seu navegador (por exemplo, Conversor de ODT para PDF CloudXDocs).
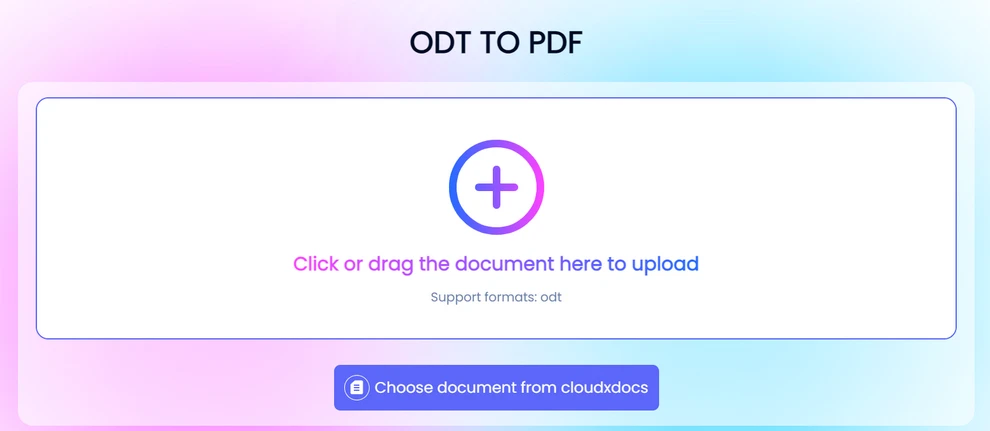
- Carregue o arquivo ODT do seu dispositivo local ou armazenamento em nuvem compatível.
- Aguarde enquanto o arquivo é processado e convertido no servidor.
- Baixe o arquivo PDF resultante para o seu computador.
A maioria das ferramentas online segue este fluxo de trabalho simples, tornando-as acessíveis mesmo para usuários não técnicos.
Vantagens da conversão online
- Nenhuma instalação ou configuração necessária
- Acessível de qualquer navegador moderno
- Adequado para conversões rápidas e únicas
- Muitas vezes disponível gratuitamente com uso básico
Limitações dos conversores online
As ferramentas online geralmente impõem limites de tamanho de arquivo ou limites diários de conversão. O upload de documentos para servidores de terceiros também pode ser inadequado para arquivos confidenciais ou sensíveis. Além disso, a formatação complexa - como fontes personalizadas ou layouts avançados - nem sempre pode ser preservada com precisão, e a conversão em lote raramente é suportada.
Nos casos em que a edição e a colaboração são necessárias, converter arquivos ODT para o formato Word pode ser uma opção mais prática do que o PDF.
Converter ODT para PDF usando software de desktop
Os aplicativos de escritório de desktop fornecem um ambiente mais controlado para a conversão de arquivos ODT para PDF. O LibreOffice e o Apache OpenOffice incluem funcionalidade de exportação de PDF integrada.
Passo a passo: Converter ODT para PDF com LibreOffice ou OpenOffice
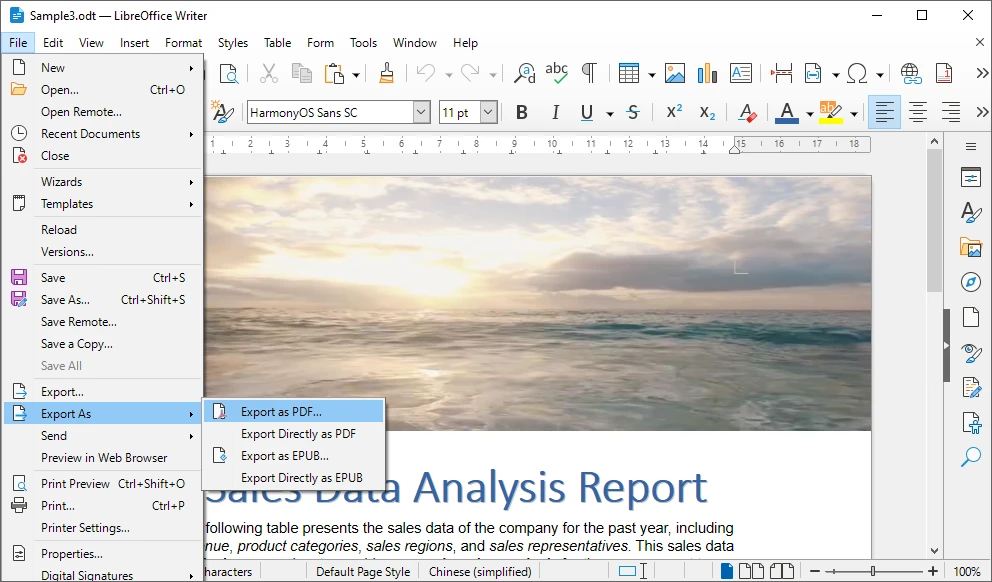
- Abra o arquivo ODT no LibreOffice Writer (ou Apache OpenOffice Writer).
- Revise o documento para garantir que a formatação e o layout estejam corretos.
- Clique em Arquivo e selecione Exportar como PDF.
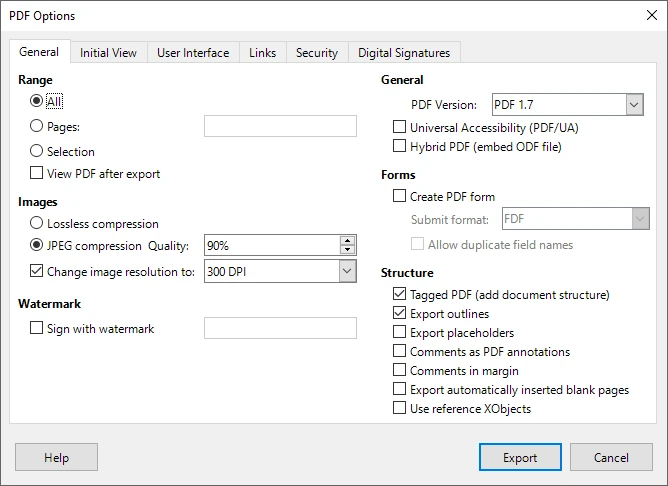
- Configure as opções de exportação, como qualidade da imagem, incorporação de fontes ou intervalo de páginas.
- Salve o arquivo PDF exportado em seu sistema local.
Essa abordagem oferece aos usuários maior confiança no resultado final, especialmente para documentos visualmente complexos.
Vantagens da conversão baseada em desktop
- Melhor preservação da formatação e do layout
- Não há necessidade de enviar arquivos para servidores externos
- Maior controle sobre as configurações de exportação de PDF
- Confiável para documentos com tabelas, imagens e estilos
Limitações da conversão manual
A conversão manual requer a interação do usuário para cada documento, tornando-a ineficiente para fluxos de trabalho de alto volume. Também é difícil de automatizar e inadequada para ambientes de servidor ou sem interface gráfica, onde nenhuma interface gráfica está disponível.
Quando os métodos online e manuais não são suficientes
Existem muitos cenários em que as ferramentas online e o software de desktop não atendem mais aos requisitos práticos. À medida que o volume de documentos aumenta ou os fluxos de trabalho se tornam mais complexos, a conversão manual rapidamente se transforma em um gargalo.
Situações típicas em que os métodos tradicionais falham incluem:
- Converter grandes números de arquivos ODT regularmente
- Executar conversões automaticamente em um servidor ou sistema de backend
- Integrar a conversão de documentos em um aplicativo ou serviço existente
- Garantir uma saída consistente sem intervenção do usuário
- Operar em ambientes sem uma interface gráfica
Nesses casos, uma abordagem programática oferece maior confiabilidade, escalabilidade e controle.
Converter ODT para PDF programaticamente com Python
O Python é amplamente utilizado para automação, processamento de dados e desenvolvimento de backend. Usar o Python para converter arquivos ODT em PDF permite que o processo seja totalmente automatizado e integrado a sistemas maiores.
Por que usar o Python para a conversão de ODT para PDF?
O Python permite o processamento em lote, fluxos de trabalho repetíveis e integração perfeita com aplicativos existentes. Uma vez implementadas, as conversões podem ser executadas sem supervisão, garantindo resultados consistentes e reduzindo o esforço manual.
Usando o Spire.Doc para Python
Spire.Doc para Python é uma biblioteca de processamento de documentos que suporta formatos OpenDocument e permite a conversão direta de ODT para PDF. Ele preserva texto, imagens e layout sem depender do Microsoft Word ou LibreOffice, tornando-o adequado para uso em servidor e empresarial.
Instalação
O Spire.Doc para Python pode ser instalado via pip:
pip install spire-doc
Exemplo: Converter ODT para PDF com Python
from spire.doc import Document, FileFormat

# Crie um objeto Document e carregue o arquivo ODT
doc = Document()
doc.LoadFromFile("Sample.odt", FileFormat.Odt)

# Salve o documento ODT como um arquivo PDF
doc.SaveToFile("output/ODTToPDF.pdf", FileFormat.PDF)
doc.Close()
Abaixo está uma prévia do arquivo PDF convertido de ODT usando Python:
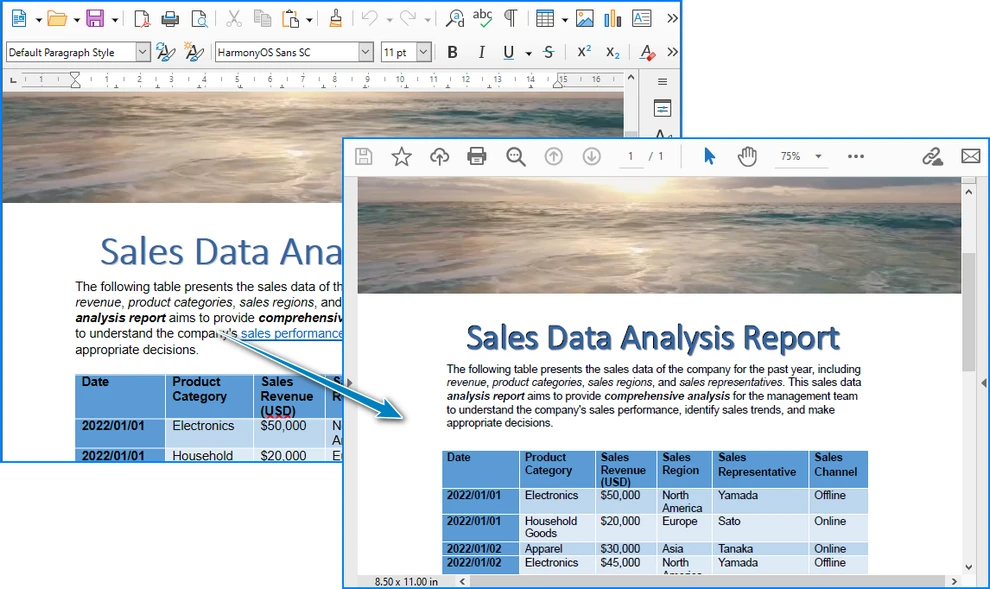
Essa abordagem pode ser facilmente estendida para lidar com conversões em lote ou integrada a fluxos de trabalho automatizados.
Depois de converter o arquivo ODT para PDF, você pode editar ainda mais o PDF gerado usando Python, como adicionar marcas d'água, definir metadados ou aplicar opções de segurança adicionais.
Salvar ODT como PDF em um fluxo (opcional)
Em aplicativos de backend ou baseados na web, você pode querer gerar um arquivo PDF na memória sem gravá-lo no disco. O Spire.Doc para Python permite salvar o documento convertido em um fluxo.
from spire.doc import Document, FileFormat, Stream

doc = Document()
doc.LoadFromFile("Sample.odt", FileFormat.Odt)

# Salve o documento ODT em um fluxo de PDF
pdf_stream = Stream()
doc.SaveToStream(pdf_stream, FileFormat.PDF)
doc.Close()

# Obtenha os bytes do PDF do fluxo
pdf_bytes = bytes(pdf_stream.ToArray())
Essa abordagem é útil para retornar arquivos PDF em APIs da web, fazer upload para armazenamento em nuvem ou processar documentos na memória.
Se o seu fluxo de trabalho exigir processamento adicional de arquivos PDF na memória - como mesclar documentos, adicionar marcas d'água ou aplicar configurações de segurança - pode ser útil explorar técnicas para trabalhar com documentos PDF diretamente em fluxos.
Escolhendo o método certo para suas necessidades
A melhor maneira de converter ODT para PDF depende da frequência com que você executa a tarefa e do nível de controle necessário.
- Ferramentas online são ideais para conversões rápidas e ocasionais quando a conveniência é a prioridade.
- Software de desktop funciona bem para usuários que precisam de melhor controle de formatação e convertem arquivos manualmente.
- A automação baseada em Python é a opção mais adequada para processamento em grande escala, sistemas de backend e fluxos de trabalho empresariais.
Compreender o seu cenário de uso ajuda a garantir que você escolha um método que equilibre eficiência, confiabilidade e manutenibilidade.
Perguntas frequentes sobre a conversão de ODT para PDF
É seguro converter ODT para PDF online?
Os conversores online podem ser convenientes para documentos não sensíveis, mas podem não ser adequados para documentos sensíveis devido a preocupações com a privacidade.
A formatação do documento mudará após a conversão?
Documentos simples geralmente são convertidos com precisão, enquanto layouts complexos podem se beneficiar de métodos de desktop ou programáticos.
Vários arquivos ODT podem ser convertidos de uma vez?
A conversão em lote raramente é suportada por ferramentas online e é ineficiente manualmente. As soluções programáticas lidam com isso de forma mais eficaz.
As conversões baseadas em Python exigem software de escritório?
Não. Bibliotecas como o Spire.Doc para Python operam independentemente dos aplicativos de escritório.
Conclusão
A conversão de arquivos ODT para PDF pode ser realizada de várias maneiras, cada uma adequada a diferentes necessidades. Ferramentas online e aplicativos de desktop são eficazes para o uso diário, enquanto a automação baseada em Python fornece uma solução escalável para cenários avançados e de alto volume. Ao selecionar o método apropriado, você pode garantir uma conversão de documentos precisa, eficiente e confiável.
Veja também
ODT를 PDF로 쉽게 변환: 무료 도구 및 Python
ODT 파일(OpenDocument Text)은 LibreOffice 또는 Apache OpenOffice에서 문서를 만들고 편집하는 데 널리 사용됩니다. 그러나 모든 장치나 플랫폼이 이 형식을 지원하는 것은 아니므로 ODT 파일을 공유하거나 배포하는 것이 불편할 수 있습니다. ODT 파일을 PDF로 변환하면 문서 레이아웃, 글꼴 및 서식이 그대로 유지되어 안정적으로 공유, 인쇄 또는 보관하기가 더 쉬워집니다.
이 문서에서는 가끔씩 또는 대규모 변환을 위해 온라인 도구, 데스크톱 소프트웨어 및 Python 기반 자동화를 다루면서 ODT를 PDF로 변환하는 실용적인 방법을 안내합니다.
빠른 탐색
- ODT 파일이란 무엇이며 PDF로 변환해야 하는 이유는 무엇입니까?
- 온라인에서 ODT를 PDF로 변환 (무료 및 웹 기반 도구)
- 데스크톱 소프트웨어를 사용하여 ODT를 PDF로 변환
- Python을 사용하여 프로그래밍 방식으로 ODT를 PDF로 변환
- 필요에 맞는 올바른 방법 선택
- 자주 묻는 질문
ODT 파일이란 무엇이며 PDF로 변환해야 하는 이유는 무엇입니까?
ODT 파일은 OpenDocument 표준을 기반으로 하는 워드 프로세싱 문서입니다. 개방형 형식과 플랫폼 간 호환성을 우선시하는 환경에서 일반적으로 사용됩니다. ODT 파일은 서식 있는 텍스트, 이미지, 표 및 스타일을 지원하므로 일상적인 문서 작성에 적합합니다.
그러나 ODT는 사무용 응용 프로그램 외부에서 보편적으로 지원되지는 않습니다. 문서를 더 많은 사람들과 공유하거나, 공식적으로 제출하거나, 장기간 사용하기 위해 보관해야 하는 경우 PDF가 더 실용적인 선택이 됩니다.
ODT를 PDF로 변환하면 다음과 같은 몇 가지 일반적인 요구 사항을 해결하는 데 도움이 됩니다.
- 일관된 레이아웃: PDF는 모든 장치 및 운영 체제에서 동일한 방식으로 표시됩니다.
- 향상된 호환성: PDF 리더는 널리 사용 가능하며 편집 소프트웨어가 필요하지 않습니다.
- 문서 무결성: PDF는 우발적인 내용 변경의 위험을 줄입니다.
- 전문적인 배포: PDF는 보고서, 계약서 및 공식 문서에 자주 선호됩니다.
온라인에서 ODT를 PDF로 변환 (무료 및 웹 기반 도구)
온라인 변환기는 특히 가끔씩 변환이 필요하고 추가 소프트웨어를 설치하고 싶지 않은 사용자에게 ODT 파일을 PDF로 변환하는 가장 빠른 방법인 경우가 많습니다.
단계별: 온라인에서 ODT를 PDF로 변환
- 브라우저에서 웹 기반 ODT to PDF 변환 서비스를 엽니다(예: CloudXDocs ODT to PDF 변환기).
- 로컬 장치 또는 지원되는 클라우드 저장소에서 ODT 파일을 업로드합니다.
- 서버에서 파일이 처리되고 변환되는 동안 기다립니다.
- 결과 PDF 파일을 컴퓨터에 다운로드합니다.
대부분의 온라인 도구는 이 간단한 워크플로를 따르므로 기술에 익숙하지 않은 사용자도 액세스할 수 있습니다.
온라인 변환의 장점
- 설치나 설정이 필요 없음
- 모든 최신 브라우저에서 액세스 가능
- 빠른 일회성 변환에 적합
- 기본 사용 시 무료로 제공되는 경우가 많음
온라인 변환기의 한계
온라인 도구는 일반적으로 파일 크기 제한이나 일일 변환 한도를 부과합니다. 또한 타사 서버에 문서를 업로드하는 것은 기밀 또는 민감한 파일에 적합하지 않을 수 있습니다. 또한 사용자 지정 글꼴이나 고급 레이아웃과 같은 복잡한 서식은 항상 정확하게 보존되지 않을 수 있으며 일괄 변환은 거의 지원되지 않습니다.
편집 및 공동 작업이 필요한 경우 ODT 파일을 Word 형식으로 변환하는 것이 PDF보다 더 실용적인 옵션이 될 수 있습니다.
데스크톱 소프트웨어를 사용하여 ODT를 PDF로 변환
데스크톱 오피스 응용 프로그램은 ODT 파일을 PDF로 변환하기 위한 보다 제어된 환경을 제공합니다. LibreOffice와 Apache OpenOffice 모두 내장된 PDF 내보내기 기능이 있습니다.
단계별: LibreOffice 또는 OpenOffice로 ODT를 PDF로 변환
- LibreOffice Writer(또는 Apache OpenOffice Writer)에서 ODT 파일을 엽니다.
- 문서를 검토하여 서식과 레이아웃이 올바른지 확인합니다.
- 파일을 클릭하고 PDF로 내보내기를 선택합니다.
- 이미지 품질, 글꼴 포함 또는 페이지 범위와 같은 내보내기 옵션을 구성합니다.
- 내보낸 PDF 파일을 로컬 시스템에 저장합니다.
이 접근 방식은 특히 시각적으로 복잡한 문서의 경우 최종 출력에 대한 사용자 신뢰도를 높여줍니다.
데스크톱 기반 변환의 장점
- 서식 및 레이아웃 보존 향상
- 외부 서버에 파일을 업로드할 필요 없음
- PDF 내보내기 설정에 대한 제어 강화
- 표, 이미지 및 스타일이 있는 문서에 신뢰할 수 있음
수동 변환의 한계
수동 변환은 각 문서에 대한 사용자 상호 작용이 필요하므로 대용량 워크플로에는 비효율적입니다. 또한 자동화하기 어렵고 그래픽 인터페이스가 없는 서버 측 또는 헤드리스 환경에는 적합하지 않습니다.
온라인 및 수동 방법이 충분하지 않은 경우
온라인 도구와 데스크톱 소프트웨어가 더 이상 실용적인 요구 사항을 충족하지 못하는 시나리오가 많이 있습니다. 문서 볼륨이 증가하거나 워크플로가 더 복잡해지면 수동 변환은 빠르게 병목 현상이 됩니다.
기존 방법이 부족한 일반적인 상황은 다음과 같습니다.
- 정기적으로 많은 수의 ODT 파일 변환
- 서버 또는 백엔드 시스템에서 자동으로 변환 실행
- 기존 응용 프로그램 또는 서비스에 문서 변환 통합
- 사용자 개입 없이 일관된 출력 보장
- 그래픽 인터페이스가 없는 환경에서 작동
이러한 경우 프로그래밍 방식 접근 방식은 더 뛰어난 안정성, 확장성 및 제어 기능을 제공합니다.
Python을 사용하여 프로그래밍 방식으로 ODT를 PDF로 변환
Python은 자동화, 데이터 처리 및 백엔드 개발에 널리 사용됩니다. Python을 사용하여 ODT 파일을 PDF로 변환하면 프로세스를 완전히 자동화하고 더 큰 시스템에 통합할 수 있습니다.
ODT to PDF 변환에 Python을 사용하는 이유는 무엇입니까?
Python은 일괄 처리, 반복 가능한 워크플로 및 기존 응용 프로그램과의 원활한 통합을 가능하게 합니다. 일단 구현되면 변환을 무인으로 실행하여 수동 작업을 줄이면서 일관된 결과를 보장할 수 있습니다.
Spire.Doc for Python 사용
Spire.Doc for Python은 OpenDocument 형식을 지원하고 ODT에서 PDF로의 직접 변환을 가능하게 하는 문서 처리 라이브러리입니다. Microsoft Word나 LibreOffice에 의존하지 않고 텍스트, 이미지 및 레이아웃을 보존하므로 서버 측 및 엔터프라이즈 사용에 적합합니다.
설치
Spire.Doc for Python은 pip를 통해 설치할 수 있습니다.
pip install spire-doc
예: Python으로 ODT를 PDF로 변환
from spire.doc import Document, FileFormat

# Document 객체를 만들고 ODT 파일을 로드합니다.
doc = Document()
doc.LoadFromFile("Sample.odt", FileFormat.Odt)

# ODT 문서를 PDF 파일로 저장합니다.
doc.SaveToFile("output/ODTToPDF.pdf", FileFormat.PDF)
doc.Close()
아래는 Python을 사용하여 ODT에서 변환된 PDF 파일의 미리보기입니다.
이 접근 방식은 일괄 변환을 처리하거나 자동화된 워크플로에 통합되도록 쉽게 확장할 수 있습니다.
ODT 파일을 PDF로 변환한 후 워터마크 추가, 메타데이터 설정 또는 추가 보안 옵션 적용과 같이 Python을 사용하여 생성된 PDF를 추가로 편집할 수 있습니다.
ODT를 스트림에 PDF로 저장 (선택 사항)
백엔드 또는 웹 기반 응용 프로그램에서는 디스크에 쓰지 않고 메모리에서 PDF 파일을 생성할 수 있습니다. Spire.Doc for Python을 사용하면 변환된 문서를 스트림에 저장할 수 있습니다.
from spire.doc import Document, FileFormat, Stream

doc = Document()
doc.LoadFromFile("Sample.odt", FileFormat.Odt)

# ODT 문서를 PDF 스트림에 저장합니다.
pdf_stream = Stream()
doc.SaveToStream(pdf_stream, FileFormat.PDF)
doc.Close()

# 스트림에서 PDF 바이트를 가져옵니다.
pdf_bytes = bytes(pdf_stream.ToArray())
이 접근 방식은 웹 API에서 PDF 파일을 반환하거나, 클라우드 저장소에 업로드하거나, 메모리에서 문서를 처리하는 데 유용합니다.
워크플로에서 문서 병합, 워터마크 추가 또는 보안 설정 적용과 같이 메모리에서 PDF 파일을 추가로 처리해야 하는 경우 스트림에서 직접 PDF 문서로 작업하는 기술을 탐색하는 것이 도움이 될 수 있습니다.
필요에 맞는 올바른 방법 선택
ODT를 PDF로 변환하는 가장 좋은 방법은 작업을 수행하는 빈도와 필요한 제어 수준에 따라 다릅니다.
- 온라인 도구는 편의성이 우선일 때 빠르고 가끔씩 변환하는 데 이상적입니다.
- 데스크톱 소프트웨어는 더 나은 서식 제어가 필요하고 파일을 수동으로 변환하는 사용자에게 적합합니다.
- Python 기반 자동화는 대규모 처리, 백엔드 시스템 및 엔터프라이즈 워크플로에 가장 적합한 옵션입니다.
사용 시나리오를 이해하면 효율성, 안정성 및 유지 관리 가능성의 균형을 맞추는 방법을 선택하는 데 도움이 됩니다.
ODT를 PDF로 변환하는 것에 대한 자주 묻는 질문
온라인에서 ODT를 PDF로 변환하는 것이 안전한가요?
온라인 변환기는 민감하지 않은 문서에는 편리할 수 있지만 개인 정보 보호 문제로 인해 민감한 문서에는 적합하지 않을 수 있습니다.
변환 후 문서 서식이 변경됩니까?
단순한 문서는 일반적으로 정확하게 변환되지만 복잡한 레이아웃은 데스크톱 또는 프로그래밍 방식의 이점을 누릴 수 있습니다.
여러 ODT 파일을 한 번에 변환할 수 있습니까?
일괄 변환은 온라인 도구에서 거의 지원되지 않으며 수동으로는 비효율적입니다. 프로그래밍 방식 솔루션은 이를 보다 효과적으로 처리합니다.
Python 기반 변환에 오피스 소프트웨어가 필요합니까?
아니요. Spire.Doc for Python과 같은 라이브러리는 오피스 응용 프로그램과 독립적으로 작동합니다.
결론
ODT 파일을 PDF로 변환하는 것은 여러 가지 방법으로 수행할 수 있으며 각 방법은 다양한 요구에 적합합니다. 온라인 도구와 데스크톱 응용 프로그램은 일상적인 사용에 효과적이며, Python 기반 자동화는 고급 및 대용량 시나리오에 확장 가능한 솔루션을 제공합니다. 적절한 방법을 선택하면 정확하고 효율적이며 신뢰할 수 있는 문서 변환을 보장할 수 있습니다.
참고 항목
Convertire ODT in PDF è facile: strumenti gratuiti e Python
Indice
I file ODT (OpenDocument Text) sono ampiamente utilizzati per creare e modificare documenti in LibreOffice o Apache OpenOffice. Tuttavia, la condivisione o la distribuzione di file ODT può essere scomoda, poiché non tutti i dispositivi o le piattaforme supportano questo formato. La conversione di file ODT in PDF garantisce che il layout, i caratteri e la formattazione del documento rimangano intatti, rendendolo più facile da condividere, stampare o archiviare in modo affidabile.
Questo articolo ti guida attraverso metodi pratici per convertire ODT in PDF, coprendo strumenti online, software desktop e automazione basata su Python sia per conversioni occasionali che su larga scala.
Navigazione Rapida
- Cos'è un file ODT e perché convertirlo in PDF?
- Converti ODT in PDF online (strumenti gratuiti e basati sul web)
- Converti ODT in PDF utilizzando software desktop
- Converti ODT in PDF programmaticamente con Python
- Scegliere il metodo giusto per le tue esigenze
- Domande frequenti
Cos'è un file ODT e perché convertirlo in PDF?
Un file ODT è un documento di elaborazione testi basato sullo standard OpenDocument. È comunemente usato in ambienti che danno priorità ai formati aperti e alla compatibilità multipiattaforma. I file ODT supportano testo ricco, immagini, tabelle e stili, rendendoli adatti per la creazione di documenti di tutti i giorni.
Tuttavia, ODT non è universalmente supportato al di fuori delle applicazioni per ufficio. Quando i documenti devono essere condivisi con un pubblico più ampio, inviati formalmente o archiviati per un uso a lungo termine, il PDF diventa la scelta più pratica.
La conversione da ODT a PDF aiuta a soddisfare diverse esigenze comuni:
- Layout coerente: i PDF vengono visualizzati allo stesso modo su tutti i dispositivi e sistemi operativi.
- Compatibilità migliorata: i lettori PDF sono ampiamente disponibili e non richiedono software di modifica.
- Integrità del documento: i PDF riducono il rischio di modifiche accidentali del contenuto.
- Distribuzione professionale: i PDF sono spesso preferiti per rapporti, contratti e documenti ufficiali.
Converti ODT in PDF online (strumenti gratuiti e basati sul web)
I convertitori online sono spesso il modo più veloce per convertire un file ODT in PDF, specialmente per gli utenti che necessitano solo di conversioni occasionali e non vogliono installare software aggiuntivo.
Passo dopo passo: converti ODT in PDF online
- Apri un servizio di conversione da ODT a PDF basato sul web nel tuo browser (ad esempio, CloudXDocs ODT to PDF Converter).
- Carica il file ODT dal tuo dispositivo locale o da un archivio cloud supportato.
- Attendi mentre il file viene elaborato e convertito sul server.
- Scarica il file PDF risultante sul tuo computer.
La maggior parte degli strumenti online segue questo semplice flusso di lavoro, rendendoli accessibili anche agli utenti non tecnici.
Vantaggi della conversione online
- Nessuna installazione o configurazione richiesta
- Accessibile da qualsiasi browser moderno
- Adatto per conversioni rapide e una tantum
- Spesso disponibile gratuitamente con un utilizzo di base
Limitazioni dei convertitori online
Gli strumenti online in genere impongono limiti di dimensione dei file o limiti di conversione giornalieri. Il caricamento di documenti su server di terze parti potrebbe anche non essere adatto per file riservati o sensibili. Inoltre, la formattazione complessa, come caratteri personalizzati o layout avanzati, potrebbe non essere sempre conservata accuratamente e la conversione batch è raramente supportata.
Nei casi in cui sono richieste modifiche e collaborazione, la conversione di file ODT in formato Word può essere un'opzione più pratica del PDF.
Converti ODT in PDF utilizzando software desktop
Le applicazioni per ufficio desktop forniscono un ambiente più controllato per la conversione di file ODT in PDF. Sia LibreOffice che Apache OpenOffice includono funzionalità di esportazione PDF integrate.
Passo dopo passo: converti ODT in PDF con LibreOffice o OpenOffice
- Apri il file ODT in LibreOffice Writer (o Apache OpenOffice Writer).
- Rivedi il documento per assicurarti che la formattazione e il layout siano corretti.
- Fai clic su File e seleziona Esporta come PDF.
- Configura le opzioni di esportazione come la qualità dell'immagine, l'incorporamento dei caratteri o l'intervallo di pagine.
- Salva il file PDF esportato sul tuo sistema locale.
Questo approccio offre agli utenti una maggiore fiducia nell'output finale, in particolare per i documenti visivamente complessi.
Vantaggi della conversione basata su desktop
- Migliore conservazione della formattazione e del layout
- Non è necessario caricare file su server esterni
- Maggiore controllo sulle impostazioni di esportazione PDF
- Affidabile per documenti con tabelle, immagini e stili
Limitazioni della conversione manuale
La conversione manuale richiede l'interazione dell'utente per ogni documento, rendendola inefficiente per flussi di lavoro ad alto volume. È anche difficile da automatizzare e non adatta per ambienti lato server o headless in cui non è disponibile un'interfaccia grafica.
Quando i metodi online e manuali non sono sufficienti
Ci sono molti scenari in cui gli strumenti online e il software desktop non soddisfano più i requisiti pratici. Man mano che il volume dei documenti aumenta o i flussi di lavoro diventano più complessi, la conversione manuale si trasforma rapidamente in un collo di bottiglia.
Le situazioni tipiche in cui i metodi tradizionali non sono sufficienti includono:
- Conversione di un gran numero di file ODT su base regolare
- Esecuzione automatica delle conversioni su un server o sistema backend
- Integrazione della conversione di documenti in un'applicazione o servizio esistente
- Garantire un output coerente senza l'intervento dell'utente
- Operare in ambienti senza un'interfaccia grafica
In questi casi, un approccio programmatico offre maggiore affidabilità, scalabilità e controllo.
Converti ODT in PDF programmaticamente con Python
Python è ampiamente utilizzato per l'automazione, l'elaborazione dei dati e lo sviluppo di backend. L'utilizzo di Python per convertire i file ODT in PDF consente di automatizzare completamente il processo e di integrarlo in sistemi più grandi.
Perché usare Python per la conversione da ODT a PDF?
Python consente l'elaborazione batch, flussi di lavoro ripetibili e una perfetta integrazione con le applicazioni esistenti. Una volta implementate, le conversioni possono essere eseguite senza supervisione, garantendo risultati coerenti e riducendo lo sforzo manuale.
Utilizzo di Spire.Doc per Python
Spire.Doc per Python è una libreria di elaborazione di documenti che supporta i formati OpenDocument e consente la conversione diretta da ODT a PDF. Conserva testo, immagini e layout senza fare affidamento su Microsoft Word o LibreOffice, rendendolo adatto per l'uso lato server e aziendale.
Installazione
Spire.Doc per Python può essere installato tramite pip:
pip install spire-doc
Esempio: converti ODT in PDF con Python
from spire.doc import Document, FileFormat

# Create a Document object and load the ODT file
doc = Document()
doc.LoadFromFile("Sample.odt", FileFormat.Odt)

# Save the ODT document as a PDF file
doc.SaveToFile("output/ODTToPDF.pdf", FileFormat.PDF)
doc.Close()
Di seguito è riportata un'anteprima del file PDF convertito da ODT utilizzando Python:
Questo approccio può essere facilmente esteso per gestire conversioni batch o integrato in flussi di lavoro automatizzati.
Dopo aver convertito il file ODT in PDF, puoi modificare ulteriormente il PDF generato utilizzando Python, ad esempio aggiungendo filigrane, impostando metadati o applicando opzioni di sicurezza aggiuntive.
Salva ODT come PDF in uno stream (opzionale)
Nelle applicazioni backend o basate sul web, potresti voler generare un file PDF in memoria senza scriverlo su disco. Spire.Doc per Python consente di salvare il documento convertito in uno stream.
from spire.doc import Document, FileFormat, Stream

doc = Document()
doc.LoadFromFile("Sample.odt", FileFormat.Odt)

# Save the ODT document to a PDF stream
pdf_stream = Stream()
doc.SaveToStream(pdf_stream, FileFormat.PDF)
doc.Close()

# Get PDF bytes from the stream
pdf_bytes = bytes(pdf_stream.ToArray())
Questo approccio è utile per restituire file PDF nelle API web, caricarli su un archivio cloud o elaborare documenti in memoria.
Se il tuo flusso di lavoro richiede un'ulteriore elaborazione dei file PDF in memoria, come l'unione di documenti, l'aggiunta di filigrane o l'applicazione di impostazioni di sicurezza, potresti trovare utile esplorare le tecniche per lavorare con i documenti PDF direttamente negli stream.
Scegliere il metodo giusto per le tue esigenze
Il modo migliore per convertire ODT in PDF dipende dalla frequenza con cui si esegue l'attività e dal livello di controllo richiesto.
- Gli strumenti online sono ideali per conversioni rapide e occasionali quando la praticità è la priorità.
- Il software desktop funziona bene per gli utenti che necessitano di un migliore controllo della formattazione e convertono i file manualmente.
- L'automazione basata su Python è l'opzione più adatta per l'elaborazione su larga scala, i sistemi backend e i flussi di lavoro aziendali.
Comprendere il tuo scenario di utilizzo aiuta a garantire la scelta di un metodo che bilanci efficienza, affidabilità e manutenibilità.
Domande frequenti sulla conversione da ODT a PDF
È sicuro convertire ODT in PDF online?
I convertitori online possono essere convenienti per i documenti non sensibili, ma potrebbero non essere adatti per i documenti sensibili a causa di problemi di privacy.
La formattazione del documento cambierà dopo la conversione?
I documenti semplici di solito vengono convertiti accuratamente, mentre i layout complessi possono trarre vantaggio da metodi desktop o programmatici.
È possibile convertire più file ODT contemporaneamente?
La conversione batch è raramente supportata dagli strumenti online ed è inefficiente manualmente. Le soluzioni programmatiche gestiscono questo problema in modo più efficace.
Le conversioni basate su Python richiedono un software per ufficio?
No. Librerie come Spire.Doc per Python funzionano indipendentemente dalle applicazioni per ufficio.
Conclusione
La conversione di file ODT in PDF può essere eseguita in diversi modi, ognuno adatto a esigenze diverse. Gli strumenti online e le applicazioni desktop sono efficaci per l'uso quotidiano, mentre l'automazione basata su Python fornisce una soluzione scalabile per scenari avanzati e ad alto volume. Selezionando il metodo appropriato, è possibile garantire una conversione dei documenti accurata, efficiente e affidabile.
Vedi anche
Convertir ODT en PDF facilement : outils gratuits et Python
Table des matières
Les fichiers ODT (OpenDocument Text) sont largement utilisés pour créer et modifier des documents dans LibreOffice ou Apache OpenOffice. Cependant, le partage ou la distribution de fichiers ODT peut être peu pratique, car tous les appareils ou plates-formes ne prennent pas en charge ce format. La conversion des fichiers ODT en PDF garantit que la mise en page, les polices et le formatage de votre document restent intacts, ce qui facilite le partage, l'impression ou l'archivage de manière fiable.
Cet article vous guide à travers des méthodes pratiques pour convertir ODT en PDF, couvrant les outils en ligne, les logiciels de bureau et l'automatisation basée sur Python pour les conversions occasionnelles et à grande échelle.
Navigation rapide
- Qu'est-ce qu'un fichier ODT et pourquoi le convertir en PDF ?
- Convertir ODT en PDF en ligne (Outils gratuits et basés sur le Web)
- Convertir ODT en PDF à l'aide d'un logiciel de bureau
- Convertir ODT en PDF par programmation avec Python
- Choisir la bonne méthode pour vos besoins
- FAQ
Qu'est-ce qu'un fichier ODT et pourquoi le convertir en PDF ?
Un fichier ODT est un document de traitement de texte basé sur la norme OpenDocument. Il est couramment utilisé dans les environnements qui privilégient les formats ouverts et la compatibilité multiplateforme. Les fichiers ODT prennent en charge le texte enrichi, les images, les tableaux et les styles, ce qui les rend adaptés à la création de documents quotidiens.
Cependant, l'ODT n'est pas universellement pris en charge en dehors des applications de bureau. Lorsque des documents doivent être partagés avec un public plus large, soumis officiellement ou archivés pour une utilisation à long terme, le PDF devient le choix le plus pratique.
La conversion d'ODT en PDF permet de répondre à plusieurs besoins courants :
- Mise en page cohérente : les PDF s'affichent de la même manière sur tous les appareils et systèmes d'exploitation.
- Compatibilité améliorée : les lecteurs de PDF sont largement disponibles et ne nécessitent aucun logiciel d'édition.
- Intégrité du document : les PDF réduisent le risque de modifications accidentelles du contenu.
- Distribution professionnelle : les PDF sont souvent préférés pour les rapports, les contrats et les documents officiels.
Convertir ODT en PDF en ligne (Outils gratuits et basés sur le Web)
Les convertisseurs en ligne sont souvent le moyen le plus rapide de convertir un fichier ODT en PDF, en particulier pour les utilisateurs qui n'ont besoin que de conversions occasionnelles et ne souhaitent pas installer de logiciel supplémentaire.
Étape par étape : Convertir ODT en PDF en ligne
- Ouvrez un service de conversion ODT en PDF basé sur le Web dans votre navigateur (par exemple, CloudXDocs ODT to PDF Converter).
- Téléchargez le fichier ODT depuis votre appareil local ou un stockage cloud pris en charge.
- Attendez que le fichier soit traité et converti sur le serveur.
- Téléchargez le fichier PDF résultant sur votre ordinateur.
La plupart des outils en ligne suivent ce flux de travail simple, ce qui les rend accessibles même aux utilisateurs non techniques.
Avantages de la conversion en ligne
- Aucune installation ou configuration requise
- Accessible depuis n'importe quel navigateur moderne
- Convient pour les conversions rapides et uniques
- Souvent disponible gratuitement avec une utilisation de base
Limites des convertisseurs en ligne
Les outils en ligne imposent généralement des limites de taille de fichier ou des plafonds de conversion quotidiens. Le téléchargement de documents sur des serveurs tiers peut également ne pas convenir aux fichiers confidentiels ou sensibles. De plus, les mises en forme complexes, telles que les polices personnalisées ou les mises en page avancées, peuvent ne pas toujours être préservées avec précision, et la conversion par lots est rarement prise en charge.
Dans les cas où l'édition et la collaboration sont nécessaires, la conversion de fichiers ODT au format Word peut être une option plus pratique que le PDF.
Convertir ODT en PDF à l'aide d'un logiciel de bureau
Les applications de bureau offrent un environnement plus contrôlé pour la conversion de fichiers ODT en PDF. LibreOffice et Apache OpenOffice incluent tous deux une fonctionnalité d'exportation PDF intégrée.
Étape par étape : Convertir ODT en PDF avec LibreOffice ou OpenOffice
- Ouvrez le fichier ODT dans LibreOffice Writer (ou Apache OpenOffice Writer).
- Vérifiez le document pour vous assurer que la mise en forme et la mise en page sont correctes.
- Cliquez sur Fichier et sélectionnez Exporter au format PDF.
- Configurez les options d'exportation telles que la qualité de l'image, l'incorporation des polices ou la plage de pages.
- Enregistrez le fichier PDF exporté sur votre système local.
Cette approche donne aux utilisateurs une plus grande confiance dans le résultat final, en particulier pour les documents visuellement complexes.
Avantages de la conversion basée sur le bureau
- Meilleure préservation de la mise en forme et de la mise en page
- Pas besoin de télécharger des fichiers sur des serveurs externes
- Plus grand contrôle sur les paramètres d'exportation PDF
- Fiable pour les documents avec des tableaux, des images et des styles
Limites de la conversion manuelle
La conversion manuelle nécessite une interaction de l'utilisateur pour chaque document, ce qui la rend inefficace pour les flux de travail à volume élevé. Il est également difficile à automatiser et ne convient pas aux environnements côté serveur ou sans tête où aucune interface graphique n'est disponible.
Quand les méthodes en ligne et manuelles ne suffisent pas
Il existe de nombreux scénarios où les outils en ligne et les logiciels de bureau ne répondent plus aux exigences pratiques. À mesure que le volume de documents augmente ou que les flux de travail deviennent plus complexes, la conversion manuelle se transforme rapidement en goulot d'étranglement.
Les situations typiques où les méthodes traditionnelles échouent incluent :
- Conversion de grands nombres de fichiers ODT de manière régulière
- Exécution automatique des conversions sur un système serveur ou backend
- Intégration de la conversion de documents dans une application ou un service existant
- Garantir une sortie cohérente sans intervention de l'utilisateur
- Fonctionnement dans des environnements sans interface graphique
Dans ces cas, une approche programmatique offre une plus grande fiabilité, évolutivité et contrôle.
Convertir ODT en PDF par programmation avec Python
Python est largement utilisé pour l'automatisation, le traitement des données et le développement backend. L'utilisation de Python pour convertir des fichiers ODT en PDF permet d'automatiser entièrement le processus et de l'intégrer dans des systèmes plus vastes.
Pourquoi utiliser Python pour la conversion d'ODT en PDF ?
Python permet le traitement par lots, les flux de travail reproductibles et une intégration transparente avec les applications existantes. Une fois mises en œuvre, les conversions peuvent s'exécuter sans surveillance, garantissant des résultats cohérents tout en réduisant l'effort manuel.
Utilisation de Spire.Doc pour Python
Spire.Doc pour Python est une bibliothèque de traitement de documents qui prend en charge les formats OpenDocument et permet la conversion directe d'ODT en PDF. Il préserve le texte, les images et la mise en page sans dépendre de Microsoft Word ou de LibreOffice, ce qui le rend adapté à une utilisation côté serveur et en entreprise.
Installation
Spire.Doc pour Python peut être installé via pip :
pip install spire-doc
Exemple : Convertir ODT en PDF avec Python
from spire.doc import Document, FileFormat

# Create a Document object and load the ODT file
doc = Document()
doc.LoadFromFile("Sample.odt", FileFormat.Odt)

# Save the ODT document as a PDF file
doc.SaveToFile("output/ODTToPDF.pdf", FileFormat.PDF)
doc.Close()
Voici un aperçu du fichier PDF converti à partir d'ODT à l'aide de Python :
Cette approche peut facilement être étendue pour gérer les conversions par lots ou intégrée dans des flux de travail automatisés.
Après avoir converti le fichier ODT en PDF, vous pouvez modifier davantage le PDF généré à l'aide de Python, par exemple en ajoutant des filigranes, en définissant des métadonnées ou en appliquant des options de sécurité supplémentaires.
Enregistrer ODT en tant que PDF dans un flux (facultatif)
Dans les applications backend ou Web, vous souhaiterez peut-être générer un fichier PDF en mémoire sans l'écrire sur le disque. Spire.Doc pour Python permet d'enregistrer le document converti dans un flux.
from spire.doc import Document, FileFormat, Stream

doc = Document()
doc.LoadFromFile("Sample.odt", FileFormat.Odt)

# Save the ODT document to a PDF stream
pdf_stream = Stream()
doc.SaveToStream(pdf_stream, FileFormat.PDF)
doc.Close()

# Get PDF bytes from the stream
pdf_bytes = bytes(pdf_stream.ToArray())
Cette approche est utile pour renvoyer des fichiers PDF dans des API Web, les télécharger sur un stockage cloud ou traiter des documents en mémoire.
Si votre flux de travail nécessite un traitement plus approfondi des fichiers PDF en mémoire, comme la fusion de documents, l'ajout de filigranes ou l'application de paramètres de sécurité, il peut être utile d'explorer des techniques pour travailler avec des documents PDF directement dans des flux.
Choisir la bonne méthode pour vos besoins
La meilleure façon de convertir ODT en PDF dépend de la fréquence à laquelle vous effectuez la tâche et du niveau de contrôle requis.
- Les outils en ligne sont idéaux pour les conversions rapides et occasionnelles lorsque la commodité est la priorité.
- Les logiciels de bureau conviennent bien aux utilisateurs qui ont besoin d'un meilleur contrôle de la mise en forme et qui convertissent les fichiers manuellement.
- L'automatisation basée sur Python est l'option la plus appropriée pour le traitement à grande échelle, les systèmes backend et les flux de travail d'entreprise.
Comprendre votre scénario d'utilisation vous aide à choisir une méthode qui équilibre efficacité, fiabilité et maintenabilité.
FAQ sur la conversion d'ODT en PDF
Est-il sûr de convertir ODT en PDF en ligne ?
Les convertisseurs en ligne peuvent être pratiques pour les documents non sensibles, mais ils peuvent ne pas convenir aux documents sensibles en raison de problèmes de confidentialité.
La mise en forme du document changera-t-elle après la conversion ?
Les documents simples se convertissent généralement avec précision, tandis que les mises en page complexes peuvent bénéficier de méthodes de bureau ou programmatiques.
Plusieurs fichiers ODT peuvent-ils être convertis en même temps ?
La conversion par lots est rarement prise en charge par les outils en ligne et est inefficace manuellement. Les solutions programmatiques gèrent cela plus efficacement.
Les conversions basées sur Python nécessitent-elles un logiciel de bureau ?
Non. Les bibliothèques telles que Spire.Doc pour Python fonctionnent indépendamment des applications de bureau.
Conclusion
La conversion de fichiers ODT en PDF peut être accomplie de plusieurs manières, chacune adaptée à des besoins différents. Les outils en ligne et les applications de bureau sont efficaces pour un usage quotidien, tandis que l'automatisation basée sur Python offre une solution évolutive pour les scénarios avancés et à volume élevé. En sélectionnant la méthode appropriée, vous pouvez garantir une conversion de documents précise, efficace et fiable.
Voir aussi
Conversión de ODT a PDF simplificada: herramientas gratuitas y Python
Tabla de Contenidos
Los archivos ODT (OpenDocument Text) se utilizan ampliamente para crear y editar documentos en LibreOffice o Apache OpenOffice. Sin embargo, compartir o distribuir archivos ODT puede ser inconveniente, ya que no todos los dispositivos o plataformas admiten este formato. Convertir archivos ODT a PDF garantiza que el diseño, las fuentes y el formato de su documento permanezcan intactos, lo que facilita compartirlo, imprimirlo o archivarlo de manera confiable.
Este artículo lo guía a través de métodos prácticos para convertir ODT a PDF, cubriendo herramientas en línea, software de escritorio y automatización basada en Python para conversiones tanto ocasionales como a gran escala.
Navegación Rápida
- ¿Qué es un archivo ODT y por qué convertirlo a PDF?
- Convertir ODT a PDF en línea (herramientas gratuitas y basadas en la web)
- Convertir ODT a PDF usando software de escritorio
- Convertir ODT a PDF programáticamente con Python
- Elegir el método adecuado para sus necesidades
- Preguntas Frecuentes
¿Qué es un archivo ODT y por qué convertirlo a PDF?
Un archivo ODT es un documento de procesamiento de texto basado en el estándar OpenDocument. Se utiliza comúnmente en entornos que priorizan los formatos abiertos y la compatibilidad multiplataforma. Los archivos ODT admiten texto enriquecido, imágenes, tablas y estilos, lo que los hace adecuados para la creación de documentos cotidianos.
Sin embargo, ODT no es universalmente compatible fuera de las aplicaciones de oficina. Cuando los documentos necesitan ser compartidos con una audiencia más amplia, presentados formalmente o archivados para uso a largo plazo, el PDF se convierte en la opción más práctica.
Convertir ODT a PDF ayuda a abordar varias necesidades comunes:
- Diseño consistente: los archivos PDF se muestran de la misma manera en todos los dispositivos y sistemas operativos.
- Compatibilidad mejorada: los lectores de PDF están ampliamente disponibles y no requieren software de edición.
- Integridad del documento: los archivos PDF reducen el riesgo de cambios accidentales en el contenido.
- Distribución profesional: los archivos PDF a menudo se prefieren para informes, contratos y documentos oficiales.
Convertir ODT a PDF en línea (herramientas gratuitas y basadas en la web)
Los convertidores en línea suelen ser la forma más rápida de convertir un archivo ODT a PDF, especialmente para los usuarios que solo necesitan conversiones ocasionales y no quieren instalar software adicional.
Paso a paso: Convertir ODT a PDF en línea
- Abra un servicio de conversión de ODT a PDF basado en la web en su navegador (por ejemplo, CloudXDocs ODT to PDF Converter).
- Cargue el archivo ODT desde su dispositivo local o almacenamiento en la nube compatible.
- Espere mientras el archivo se procesa y convierte en el servidor.
- Descargue el archivo PDF resultante en su computadora.
La mayoría de las herramientas en línea siguen este flujo de trabajo simple, lo que las hace accesibles incluso para usuarios no técnicos.
Ventajas de la conversión en línea
- No se requiere instalación ni configuración
- Accesible desde cualquier navegador moderno
- Adecuado para conversiones rápidas y únicas
- A menudo disponible de forma gratuita con un uso básico
Limitaciones de los convertidores en línea
Las herramientas en línea suelen imponer límites de tamaño de archivo o topes de conversión diarios. Cargar documentos en servidores de terceros también puede ser inadecuado para archivos confidenciales o sensibles. Además, es posible que el formato complejo, como fuentes personalizadas o diseños avanzados, no siempre se conserve con precisión, y la conversión por lotes rara vez es compatible.
En los casos en que se requiere edición y colaboración, convertir archivos ODT a formato Word puede ser una opción más práctica que el PDF.
Convertir ODT a PDF usando software de escritorio
Las aplicaciones de oficina de escritorio proporcionan un entorno más controlado para convertir archivos ODT a PDF. Tanto LibreOffice como Apache OpenOffice incluyen una funcionalidad de exportación a PDF incorporada.
Paso a paso: Convertir ODT a PDF con LibreOffice u OpenOffice
- Abra el archivo ODT en LibreOffice Writer (o Apache OpenOffice Writer).
- Revise el documento para asegurarse de que el formato y el diseño sean correctos.
- Haga clic en Archivo y seleccione Exportar como PDF.
- Configure las opciones de exportación, como la calidad de la imagen, la incrustación de fuentes o el rango de páginas.
- Guarde el archivo PDF exportado en su sistema local.
Este enfoque brinda a los usuarios una mayor confianza en el resultado final, especialmente para documentos visualmente complejos.
Ventajas de la conversión basada en escritorio
- Mejor conservación del formato y el diseño
- No es necesario cargar archivos en servidores externos
- Mayor control sobre la configuración de exportación de PDF
- Confiable para documentos con tablas, imágenes y estilos
Limitaciones de la conversión manual
La conversión manual requiere la interacción del usuario para cada documento, lo que la hace ineficiente para flujos de trabajo de gran volumen. También es difícil de automatizar e inadecuado para entornos del lado del servidor o sin cabeza donde no hay una interfaz gráfica disponible.
Cuando los métodos en línea y manuales no son suficientes
Hay muchos escenarios en los que las herramientas en línea y el software de escritorio ya no cumplen con los requisitos prácticos. A medida que aumenta el volumen de documentos o los flujos de trabajo se vuelven más complejos, la conversión manual se convierte rápidamente en un cuello de botella.
Las situaciones típicas en las que los métodos tradicionales se quedan cortos incluyen:
- Convertir grandes cantidades de archivos ODT de forma regular
- Ejecutar conversiones automáticamente en un servidor o sistema backend
- Integrar la conversión de documentos en una aplicación o servicio existente
- Garantizar una salida consistente sin intervención del usuario
- Operar en entornos sin una interfaz gráfica
En estos casos, un enfoque programático proporciona mayor confiabilidad, escalabilidad y control.
Convertir ODT a PDF programáticamente con Python
Python se utiliza ampliamente para la automatización, el procesamiento de datos y el desarrollo de backend. Usar Python para convertir archivos ODT a PDF permite que el proceso se automatice por completo y se integre en sistemas más grandes.
¿Por qué usar Python para la conversión de ODT a PDF?
Python permite el procesamiento por lotes, flujos de trabajo repetibles y una integración perfecta con las aplicaciones existentes. Una vez implementadas, las conversiones pueden ejecutarse sin supervisión, lo que garantiza resultados consistentes y reduce el esfuerzo manual.
Uso de Spire.Doc para Python
Spire.Doc para Python es una biblioteca de procesamiento de documentos que admite formatos OpenDocument y permite la conversión directa de ODT a PDF. Conserva texto, imágenes y diseño sin depender de Microsoft Word o LibreOffice, lo que lo hace adecuado para uso empresarial y del lado del servidor.
Instalación
Spire.Doc para Python se puede instalar a través de pip:
pip install spire-doc
Ejemplo: Convertir ODT a PDF con Python
from spire.doc import Document, FileFormat

# Create a Document object and load the ODT file
doc = Document()
doc.LoadFromFile("Sample.odt", FileFormat.Odt)

# Save the ODT document as a PDF file
doc.SaveToFile("output/ODTToPDF.pdf", FileFormat.PDF)
doc.Close()
A continuación se muestra una vista previa del archivo PDF convertido desde ODT usando Python:
Este enfoque se puede ampliar fácilmente para manejar conversiones por lotes o integrarse en flujos de trabajo automatizados.
Después de convertir el archivo ODT a PDF, puede editar más el PDF generado usando Python, como agregar marcas de agua, establecer metadatos o aplicar opciones de seguridad adicionales.
Guardar ODT como PDF en una secuencia (Opcional)
En aplicaciones de backend o basadas en la web, es posible que desee generar un archivo PDF en la memoria sin escribirlo en el disco. Spire.Doc para Python permite guardar el documento convertido en una secuencia.
from spire.doc import Document, FileFormat, Stream

doc = Document()
doc.LoadFromFile("Sample.odt", FileFormat.Odt)

# Save the ODT document to a PDF stream
pdf_stream = Stream()
doc.SaveToStream(pdf_stream, FileFormat.PDF)
doc.Close()

# Get PDF bytes from the stream
pdf_bytes = bytes(pdf_stream.ToArray())
Este enfoque es útil para devolver archivos PDF en API web, cargarlos en el almacenamiento en la nube o procesar documentos en la memoria.
Si su flujo de trabajo requiere un procesamiento adicional de archivos PDF en la memoria, como fusionar documentos, agregar marcas de agua o aplicar configuraciones de seguridad, puede resultarle útil explorar técnicas para trabajar con documentos PDF directamente en secuencias.
Elegir el método adecuado para sus necesidades
La mejor manera de convertir ODT a PDF depende de la frecuencia con la que realice la tarea y del nivel de control requerido.
- Las herramientas en línea son ideales para conversiones rápidas y ocasionales cuando la conveniencia es la prioridad.
- El software de escritorio funciona bien para los usuarios que necesitan un mejor control del formato y convierten archivos manualmente.
- La automatización basada en Python es la opción más adecuada para el procesamiento a gran escala, los sistemas de backend y los flujos de trabajo empresariales.
Comprender su escenario de uso ayuda a garantizar que elija un método que equilibre la eficiencia, la confiabilidad y la mantenibilidad.
Preguntas frecuentes sobre la conversión de ODT a PDF
¿Es seguro convertir ODT a PDF en línea?
Los convertidores en línea pueden ser convenientes para documentos no sensibles, pero pueden no ser adecuados para documentos sensibles debido a preocupaciones de privacidad.
¿Cambiará el formato del documento después de la conversión?
Los documentos simples generalmente se convierten con precisión, mientras que los diseños complejos pueden beneficiarse de los métodos de escritorio o programáticos.
¿Se pueden convertir varios archivos ODT a la vez?
La conversión por lotes rara vez es compatible con las herramientas en línea y es ineficiente manualmente. Las soluciones programáticas manejan esto de manera más efectiva.
¿Las conversiones basadas en Python requieren software de oficina?
No. Las bibliotecas como Spire.Doc para Python funcionan independientemente de las aplicaciones de oficina.
Conclusión
La conversión de archivos ODT a PDF se puede lograr de varias maneras, cada una adaptada a diferentes necesidades. Las herramientas en línea y las aplicaciones de escritorio son efectivas para el uso diario, mientras que la automatización basada en Python proporciona una solución escalable para escenarios avanzados y de gran volumen. Al seleccionar el método apropiado, puede garantizar una conversión de documentos precisa, eficiente y confiable.
Ver también
ODT in PDF umwandeln leicht gemacht: Kostenlose Tools & Python
Inhaltsverzeichnis
- Was ist eine ODT-Datei und warum sollte man sie in PDF konvertieren?
- ODT in PDF online konvertieren (kostenlose und webbasierte Tools)
- ODT in PDF mit Desktop-Software konvertieren
- ODT programmgesteuert mit Python in PDF konvertieren
- Die richtige Methode für Ihre Bedürfnisse wählen
- Häufig gestellte Fragen
ODT-Dateien (OpenDocument Text) werden häufig zum Erstellen und Bearbeiten von Dokumenten in LibreOffice oder Apache OpenOffice verwendet. Das Teilen oder Verteilen von ODT-Dateien kann jedoch unpraktisch sein, da nicht alle Geräte oder Plattformen dieses Format unterstützen. Das Konvertieren von ODT-Dateien in PDF stellt sicher, dass Ihr Dokumentenlayout, Ihre Schriftarten und Ihre Formatierung erhalten bleiben, was das zuverlässige Teilen, Drucken oder Archivieren erleichtert.
Dieser Artikel führt Sie durch praktische Methoden zur Konvertierung von ODT in PDF und behandelt Online-Tools, Desktop-Software und Python-basierte Automatisierung für gelegentliche und umfangreiche Konvertierungen.
Schnellnavigation
- Was ist eine ODT-Datei und warum sollte man sie in PDF konvertieren?
- ODT in PDF online konvertieren (kostenlose und webbasierte Tools)
- ODT in PDF mit Desktop-Software konvertieren
- ODT programmgesteuert mit Python in PDF konvertieren
- Die richtige Methode für Ihre Bedürfnisse wählen
- Häufig gestellte Fragen
Was ist eine ODT-Datei und warum sollte man sie in PDF konvertieren?
Eine ODT-Datei ist ein Textverarbeitungsdokument, das auf dem OpenDocument-Standard basiert. Es wird häufig in Umgebungen verwendet, die offene Formate und plattformübergreifende Kompatibilität priorisieren. ODT-Dateien unterstützen Rich-Text, Bilder, Tabellen und Stile und eignen sich daher für die alltägliche Dokumentenerstellung.
Allerdings wird ODT außerhalb von Office-Anwendungen nicht universell unterstützt. Wenn Dokumente mit einem breiteren Publikum geteilt, formell eingereicht oder für die langfristige Nutzung archiviert werden müssen, ist PDF die praktischere Wahl.
Die Konvertierung von ODT in PDF hilft, mehrere häufige Anforderungen zu erfüllen:
- Einheitliches Layout: PDFs werden auf allen Geräten und Betriebssystemen gleich angezeigt.
- Verbesserte Kompatibilität: PDF-Reader sind weit verbreitet und erfordern keine Bearbeitungssoftware.
- Dokumentenintegrität: PDFs verringern das Risiko versehentlicher Inhaltsänderungen.
- Professionelle Verteilung: PDFs werden oft für Berichte, Verträge und offizielle Dokumente bevorzugt.
ODT in PDF online konvertieren (kostenlose und webbasierte Tools)
Online-Konverter sind oft der schnellste Weg, eine ODT-Datei in PDF zu konvertieren, insbesondere für Benutzer, die nur gelegentliche Konvertierungen benötigen und keine zusätzliche Software installieren möchten.
Schritt-für-Schritt: ODT online in PDF konvertieren
- Öffnen Sie einen webbasierten ODT-zu-PDF-Konvertierungsdienst in Ihrem Browser (zum Beispiel CloudXDocs ODT to PDF Converter).
- Laden Sie die ODT-Datei von Ihrem lokalen Gerät oder einem unterstützten Cloud-Speicher hoch.
- Warten Sie, während die Datei auf dem Server verarbeitet und konvertiert wird.
- Laden Sie die resultierende PDF-Datei auf Ihren Computer herunter.
Die meisten Online-Tools folgen diesem einfachen Arbeitsablauf und sind daher auch für nicht-technische Benutzer zugänglich.
Vorteile der Online-Konvertierung
- Keine Installation oder Einrichtung erforderlich
- Von jedem modernen Browser aus zugänglich
- Geeignet für schnelle, einmalige Konvertierungen
- Oft kostenlos bei grundlegender Nutzung verfügbar
Einschränkungen von Online-Konvertern
Online-Tools haben in der Regel Dateigrößenbeschränkungen oder tägliche Konvertierungslimits. Das Hochladen von Dokumenten auf Server von Drittanbietern kann auch für vertrauliche oder sensible Dateien ungeeignet sein. Darüber hinaus wird komplexe Formatierung – wie benutzerdefinierte Schriftarten oder erweiterte Layouts – möglicherweise nicht immer genau beibehalten, und die Stapelverarbeitung wird selten unterstützt.
In Fällen, in denen Bearbeitung und Zusammenarbeit erforderlich sind, kann die Konvertierung von ODT-Dateien in das Word-Format eine praktischere Option als PDF sein.
ODT in PDF mit Desktop-Software konvertieren
Desktop-Office-Anwendungen bieten eine kontrolliertere Umgebung für die Konvertierung von ODT-Dateien in PDF. Sowohl LibreOffice als auch Apache OpenOffice verfügen über eine integrierte PDF-Exportfunktion.
Schritt-für-Schritt: ODT mit LibreOffice oder OpenOffice in PDF konvertieren
- Öffnen Sie die ODT-Datei in LibreOffice Writer (oder Apache OpenOffice Writer).
- Überprüfen Sie das Dokument, um sicherzustellen, dass Formatierung und Layout korrekt sind.
- Klicken Sie auf Datei und wählen Sie Als PDF exportieren.
- Konfigurieren Sie Exportoptionen wie Bildqualität, Schrifteinbettung oder Seitenbereich.
- Speichern Sie die exportierte PDF-Datei auf Ihrem lokalen System.
Dieser Ansatz gibt den Benutzern mehr Vertrauen in das Endergebnis, insbesondere bei visuell komplexen Dokumenten.
Vorteile der Desktop-basierten Konvertierung
- Bessere Beibehaltung von Formatierung und Layout
- Kein Hochladen von Dateien auf externe Server erforderlich
- Größere Kontrolle über die PDF-Exporteinstellungen
- Zuverlässig für Dokumente mit Tabellen, Bildern und Stilen
Einschränkungen der manuellen Konvertierung
Die manuelle Konvertierung erfordert für jedes Dokument eine Benutzerinteraktion, was sie für Workflows mit hohem Volumen ineffizient macht. Sie ist auch schwer zu automatisieren und ungeeignet für serverseitige oder monitorlose Umgebungen, in denen keine grafische Benutzeroberfläche verfügbar ist.
Wenn Online- und manuelle Methoden nicht ausreichen
Es gibt viele Szenarien, in denen Online-Tools und Desktop-Software den praktischen Anforderungen nicht mehr genügen. Mit zunehmendem Dokumentenvolumen oder komplexeren Arbeitsabläufen wird die manuelle Konvertierung schnell zum Engpass.
Typische Situationen, in denen herkömmliche Methoden nicht ausreichen, sind:
- Regelmäßiges Konvertieren von großen Mengen an ODT-Dateien
- Automatisches Ausführen von Konvertierungen auf einem Server oder Backend-System
- Integration der Dokumentenkonvertierung in eine bestehende Anwendung oder einen Dienst
- Sicherstellung einer konsistenten Ausgabe ohne Benutzereingriff
- Betrieb in Umgebungen ohne grafische Benutzeroberfläche
In diesen Fällen bietet ein programmatischer Ansatz eine größere Zuverlässigkeit, Skalierbarkeit und Kontrolle.
ODT programmgesteuert mit Python in PDF konvertieren
Python wird häufig für die Automatisierung, Datenverarbeitung und Backend-Entwicklung verwendet. Die Verwendung von Python zur Konvertierung von ODT-Dateien in PDF ermöglicht die vollständige Automatisierung des Prozesses und die Integration in größere Systeme.
Warum Python für die ODT-zu-PDF-Konvertierung verwenden?
Python ermöglicht die Stapelverarbeitung, wiederholbare Arbeitsabläufe und eine nahtlose Integration in bestehende Anwendungen. Einmal implementiert, können Konvertierungen unbeaufsichtigt ausgeführt werden, was konsistente Ergebnisse gewährleistet und den manuellen Aufwand reduziert.
Verwendung von Spire.Doc für Python
Spire.Doc für Python ist eine Dokumentenverarbeitungsbibliothek, die OpenDocument-Formate unterstützt und eine direkte Konvertierung von ODT in PDF ermöglicht. Es bewahrt Text, Bilder und Layout, ohne auf Microsoft Word oder LibreOffice angewiesen zu sein, und eignet sich daher für den serverseitigen und unternehmensweiten Einsatz.
Installation
Spire.Doc für Python kann über pip installiert werden:
pip install spire-doc
Beispiel: ODT mit Python in PDF konvertieren
from spire.doc import Document, FileFormat

# Create a Document object and load the ODT file
doc = Document()
doc.LoadFromFile("Sample.odt", FileFormat.Odt)

# Save the ODT document as a PDF file
doc.SaveToFile("output/ODTToPDF.pdf", FileFormat.PDF)
doc.Close()
Unten sehen Sie eine Vorschau der mit Python aus ODT konvertierten PDF-Datei:
Dieser Ansatz kann leicht erweitert werden, um Stapelkonvertierungen zu verarbeiten oder in automatisierte Arbeitsabläufe integriert zu werden.
Nach der Konvertierung der ODT-Datei in PDF können Sie die generierte PDF-Datei mit Python weiter bearbeiten, z. B. Wasserzeichen hinzufügen, Metadaten festlegen oder zusätzliche Sicherheitsoptionen anwenden.
ODT als PDF in einen Stream speichern (Optional)
In Backend- oder webbasierten Anwendungen möchten Sie möglicherweise eine PDF-Datei im Speicher erstellen, ohne sie auf die Festplatte zu schreiben. Spire.Doc für Python ermöglicht das Speichern des konvertierten Dokuments in einem Stream.
from spire.doc import Document, FileFormat, Stream

doc = Document()
doc.LoadFromFile("Sample.odt", FileFormat.Odt)

# Save the ODT document to a PDF stream
pdf_stream = Stream()
doc.SaveToStream(pdf_stream, FileFormat.PDF)
doc.Close()

# Get PDF bytes from the stream
pdf_bytes = bytes(pdf_stream.ToArray())
Dieser Ansatz ist nützlich, um PDF-Dateien in Web-APIs zurückzugeben, in den Cloud-Speicher hochzuladen oder Dokumente im Speicher zu verarbeiten.
Wenn Ihr Arbeitsablauf eine weitere Verarbeitung von PDF-Dateien im Speicher erfordert – wie das Zusammenführen von Dokumenten, das Hinzufügen von Wasserzeichen oder das Anwenden von Sicherheitseinstellungen – kann es hilfreich sein, Techniken für das direkte Arbeiten mit PDF-Dokumenten in Streams zu erkunden.
Die richtige Methode für Ihre Bedürfnisse wählen
Die beste Methode zur Konvertierung von ODT in PDF hängt davon ab, wie oft Sie die Aufgabe ausführen und welches Maß an Kontrolle erforderlich ist.
- Online-Tools sind ideal für schnelle, gelegentliche Konvertierungen, bei denen die Bequemlichkeit im Vordergrund steht.
- Desktop-Software eignet sich gut für Benutzer, die eine bessere Formatierungskontrolle benötigen und Dateien manuell konvertieren.
- Python-basierte Automatisierung ist die am besten geeignete Option für die Verarbeitung in großem Maßstab, Backend-Systeme und Unternehmens-Workflows.
Das Verständnis Ihres Nutzungsszenarios hilft sicherzustellen, dass Sie eine Methode wählen, die Effizienz, Zuverlässigkeit und Wartbarkeit in Einklang bringt.
Häufig gestellte Fragen zur Konvertierung von ODT in PDF
Ist es sicher, ODT online in PDF zu konvertieren?
Online-Konverter können für nicht sensible Dokumente praktisch sein, sind aber aufgrund von Datenschutzbedenken möglicherweise nicht für sensible Dokumente geeignet.
Ändert sich die Dokumentformatierung nach der Konvertierung?
Einfache Dokumente werden in der Regel genau konvertiert, während komplexe Layouts von Desktop- oder programmatischen Methoden profitieren können.
Können mehrere ODT-Dateien auf einmal konvertiert werden?
Die Stapelverarbeitung wird von Online-Tools selten unterstützt und ist manuell ineffizient. Programmatische Lösungen bewältigen dies effektiver.
Erfordern Python-basierte Konvertierungen Office-Software?
Nein. Bibliotheken wie Spire.Doc für Python arbeiten unabhängig von Office-Anwendungen.
Fazit
Die Konvertierung von ODT-Dateien in PDF kann auf verschiedene Weisen erfolgen, die jeweils auf unterschiedliche Bedürfnisse zugeschnitten sind. Online-Tools und Desktop-Anwendungen sind für den täglichen Gebrauch effektiv, während die Python-basierte Automatisierung eine skalierbare Lösung für fortgeschrittene und hochvolumige Szenarien bietet. Durch die Auswahl der geeigneten Methode können Sie eine genaue, effiziente und zuverlässige Dokumentenkonvertierung sicherstellen.
Siehe auch
Легкая конвертация ODT в PDF: бесплатные инструменты и Python
Содержание
- Что такое файл ODT и зачем его конвертировать в PDF?
- Конвертировать ODT в PDF онлайн (бесплатные и веб-инструменты)
- Конвертировать ODT в PDF с помощью настольного программного обеспечения
- Программное преобразование ODT в PDF с помощью Python
- Выбор подходящего метода для ваших нужд
- Часто задаваемые вопросы
Файлы ODT (OpenDocument Text) широко используются для создания и редактирования документов в LibreOffice или Apache OpenOffice. Однако совместное использование или распространение файлов ODT может быть неудобным, поскольку не все устройства или платформы поддерживают этот формат. Преобразование файлов ODT в PDF гарантирует, что макет вашего документа, шрифты и форматирование останутся неизменными, что упрощает его совместное использование, печать или надежное архивирование.
В этой статье вы познакомитесь с практическими методами преобразования ODT в PDF, включая онлайн-инструменты, настольное программное обеспечение и автоматизацию на основе Python как для периодических, так и для крупномасштабных преобразований.
Быстрая навигация
- Что такое файл ODT и зачем его конвертировать в PDF?
- Конвертировать ODT в PDF онлайн (бесплатные и веб-инструменты)
- Конвертировать ODT в PDF с помощью настольного программного обеспечения
- Программное преобразование ODT в PDF с помощью Python
- Выбор подходящего метода для ваших нужд
- Часто задаваемые вопросы
Что такое файл ODT и зачем его конвертировать в PDF?
Файл ODT — это текстовый документ, основанный на стандарте OpenDocument. Он обычно используется в средах, где приоритет отдается открытым форматам и кроссплатформенной совместимости. Файлы ODT поддерживают форматированный текст, изображения, таблицы и стили, что делает их подходящими для повседневного создания документов.
Однако ODT не имеет универсальной поддержки за пределами офисных приложений. Когда документы необходимо предоставить более широкой аудитории, официально подать или заархивировать для длительного использования, PDF становится более практичным выбором.
Преобразование ODT в PDF помогает решить несколько общих задач:
- Единообразный макет: PDF-файлы отображаются одинаково на всех устройствах и операционных системах.
- Улучшенная совместимость: программы для чтения PDF-файлов широко доступны и не требуют программного обеспечения для редактирования.
- Целостность документа: PDF-файлы снижают риск случайного изменения содержимого.
- Профессиональное распространение: PDF-файлы часто предпочитают для отчетов, контрактов и официальных документов.
Конвертировать ODT в PDF онлайн (бесплатные и веб-инструменты)
Онлайн-конвертеры часто являются самым быстрым способом преобразования файла ODT в PDF, особенно для пользователей, которым требуются лишь периодические преобразования и которые не хотят устанавливать дополнительное программное обеспечение.
Пошаговая инструкция: конвертируйте ODT в PDF онлайн
- Откройте в браузере веб-сервис для конвертации ODT в PDF (например, CloudXDocs ODT to PDF Converter).
- Загрузите файл ODT с вашего локального устройства или из поддерживаемого облачного хранилища.
- Подождите, пока файл обрабатывается и конвертируется на сервере.
- Загрузите полученный PDF-файл на свой компьютер.
Большинство онлайн-инструментов следуют этому простому рабочему процессу, что делает их доступными даже для нетехнических пользователей.
Преимущества онлайн-конвертации
- Не требуется установка или настройка
- Доступно из любого современного браузера
- Подходит для быстрых, одноразовых преобразований
- Часто доступно бесплатно при базовом использовании
Ограничения онлайн-конвертеров
Онлайн-инструменты обычно устанавливают ограничения на размер файла или дневные лимиты на конвертацию. Загрузка документов на сторонние серверы также может быть неприемлемой для конфиденциальных или чувствительных файлов. Кроме того, сложное форматирование, такое как пользовательские шрифты или расширенные макеты, не всегда может быть сохранено точно, а пакетное преобразование поддерживается редко.
В случаях, когда требуется редактирование и совместная работа, преобразование файлов ODT в формат Word может быть более практичным вариантом, чем PDF.
Конвертировать ODT в PDF с помощью настольного программного обеспечения
Настольные офисные приложения предоставляют более контролируемую среду для преобразования файлов ODT в PDF. И LibreOffice, и Apache OpenOffice имеют встроенную функцию экспорта в PDF.
Пошаговая инструкция: конвертируйте ODT в PDF с помощью LibreOffice или OpenOffice
- Откройте файл ODT в LibreOffice Writer (или Apache OpenOffice Writer).
- Просмотрите документ, чтобы убедиться в правильности форматирования и макета.
- Нажмите Файл и выберите Экспортировать как PDF.
- Настройте параметры экспорта, такие как качество изображения, встраивание шрифтов или диапазон страниц.
- Сохраните экспортированный PDF-файл в вашей локальной системе.
Этот подход дает пользователям большую уверенность в конечном результате, особенно для визуально сложных документов.
Преимущества настольной конвертации
- Лучшее сохранение форматирования и макета
- Нет необходимости загружать файлы на внешние серверы
- Больший контроль над настройками экспорта в PDF
- Надежно для документов с таблицами, изображениями и стилями
Ограничения ручного преобразования
Ручное преобразование требует взаимодействия с пользователем для каждого документа, что делает его неэффективным для рабочих процессов с большим объемом. Его также сложно автоматизировать, и оно не подходит для серверных или безголовых сред, где графический интерфейс недоступен.
Когда онлайн и ручных методов недостаточно
Существует множество сценариев, когда онлайн-инструменты и настольное программное обеспечение больше не отвечают практическим требованиям. По мере увеличения объема документов или усложнения рабочих процессов ручное преобразование быстро превращается в узкое место.
Типичные ситуации, когда традиционные методы не справляются, включают:
- Регулярное преобразование большого количества файлов ODT
- Автоматический запуск преобразований на сервере или в бэкэнд-системе
- Интеграция преобразования документов в существующее приложение или сервис
- Обеспечение согласованного вывода без вмешательства пользователя
- Работа в средах без графического интерфейса
В этих случаях программный подход обеспечивает большую надежность, масштабируемость и контроль.
Программное преобразование ODT в PDF с помощью Python
Python широко используется для автоматизации, обработки данных и разработки бэкэнда. Использование Python для преобразования файлов ODT в PDF позволяет полностью автоматизировать процесс и интегрировать его в более крупные системы.
Зачем использовать Python для преобразования ODT в PDF?
Python обеспечивает пакетную обработку, повторяемые рабочие процессы и бесшовную интеграцию с существующими приложениями. После внедрения преобразования могут выполняться без участия пользователя, обеспечивая стабильные результаты при одновременном сокращении ручных усилий.
Использование Spire.Doc для Python
Spire.Doc для Python — это библиотека для обработки документов, которая поддерживает форматы OpenDocument и позволяет напрямую конвертировать ODT в PDF. Она сохраняет текст, изображения и макет, не полагаясь на Microsoft Word или LibreOffice, что делает ее подходящей для использования на сервере и в корпоративных средах.
Установка
Spire.Doc для Python можно установить с помощью pip:
pip install spire-doc
Пример: конвертируйте ODT в PDF с помощью Python
from spire.doc import Document, FileFormat

# Create a Document object and load the ODT file
doc = Document()
doc.LoadFromFile("Sample.odt", FileFormat.Odt)

# Save the ODT document as a PDF file
doc.SaveToFile("output/ODTToPDF.pdf", FileFormat.PDF)
doc.Close()
Ниже представлен предварительный просмотр PDF-файла, преобразованного из ODT с помощью Python:
Этот подход можно легко расширить для обработки пакетных преобразований или интегрировать в автоматизированные рабочие процессы.
После преобразования файла ODT в PDF вы можете дальше редактировать сгенерированный PDF с помощью Python, например, добавлять водяные знаки, устанавливать метаданные или применять дополнительные параметры безопасности.
Сохранить ODT как PDF в поток (необязательно)
В бэкэнд- или веб-приложениях может потребоваться сгенерировать PDF-файл в памяти, не записывая его на диск. Spire.Doc для Python позволяет сохранять преобразованный документ в поток.
from spire.doc import Document, FileFormat, Stream

doc = Document()
doc.LoadFromFile("Sample.odt", FileFormat.Odt)

# Save the ODT document to a PDF stream
pdf_stream = Stream()
doc.SaveToStream(pdf_stream, FileFormat.PDF)
doc.Close()

# Get PDF bytes from the stream
pdf_bytes = bytes(pdf_stream.ToArray())
Этот подход полезен для возврата PDF-файлов в веб-API, загрузки в облачное хранилище или обработки документов в памяти.
Если ваш рабочий процесс требует дальнейшей обработки PDF-файлов в памяти, например, объединения документов, добавления водяных знаков или применения настроек безопасности, вам может быть полезно изучить методы работы с PDF-документами непосредственно в потоках.
Выбор подходящего метода для ваших нужд
Лучший способ преобразования ODT в PDF зависит от того, как часто вы выполняете эту задачу и какой уровень контроля требуется.
- Онлайн-инструменты идеально подходят для быстрых, периодических преобразований, когда приоритетом является удобство.
- Настольное программное обеспечение хорошо подходит для пользователей, которым нужен лучший контроль над форматированием и которые конвертируют файлы вручную.
- Автоматизация на основе Python является наиболее подходящим вариантом для крупномасштабной обработки, бэкэнд-систем и корпоративных рабочих процессов.
Понимание вашего сценария использования поможет вам выбрать метод, который сбалансирует эффективность, надежность и удобство обслуживания.
Часто задаваемые вопросы о преобразовании ODT в PDF
Безопасно ли конвертировать ODT в PDF онлайн?
Онлайн-конвертеры могут быть удобны для неконфиденциальных документов, но они могут не подходить для конфиденциальных документов из-за соображений конфиденциальности.
Изменится ли форматирование документа после преобразования?
Простые документы обычно конвертируются точно, в то время как сложные макеты могут выиграть от использования настольных или программных методов.
Можно ли конвертировать несколько файлов ODT одновременно?
Пакетное преобразование редко поддерживается онлайн-инструментами и неэффективно вручную. Программные решения справляются с этим более эффективно.
Требуют ли преобразования на основе Python офисного программного обеспечения?
Нет. Библиотеки, такие как Spire.Doc для Python, работают независимо от офисных приложений.
Заключение
Преобразование файлов ODT в PDF можно выполнить несколькими способами, каждый из которых подходит для разных нужд. Онлайн-инструменты и настольные приложения эффективны для повседневного использования, в то время как автоматизация на основе Python предоставляет масштабируемое решение для сложных и крупномасштабных сценариев. Выбрав подходящий метод, вы можете обеспечить точное, эффективное и надежное преобразование документов.