Cómo insertar imágenes en PowerPoint: 6 métodos sencillos
Tabla de contenidos
- Método 1: Insertar una imagen desde su computadora
- Método 2: Agregar imágenes a PowerPoint usando arrastrar y soltar
- Método 3: Insertar varias imágenes en PowerPoint a la vez
- Método 4: Agregar una imagen como fondo de PowerPoint
- Método 5: Agregar imágenes a PowerPoint usando VBA
- Método 6: Insertar imágenes en PowerPoint usando Python
- Comparación de los 6 métodos
- Conclusión
- Preguntas frecuentes

Las imágenes son una parte esencial de muchas presentaciones de PowerPoint, ya que ayudan a explicar ideas, resaltar información importante y hacer que las diapositivas sean visualmente más atractivas. Ya sea que esté creando un informe comercial, una presentación de marketing o material educativo, saber cómo agregar imágenes de manera eficiente puede mejorar su flujo de trabajo.
PowerPoint ofrece varias formas de insertar imágenes, desde operaciones manuales sencillas hasta soluciones automatizadas para tareas a gran escala. En este artículo, exploraremos seis métodos prácticos para agregar imágenes en PowerPoint, incluyendo funciones integradas, automatización con VBA y programación en Python.
Método 1: Insertar una imagen desde su computadora
La forma más común de agregar imágenes en PowerPoint es utilizando la función integrada Insertar imágenes. Este método es adecuado cuando solo necesita agregar algunas imágenes y ajustar manualmente su tamaño, posición o apariencia.
PowerPoint le permite insertar imágenes locales directamente en las diapositivas y personalizarlas usando herramientas de edición integradas, como recortar, cambiar el tamaño y ajustar la transparencia. Si necesita que la misma imagen aparezca en la misma posición en varias diapositivas, como un logotipo de empresa, una marca de agua o un gráfico de pie de página, puede agregar la imagen al patrón de diapositivas en lugar de insertarla manualmente en cada una.
Pasos para insertar una imagen:
- Abra su presentación de PowerPoint.
- Seleccione la diapositiva donde desea agregar una imagen.
- Vaya a Insertar > Imágenes > Este dispositivo.
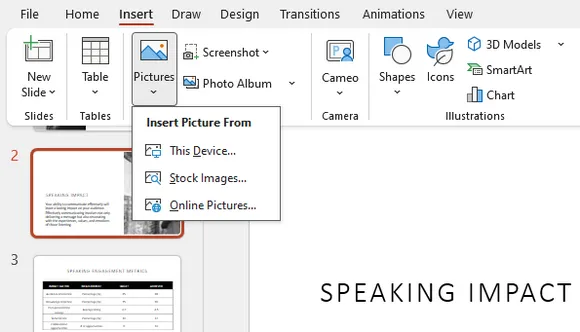
- Seleccione un archivo de imagen de su computadora.
- Haga clic en Insertar.
La imagen se agregará a la diapositiva seleccionada. Luego puede cambiar su tamaño, moverla a la posición deseada o aplicar las opciones de formato integradas de PowerPoint.
Más fuentes de imágenes en PowerPoint
Además de agregar imágenes desde su computadora, PowerPoint también proporciona fuentes de imágenes integradas que le permiten encontrar e insertar contenido visual rápidamente.
Imágenes de archivo proporciona una colección de fotos, ilustraciones, iconos y otros recursos visuales libres de regalías directamente dentro de PowerPoint. Es útil cuando necesita gráficos de aspecto profesional sin buscar recursos externos.
Imágenes en línea le permite buscar imágenes de fuentes en línea e insertarlas directamente en su presentación. Esta opción es conveniente cuando necesita encontrar materiales visuales rápidamente sin descargar archivos por separado.
Método 2: Agregar imágenes a PowerPoint usando arrastrar y soltar
Arrastrar imágenes directamente a PowerPoint es una de las formas más rápidas de agregar contenido visual durante la edición de una presentación. En lugar de navegar por los menús, simplemente puede mover un archivo de imagen desde una carpeta y colocarlo en la diapositiva de destino.
Este método funciona especialmente bien cuando se preparan presentaciones con solo unas pocas imágenes, ya que requiere pasos mínimos. Sin embargo, arrastrar manualmente muchas imágenes puede llevar mucho tiempo cuando se trabaja con presentaciones cargadas de imágenes.
Pasos:
- Abra la carpeta que contiene sus imágenes.
- Inicie su presentación de PowerPoint.
- Arrastre un archivo de imagen a la diapositiva de destino.
- Ajuste el tamaño y la posición de la imagen si es necesario.
Para ediciones ocasionales, arrastrar y soltar suele ser el flujo de trabajo más rápido. Para proyectos más grandes, considere usar métodos de inserción por lotes o automatización.
Método 3: Insertar varias imágenes en PowerPoint a la vez
Al crear presentaciones de fotos, exhibiciones de productos o colecciones de imágenes, agregar imágenes individualmente puede ralentizar el proceso de edición. PowerPoint le permite seleccionar varias imágenes e insertarlas en una presentación al mismo tiempo.
Este enfoque es útil cuando ya tiene un grupo de imágenes preparadas y desea crear diapositivas rápidamente a partir de recursos visuales existentes. Para presentaciones basadas en fotos, la función integrada de Álbum de fotografías también puede ayudar a organizar las imágenes automáticamente.
Insertar varias imágenes:
- Abra su presentación de PowerPoint.
- Seleccione la diapositiva de destino.
- Vaya a Insertar > Imágenes > Este dispositivo.
- Mantenga presionada la tecla Ctrl y seleccione varias imágenes.
- Haga clic en Insertar.
Todas las imágenes seleccionadas se agregarán a la diapositiva juntas.
Crear un álbum de fotografías:
- Vaya a Insertar > Álbum de fotografías.
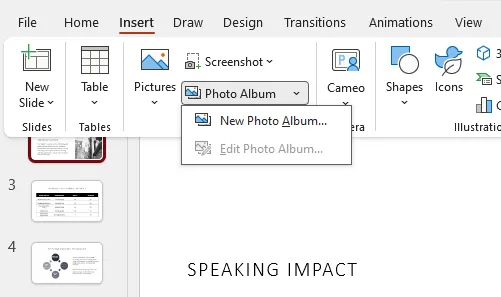
- Haga clic en Archivo/Disco.
- Seleccione las imágenes que desea usar.
- Haga clic en Crear.
PowerPoint generará automáticamente diapositivas que contienen las imágenes seleccionadas.
Método 4: Agregar una imagen como fondo de PowerPoint
A veces, una imagen no está destinada a ser un objeto separado, sino el elemento visual principal de una diapositiva. En este caso, puede agregar una imagen como fondo de PowerPoint y usarla como base de todo el diseño de la diapositiva.
El uso de una imagen de fondo es común para portadas de presentaciones, plantillas de marca y diseños visuales de pantalla completa. A diferencia de las imágenes insertadas normales, las imágenes de fondo permanecen detrás de otros elementos de la diapositiva, lo que reduce la posibilidad de movimiento accidental durante la edición.
Pasos para agregar una imagen como fondo:
- Haga clic derecho en la diapositiva.
- Seleccione Formato del fondo.
- Elija Relleno con imagen o textura.
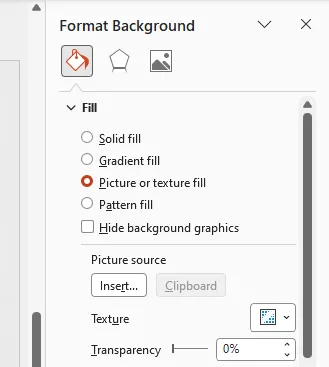
- Haga clic en Insertar y seleccione su imagen.
- Aplique el fondo a la diapositiva actual o a todas las diapositivas.
Este método es especialmente útil al crear presentaciones visualmente consistentes con temas personalizados o gráficos de página completa.
Método 5: Agregar imágenes a PowerPoint usando VBA
Para los usuarios que realizan repetidamente las mismas tareas de inserción de imágenes, VBA puede automatizar el flujo de trabajo directamente dentro de PowerPoint. En lugar de agregar imágenes manualmente y ajustar sus posiciones cada vez, una macro puede completar el proceso automáticamente.
VBA es útil para tareas como insertar logotipos de empresas, generar informes basados en imágenes o crear presentaciones a partir de colecciones de imágenes predefinidas. Es una opción práctica para los usuarios de Office que necesitan automatización sin cambiar a herramientas de programación externas.
Pasos para ejecutar código VBA:
- Abra su presentación de PowerPoint.
- Presione Alt + F11 para abrir el editor de VBA.
- Haga clic en Insertar > Módulo.
- Pegue el siguiente código.
- Presione F5 para ejecutar la macro.
Sub InsertImage()

    Dim slide As Slide
    Dim imgPath As String

    imgPath = "C:\Images\sample.jpg"

    Set slide = ActivePresentation.Slides(1)

    slide.Shapes.AddPicture _
        FileName:=imgPath, _
        LinkToFile:=msoFalse, _
        SaveWithDocument:=msoTrue, _
        Left:=100, _
        Top:=100, _
        Width:=300, _
        Height:=200

End Sub
La macro inserta la imagen especificada en la primera diapositiva y la coloca en la ubicación y tamaño definidos.
Método 6: Insertar imágenes en PowerPoint usando Python
Para los desarrolladores que crean flujos de trabajo de presentación automatizados, Python ofrece más flexibilidad que la edición manual o las macros de Office. Un enfoque de programación le permite controlar la inserción de imágenes, el posicionamiento y la generación de presentaciones a través de código.
Este método es adecuado para el procesamiento por lotes, la creación automatizada de informes y las aplicaciones que necesitan modificar archivos de PowerPoint mediante programación. En el siguiente ejemplo, usamos Spire.Presentation for Python para insertar una imagen en una presentación de PowerPoint existente.
Instalar Spire.Presentation para Python
pip install spire.presentation
Agregar una imagen a una diapositiva de PowerPoint
from spire.presentation.common import *
from spire.presentation import *
import math

# Crear un objeto Presentation
presentation = Presentation()

# Cargar una presentación de PowerPoint
presentation.LoadFromFile("Input.pptx")

# Obtener la primera diapositiva
slide = presentation.Slides[0]

# Ruta del archivo de imagen
imageFile = "Image.png"

# Calcular la posición de la imagen
left = math.trunc(presentation.SlideSize.Size.Width / float(2)) - 280

# Definir la posición y el tamaño de la imagen
rect1 = RectangleF.FromLTRB(left, 140, 120 + left, 260)

# Insertar imagen en la diapositiva
image = slide.Shapes.AppendEmbedImageByPath(
    ShapeType.Rectangle,
    imageFile,
    rect1
)

# Eliminar el borde de la imagen
image.Line.FillType = FillFormatType.none

# Guardar la presentación
presentation.SaveToFile(
    "AddImageToSlide.pptx",
    FileFormat.Pptx2010
)

presentation.Dispose()
El código carga un archivo de PowerPoint existente, selecciona una diapositiva, inserta una imagen en la ubicación especificada y guarda la presentación actualizada.
En comparación con la edición manual, la automatización con Python es más adecuada para flujos de trabajo que requieren un procesamiento de imágenes repetible o la generación de presentaciones a gran escala.
Comparación de los 6 métodos
| Método | Dificultad | Mejor para |
|---|---|---|
| Insertar imagen | Fácil | Agregar imágenes individuales manualmente |
| Arrastrar y soltar | Fácil | Agregar rápidamente algunas imágenes |
| Insertar varias imágenes | Fácil | Crear presentaciones basadas en fotos |
| Imagen de fondo | Fácil | Diseños visuales de diapositiva completa |
| VBA | Media | Automatización de Office |
| Python | Avanzada | Procesamiento por lotes y automatización |
Conclusión
PowerPoint ofrece diferentes enfoques para agregar imágenes según la complejidad de su flujo de trabajo. Para las presentaciones cotidianas, las funciones integradas como Insertar imágenes, arrastrar y soltar y Álbum de fotografías suelen ser suficientes.
Cuando se trabaja con tareas repetitivas o una gran cantidad de imágenes, la automatización con VBA y Python puede mejorar significativamente la eficiencia. Elegir el método correcto le permite crear presentaciones más rápido mientras mantiene diseños de imagen consistentes.
Preguntas frecuentes
1. ¿Cómo inserto una imagen en PowerPoint?
Puede insertar una imagen seleccionando una diapositiva y eligiendo Insertar > Imágenes > Este dispositivo. Después de seleccionar un archivo de imagen, PowerPoint lo agregará a la diapositiva actual.
2. ¿Puedo agregar varias imágenes a PowerPoint a la vez?
Sí. Puede seleccionar varios archivos de imagen mientras usa la opción Insertar imágenes. PowerPoint también proporciona la función Álbum de fotografías para crear presentaciones a partir de colecciones de imágenes.
3. ¿Qué formatos de imagen admite PowerPoint?
PowerPoint admite formatos de imagen comunes, incluidos JPG, JPEG, PNG, GIF, BMP y SVG. Los formatos disponibles pueden variar según su versión de PowerPoint.
4. ¿Cómo puedo insertar imágenes automáticamente en PowerPoint?
Puede usar macros de VBA o bibliotecas de Python para automatizar la inserción de imágenes. Estos enfoques son útiles para el procesamiento por lotes y la generación automática de presentaciones.
5. ¿Cómo configuro una imagen como fondo de PowerPoint?
Puede configurar una imagen como fondo abriendo Formato del fondo, seleccionando Relleno con imagen o textura y eligiendo su archivo de imagen.
Ver también
Bilder in PowerPoint einfügen: 6 einfache Methoden
Inhaltsverzeichnis
- Methode 1: Einfügen eines Bildes von Ihrem Computer
- Methode 2: Hinzufügen von Bildern zu PowerPoint per Drag & Drop
- Methode 3: Mehrere Bilder gleichzeitig in PowerPoint einfügen
- Methode 4: Hinzufügen eines Bildes als PowerPoint-Hintergrund
- Methode 5: Hinzufügen von Bildern zu PowerPoint mittels VBA
- Methode 6: Einfügen von Bildern in PowerPoint mit Python
- Vergleich der 6 Methoden
- Fazit
- FAQs
Bilder sind ein wesentlicher Bestandteil vieler PowerPoint-Präsentationen. Sie helfen dabei, Ideen zu erklären, wichtige Informationen hervorzuheben und Folien visuell ansprechender zu gestalten. Egal, ob Sie einen Geschäftsbericht, eine Marketingpräsentation oder Lehrmaterial erstellen – zu wissen, wie man Bilder effizient hinzufügt, kann Ihren Arbeitsablauf verbessern.
PowerPoint bietet verschiedene Möglichkeiten, Bilder einzufügen, von einfachen manuellen Vorgängen bis hin zu automatisierten Lösungen für umfangreiche Aufgaben. In diesem Artikel werden wir sechs praktische Methoden zum Hinzufügen von Bildern in PowerPoint untersuchen, einschließlich integrierter Funktionen, VBA-Automatisierung und Python-Programmierung.
Methode 1: Einfügen eines Bildes von Ihrem Computer
Die gängigste Methode zum Hinzufügen von Bildern in PowerPoint ist die Verwendung der integrierten Funktion Bilder einfügen. Diese Methode eignet sich, wenn Sie nur wenige Bilder hinzufügen und deren Größe, Position oder Aussehen manuell anpassen müssen.
PowerPoint ermöglicht es Ihnen, lokale Bilder direkt in Folien einzufügen und diese mit integrierten Bearbeitungswerkzeugen wie Zuschneiden, Größenänderung und Transparenzanpassung anzupassen. Wenn Sie möchten, dass dasselbe Bild an der gleichen Position auf mehreren Folien erscheint, wie z. B. ein Firmenlogo, ein Wasserzeichen oder eine Fußzeilengrafik, können Sie das Bild zum Folienmaster hinzufügen, anstatt es manuell auf jeder Folie einzufügen.
Schritte zum Einfügen eines Bildes:
- Öffnen Sie Ihre PowerPoint-Präsentation.
- Wählen Sie die Folie aus, auf der Sie ein Bild hinzufügen möchten.
- Gehen Sie zu Einfügen > Bilder > Dieses Gerät.
- Wählen Sie eine Bilddatei von Ihrem Computer aus.
- Klicken Sie auf Einfügen.
Das Bild wird der ausgewählten Folie hinzugefügt. Sie können es anschließend in der Größe anpassen, an die gewünschte Position verschieben oder die integrierten Formatierungsoptionen von PowerPoint anwenden.
Weitere Bildquellen in PowerPoint
Neben dem Hinzufügen von Bildern von Ihrem Computer bietet PowerPoint auch integrierte Bildquellen, mit denen Sie schnell visuelle Inhalte finden und einfügen können.
Stockbilder bietet eine Sammlung von lizenzfreien Fotos, Illustrationen, Symbolen und anderen visuellen Elementen direkt in PowerPoint. Dies ist nützlich, wenn Sie professionell aussehende Grafiken benötigen, ohne nach externen Ressourcen suchen zu müssen.
Onlinebilder ermöglicht es Ihnen, nach Bildern aus Online-Quellen zu suchen und diese direkt in Ihre Präsentation einzufügen. Diese Option ist praktisch, wenn Sie schnell visuelles Material finden müssen, ohne Dateien separat herunterzuladen.
Methode 2: Hinzufügen von Bildern zu PowerPoint per Drag & Drop
Das direkte Ziehen von Bildern in PowerPoint ist eine der schnellsten Möglichkeiten, während der Bearbeitung visuelle Inhalte hinzuzufügen. Anstatt durch Menüs zu navigieren, können Sie einfach eine Bilddatei aus einem Ordner ziehen und auf der Zielfolie ablegen.
Diese Methode funktioniert besonders gut bei der Vorbereitung von Präsentationen mit nur wenigen Bildern, da sie nur minimale Schritte erfordert. Das manuelle Ziehen vieler Bilder kann jedoch zeitaufwendig werden, wenn Sie mit bildlastigen Präsentationen arbeiten.
Schritte:
- Öffnen Sie den Ordner, der Ihre Bilder enthält.
- Starten Sie Ihre PowerPoint-Präsentation.
- Ziehen Sie eine Bilddatei auf die Zielfolie.
- Passen Sie bei Bedarf die Größe und Position des Bildes an.
Für gelegentliche Bearbeitungen ist Drag & Drop meist der schnellste Arbeitsablauf. Für größere Projekte sollten Sie Stapelverarbeitung oder Automatisierungsmethoden in Betracht ziehen.
Methode 3: Mehrere Bilder gleichzeitig in PowerPoint einfügen
Beim Erstellen von Fotopräsentationen, Produktpräsentationen oder Bildersammlungen kann das einzelne Hinzufügen von Bildern den Bearbeitungsprozess verlangsamen. PowerPoint ermöglicht es Ihnen, mehrere Bilder auszuwählen und gleichzeitig in eine Präsentation einzufügen.
Dieser Ansatz ist nützlich, wenn Sie bereits eine Gruppe von Bildern vorbereitet haben und schnell Folien aus vorhandenen visuellen Elementen erstellen möchten. Für fotobasierte Präsentationen kann auch die integrierte Fotoalbum-Funktion helfen, Bilder automatisch zu organisieren.
Mehrere Bilder einfügen:
- Öffnen Sie Ihre PowerPoint-Präsentation.
- Wählen Sie die Zielfolie aus.
- Gehen Sie zu Einfügen > Bilder > Dieses Gerät.
- Halten Sie die Strg-Taste gedrückt und wählen Sie mehrere Bilder aus.
- Klicken Sie auf Einfügen.
Alle ausgewählten Bilder werden gemeinsam zur Folie hinzugefügt.
Ein Fotoalbum erstellen:
- Gehen Sie zu Einfügen > Fotoalbum.
- Klicken Sie auf Datei/Datenträger.
- Wählen Sie die Bilder aus, die Sie verwenden möchten.
- Klicken Sie auf Erstellen.
PowerPoint generiert automatisch Folien, die die ausgewählten Bilder enthalten.
Methode 4: Hinzufügen eines Bildes als PowerPoint-Hintergrund
Manchmal soll ein Bild kein separates Objekt sein, sondern das Hauptelement einer Folie. In diesem Fall können Sie ein Bild als PowerPoint-Hintergrund hinzufügen und es als Grundlage für das gesamte Folienlayout verwenden.
Die Verwendung eines Hintergrundbildes ist üblich für Präsentationsdeckblätter, gebrandete Vorlagen und bildschirmfüllende visuelle Designs. Im Gegensatz zu regulär eingefügten Bildern bleiben Hintergrundbilder hinter anderen Folienelementen, was das Risiko einer versehentlichen Verschiebung während der Bearbeitung verringert.
Schritte zum Hinzufügen eines Bildes als Hintergrund:
- Klicken Sie mit der rechten Maustaste auf die Folie.
- Wählen Sie Hintergrund formatieren.
- Wählen Sie Bild- oder Texturfüllung.
- Klicken Sie auf Einfügen und wählen Sie Ihr Bild aus.
- Wenden Sie den Hintergrund auf die aktuelle Folie oder alle Folien an.
Diese Methode ist besonders nützlich, wenn Sie visuell konsistente Präsentationen mit benutzerdefinierten Themen oder ganzseitigen Grafiken erstellen.
Methode 5: Hinzufügen von Bildern zu PowerPoint mittels VBA
Für Benutzer, die wiederholt dieselben Aufgaben zum Einfügen von Bildern ausführen, kann VBA den Arbeitsablauf direkt in PowerPoint automatisieren. Anstatt Bilder manuell hinzuzufügen und jedes Mal deren Position anzupassen, kann ein Makro den Prozess automatisch abschließen.
VBA ist nützlich für Aufgaben wie das Einfügen von Firmenlogos, das Erstellen von bildbasierten Berichten oder das Erstellen von Präsentationen aus vordefinierten Bildersammlungen. Es ist eine praktische Option für Office-Benutzer, die Automatisierung benötigen, ohne auf externe Programmierwerkzeuge umsteigen zu müssen.
Schritte zum Ausführen von VBA-Code:
- Öffnen Sie Ihre PowerPoint-Präsentation.
- Drücken Sie Alt + F11, um den VBA-Editor zu öffnen.
- Klicken Sie auf Einfügen > Modul.
- Fügen Sie den folgenden Code ein.
- Drücken Sie F5, um das Makro auszuführen.
Sub InsertImage()

    Dim slide As Slide
    Dim imgPath As String

    imgPath = "C:\Images\sample.jpg"

    Set slide = ActivePresentation.Slides(1)

    slide.Shapes.AddPicture _
        FileName:=imgPath, _
        LinkToFile:=msoFalse, _
        SaveWithDocument:=msoTrue, _
        Left:=100, _
        Top:=100, _
        Width:=300, _
        Height:=200

End Sub
Das Makro fügt das angegebene Bild in die erste Folie ein und platziert es an der definierten Position mit der festgelegten Größe.
Methode 6: Einfügen von Bildern in PowerPoint mit Python
Für Entwickler, die automatisierte Präsentations-Workflows aufbauen, bietet Python mehr Flexibilität als manuelle Bearbeitung oder Office-Makros. Ein programmierter Ansatz ermöglicht es Ihnen, das Einfügen von Bildern, die Positionierung und die Erstellung von Präsentationen durch Code zu steuern.
Diese Methode eignet sich für die Stapelverarbeitung, die automatisierte Berichtserstellung und Anwendungen, die PowerPoint-Dateien programmgesteuert ändern müssen. Im folgenden Beispiel verwenden wir Spire.Presentation for Python, um ein Bild in eine bestehende PowerPoint-Präsentation einzufügen.
Spire.Presentation for Python installieren
pip install spire.presentation
Ein Bild zu einer PowerPoint-Folie hinzufügen
from spire.presentation.common import *
from spire.presentation import *
import math

# Erstellen eines Presentation-Objekts
presentation = Presentation()

# Laden einer PowerPoint-Präsentation
presentation.LoadFromFile("Input.pptx")

# Abrufen der ersten Folie
slide = presentation.Slides[0]

# Bilddateipfad
imageFile = "Image.png"

# Berechnen der Bildposition
left = math.trunc(presentation.SlideSize.Size.Width / float(2)) - 280

# Definieren der Bildposition und -größe
rect1 = RectangleF.FromLTRB(left, 140, 120 + left, 260)

# Einfügen des Bildes in die Folie
image = slide.Shapes.AppendEmbedImageByPath(
    ShapeType.Rectangle,
    imageFile,
    rect1
)

# Entfernen des Bildrahmens
image.Line.FillType = FillFormatType.none

# Speichern der Präsentation
presentation.SaveToFile(
    "AddImageToSlide.pptx",
    FileFormat.Pptx2010
)

presentation.Dispose()
Der Code lädt eine bestehende PowerPoint-Datei, wählt eine Folie aus, fügt ein Bild an der angegebenen Position ein und speichert die aktualisierte Präsentation.
Im Vergleich zur manuellen Bearbeitung eignet sich die Python-Automatisierung besser für Arbeitsabläufe, die wiederholbare Bildverarbeitung oder die Erstellung von Präsentationen in großem Maßstab erfordern.
Vergleich der 6 Methoden
| Methode | Schwierigkeit | Am besten geeignet für |
|---|---|---|
| Bild einfügen | Einfach | Manuelles Hinzufügen einzelner Bilder |
| Drag & Drop | Einfach | Schnelles Hinzufügen einiger weniger Bilder |
| Mehrere Bilder einfügen | Einfach | Erstellen von fotobasierten Präsentationen |
| Hintergrundbild | Einfach | Visuelle Designs für die gesamte Folie |
| VBA | Mittel | Office-Automatisierung |
| Python | Fortgeschritten | Stapelverarbeitung und Automatisierung |
Fazit
PowerPoint bietet je nach Komplexität Ihres Arbeitsablaufs unterschiedliche Ansätze zum Hinzufügen von Bildern. Für alltägliche Präsentationen sind integrierte Funktionen wie „Bilder einfügen“, Drag & Drop und das Fotoalbum in der Regel ausreichend.
Bei wiederkehrenden Aufgaben oder einer großen Anzahl von Bildern können VBA- und Python-Automatisierung die Effizienz erheblich steigern. Die Wahl der richtigen Methode ermöglicht es Ihnen, Präsentationen schneller zu erstellen und gleichzeitig konsistente Bildlayouts beizubehalten.
FAQs
1. Wie füge ich ein Bild in PowerPoint ein?
Sie können ein Bild einfügen, indem Sie eine Folie auswählen und Einfügen > Bilder > Dieses Gerät wählen. Nachdem Sie eine Bilddatei ausgewählt haben, fügt PowerPoint sie der aktuellen Folie hinzu.
2. Kann ich mehrere Bilder gleichzeitig in PowerPoint hinzufügen?
Ja. Sie können mehrere Bilddateien auswählen, während Sie die Option „Bilder einfügen“ verwenden. PowerPoint bietet auch die Fotoalbum-Funktion zum Erstellen von Präsentationen aus Bildersammlungen.
3. Welche Bildformate unterstützt PowerPoint?
PowerPoint unterstützt gängige Bildformate wie JPG, JPEG, PNG, GIF, BMP und SVG. Die verfügbaren Formate können je nach PowerPoint-Version variieren.
4. Wie kann ich Bilder automatisch in PowerPoint einfügen?
Sie können VBA-Makros oder Python-Bibliotheken verwenden, um das Einfügen von Bildern zu automatisieren. Diese Ansätze sind nützlich für die Stapelverarbeitung und die automatische Generierung von Präsentationen.
5. Wie lege ich ein Bild als PowerPoint-Hintergrund fest?
Sie können ein Bild als Hintergrund festlegen, indem Sie Hintergrund formatieren öffnen, Bild- oder Texturfüllung auswählen und Ihre Bilddatei wählen.
Siehe auch
Как добавить изображения в PowerPoint: 6 простых способов
Оглавление
- Способ 1: Вставка изображения с компьютера
- Способ 2: Добавление изображений в PowerPoint с помощью перетаскивания (Drag and Drop)
- Способ 3: Вставка нескольких изображений в PowerPoint одновременно
- Способ 4: Добавление изображения в качестве фона слайда
- Способ 5: Добавление изображений в PowerPoint с помощью VBA
- Способ 6: Вставка изображений в PowerPoint с помощью Python
- Сравнение 6 способов
- Заключение
- Часто задаваемые вопросы (FAQ)
Изображения являются неотъемлемой частью многих презентаций PowerPoint, помогая пояснять идеи, выделять важную информацию и делать слайды более визуально привлекательными. Независимо от того, создаете ли вы бизнес-отчет, маркетинговую презентацию или учебные материалы, умение эффективно добавлять изображения поможет улучшить ваш рабочий процесс.
PowerPoint предлагает несколько способов вставки изображений: от простых ручных операций до автоматизированных решений для масштабных задач. В этой статье мы рассмотрим шесть практических методов добавления изображений в PowerPoint, включая встроенные функции, автоматизацию VBA и программирование на Python.
Способ 1: Вставка изображения с компьютера
Самый распространенный способ добавления изображений в PowerPoint — использование встроенной функции Вставка изображений. Этот метод подходит, если вам нужно добавить всего несколько картинок и вручную настроить их размер, положение или внешний вид.
PowerPoint позволяет вставлять локальные изображения непосредственно на слайды и редактировать их с помощью встроенных инструментов: обрезки, изменения размера и настройки прозрачности. Если вам нужно, чтобы одно и то же изображение (например, логотип компании, водяной знак или графический элемент нижнего колонтитула) отображалось в одном и том же месте на нескольких слайдах, вы можете добавить изображение в образец слайдов, вместо того чтобы вставлять его вручную на каждый слайд.
Шаги для вставки изображения:
- Откройте вашу презентацию PowerPoint.
- Выберите слайд, на который хотите добавить изображение.
- Перейдите на вкладку Вставка > Изображения > Это устройство.
- Выберите файл изображения на вашем компьютере.
- Нажмите Вставить.
Изображение будет добавлено на выбранный слайд. После этого вы сможете изменить его размер, переместить в нужное место или применить встроенные параметры форматирования PowerPoint.
Другие источники изображений в PowerPoint
Помимо добавления изображений с компьютера, PowerPoint предоставляет встроенные источники, позволяющие быстро находить и вставлять визуальный контент.
Стоковые изображения предоставляют коллекцию бесплатных фотографий, иллюстраций, значков и других визуальных ресурсов прямо внутри PowerPoint. Это полезно, когда вам нужна профессиональная графика без поиска по внешним ресурсам.
Изображения из Интернета позволяют искать картинки в онлайн-источниках и вставлять их прямо в презентацию. Эта опция удобна, когда нужно быстро найти визуальные материалы без предварительного скачивания файлов.
Способ 2: Добавление изображений в PowerPoint с помощью перетаскивания (Drag and Drop)
Перетаскивание изображений прямо в PowerPoint — один из самых быстрых способов добавления визуального контента при редактировании презентации. Вместо того чтобы перемещаться по меню, вы можете просто перетащить файл изображения из папки на нужный слайд.
Этот метод особенно эффективен при подготовке презентаций с небольшим количеством изображений, так как требует минимум действий. Однако ручное перетаскивание большого количества картинок может занять много времени при работе с презентациями, насыщенными графикой.
Шаги:
- Откройте папку с вашими изображениями.
- Запустите презентацию PowerPoint.
- Перетащите файл изображения на нужный слайд.
- При необходимости отрегулируйте размер и положение изображения.
Для разового редактирования перетаскивание обычно является самым быстрым рабочим процессом. Для более крупных проектов рассмотрите возможность использования пакетной вставки или методов автоматизации.
Способ 3: Вставка нескольких изображений в PowerPoint одновременно
При создании фотопрезентаций, демонстрации товаров или коллекций изображений добавление картинок по одной может замедлить процесс редактирования. PowerPoint позволяет выбрать сразу несколько изображений и вставить их в презентацию за один раз.
Этот подход полезен, когда у вас уже подготовлена группа изображений и вы хотите быстро создать слайды из существующих визуальных активов. Для презентаций на основе фотографий встроенная функция «Фотоальбом» также помогает автоматически упорядочить изображения.
Вставка нескольких изображений:
- Откройте вашу презентацию PowerPoint.
- Выберите нужный слайд.
- Перейдите на вкладку Вставка > Изображения > Это устройство.
- Удерживая клавишу Ctrl, выберите несколько изображений.
- Нажмите Вставить.
Все выбранные изображения будут добавлены на слайд одновременно.
Создание фотоальбома:
- Перейдите на вкладку Вставка > Фотоальбом.
- Нажмите Файл/Диск.
- Выберите изображения, которые хотите использовать.
- Нажмите Создать.
PowerPoint автоматически создаст слайды, содержащие выбранные фотографии.
Способ 4: Добавление изображения в качестве фона слайда
Иногда изображение должно быть не отдельным объектом, а основным визуальным элементом слайда. В этом случае вы можете добавить изображение в качестве фона PowerPoint и использовать его как основу для всей компоновки слайда.
Использование фонового изображения часто встречается в обложках презентаций, брендированных шаблонах и полноэкранных визуальных дизайнах. В отличие от обычных вставленных картинок, фоновые изображения остаются позади других элементов слайда, что снижает вероятность их случайного перемещения во время редактирования.
Шаги для добавления изображения в качестве фона:
- Нажмите правой кнопкой мыши на слайд.
- Выберите Формат фона.
- Выберите Рисунок или текстура.
- Нажмите Вставить и выберите ваше изображение.
- Примените фон к текущему слайду или ко всем слайдам.
Этот метод особенно полезен при создании визуально согласованных презентаций с пользовательскими темами или полностраничной графикой.
Способ 5: Добавление изображений в PowerPoint с помощью VBA
Для пользователей, которые постоянно выполняют одни и те же задачи по вставке изображений, VBA может автоматизировать рабочий процесс прямо внутри PowerPoint. Вместо того чтобы каждый раз вручную добавлять изображения и настраивать их положение, макрос может выполнить этот процесс автоматически.
VBA полезен для таких задач, как вставка логотипов компании, создание отчетов на основе изображений или создание презентаций из заранее определенных коллекций картинок. Это практичный вариант для пользователей Office, которым нужна автоматизация без перехода на внешние инструменты программирования.
Шаги для запуска кода VBA:
- Откройте вашу презентацию PowerPoint.
- Нажмите Alt + F11, чтобы открыть редактор VBA.
- Нажмите Вставка > Модуль.
- Вставьте следующий код.
- Нажмите F5 для запуска макроса.
Sub InsertImage()

    Dim slide As Slide
    Dim imgPath As String

    imgPath = "C:\Images\sample.jpg"

    Set slide = ActivePresentation.Slides(1)

    slide.Shapes.AddPicture _
        FileName:=imgPath, _
        LinkToFile:=msoFalse, _
        SaveWithDocument:=msoTrue, _
        Left:=100, _
        Top:=100, _
        Width:=300, _
        Height:=200

End Sub
Макрос вставляет указанное изображение на первый слайд и размещает его в заданном месте с заданным размером.
Способ 6: Вставка изображений в PowerPoint с помощью Python
Для разработчиков, создающих автоматизированные рабочие процессы для презентаций, Python предоставляет больше гибкости, чем ручное редактирование или макросы Office. Программный подход позволяет управлять вставкой изображений, их позиционированием и генерацией презентаций с помощью кода.
Этот метод подходит для пакетной обработки, автоматического создания отчетов и приложений, которым необходимо программно изменять файлы PowerPoint. В следующем примере мы используем Spire.Presentation for Python для вставки изображения в существующую презентацию PowerPoint.
Установка Spire.Presentation для Python
pip install spire.presentation
Добавление изображения на слайд PowerPoint
from spire.presentation.common import *
from spire.presentation import *
import math

# Создание объекта Presentation
presentation = Presentation()

# Загрузка презентации PowerPoint
presentation.LoadFromFile("Input.pptx")

# Получение первого слайда
slide = presentation.Slides[0]

# Путь к файлу изображения
imageFile = "Image.png"

# Вычисление позиции изображения
left = math.trunc(presentation.SlideSize.Size.Width / float(2)) - 280

# Определение позиции и размера изображения
rect1 = RectangleF.FromLTRB(left, 140, 120 + left, 260)

# Вставка изображения на слайд
image = slide.Shapes.AppendEmbedImageByPath(
    ShapeType.Rectangle,
    imageFile,
    rect1
)

# Удаление границы изображения
image.Line.FillType = FillFormatType.none

# Сохранение презентации
presentation.SaveToFile(
    "AddImageToSlide.pptx",
    FileFormat.Pptx2010
)

presentation.Dispose()
Код загружает существующий файл PowerPoint, выбирает слайд, вставляет изображение в указанное место и сохраняет обновленную презентацию.
По сравнению с ручным редактированием, автоматизация на Python лучше подходит для рабочих процессов, требующих повторяющейся обработки изображений или генерации презентаций в больших масштабах.
Сравнение 6 способов
| Способ | Сложность | Лучше всего подходит для |
|---|---|---|
| Вставка изображения | Легко | Ручного добавления отдельных изображений |
| Перетаскивание (Drag and Drop) | Легко | Быстрого добавления нескольких изображений |
| Вставка нескольких изображений | Легко | Создания презентаций на основе фотографий |
| Фоновое изображение | Легко | Визуального оформления всего слайда |
| VBA | Средне | Автоматизации Office |
| Python | Продвинуто | Пакетной обработки и автоматизации |
Заключение
PowerPoint предоставляет различные подходы для добавления изображений в зависимости от сложности вашего рабочего процесса. Для повседневных презентаций обычно достаточно встроенных функций, таких как «Вставка изображений», перетаскивание и «Фотоальбом».
При работе с повторяющимися задачами или большим количеством изображений автоматизация с помощью VBA и Python может значительно повысить эффективность. Выбор правильного метода позволит вам создавать презентации быстрее, сохраняя при этом единообразие макетов изображений.
Часто задаваемые вопросы (FAQ)
1. Как вставить картинку в PowerPoint?
Вы можете вставить картинку, выбрав слайд и перейдя в Вставка > Изображения > Это устройство. После выбора файла изображения PowerPoint добавит его на текущий слайд.
2. Можно ли добавить несколько изображений в PowerPoint одновременно?
Да. Вы можете выбрать несколько файлов изображений при использовании функции «Вставка изображений». PowerPoint также предоставляет функцию «Фотоальбом» для создания презентаций из коллекций изображений.
3. Какие форматы изображений поддерживает PowerPoint?
PowerPoint поддерживает распространенные форматы изображений, включая JPG, JPEG, PNG, GIF, BMP и SVG. Доступные форматы могут варьироваться в зависимости от вашей версии PowerPoint.
4. Как можно автоматически вставлять изображения в PowerPoint?
Вы можете использовать макросы VBA или библиотеки Python для автоматизации вставки изображений. Эти подходы полезны для пакетной обработки и автоматической генерации презентаций.
5. Как установить картинку в качестве фона PowerPoint?
Вы можете установить изображение в качестве фона, открыв Формат фона, выбрав Рисунок или текстура и указав нужный файл изображения.
Смотрите также
Set Excel Chart Data Label Styles with JavaScript in React
Data labels are an essential element of Excel charts for displaying detailed information about data points, such as values, series names, and category names. Spire.XLS for JavaScript runs entirely in the browser via WebAssembly, using a virtual file system (VFS) to manage input and output files — no backend server required. It provides a complete API for controlling data label display content, font formatting, number format, position, background, borders, and other appearance properties.
This article covers two core features:
For installation and project setup, refer to Integrating Spire.XLS for JavaScript in a React Project. The examples below assume Spire.XLS is installed and the WebAssembly module is initialized.
Set Data Label Content and Font
Data labels can display various types of information, including values, series names, category names, and legend keys. With Spire.XLS for JavaScript, you can flexibly control the display content of data labels and customize their font styles to make the chart information clearer and more readable. The steps are as follows:
- Create a
Workbookobject and get the default worksheet. - Populate the worksheet with category labels and numeric data for the chart.
- Add a chart using
sheet.Charts.Add()and set the chart type. - Configure the chart's data range, position, and title.
- Enable data label display content (values, series names, category names) via the
DataLabelsproperty. - Set data label font properties (font name, size, color, bold, etc.).
- Save the workbook to an Excel file using
SaveToFile().
Below is a complete code example demonstrating how to set chart data label content and font in React:
function App() {
  const setDataLabelContentAndFont = async () => {
    // Get the Spire.XLS WASM module
    const xlsModule = window.wasmModule?.spirexls;

    // Check if the module is ready
    if (!xlsModule) {
      alert('Spire.Xls is not ready yet');
      return;
    }

    // Create a new workbook and get the default worksheet
    const workbook = new xlsModule.Workbook();
    let sheet = workbook.Worksheets.get(0);
    sheet.Name = "DataLabelDemo";

    // Populate chart data
    sheet.Range.get("A1").Value = "Month";
    sheet.Range.get("A2").Value = "Jan";
    sheet.Range.get("A3").Value = "Feb";
    sheet.Range.get("A4").Value = "Mar";
    sheet.Range.get("A5").Value = "Apr";
    sheet.Range.get("A6").Value = "May";
    sheet.Range.get("A7").Value = "Jun";

    sheet.Range.get("B1").Value = "Sales";
    sheet.Range.get("B2").NumberValue = 25;
    sheet.Range.get("B3").NumberValue = 18;
    sheet.Range.get("B4").NumberValue = 8;
    sheet.Range.get("B5").NumberValue = 13;
    sheet.Range.get("B6").NumberValue = 22;
    sheet.Range.get("B7").NumberValue = 28;

    // Add a line chart and set its data range
    let chart = sheet.Charts.Add({ chartType: xlsModule.ExcelChartType.LineMarkers });
    chart.DataRange = sheet.Range.get("B1:B7");
    chart.SeriesDataFromRange = false;

    // Set the chart position
    chart.TopRow = 5;
    chart.BottomRow = 26;
    chart.LeftColumn = 2;
    chart.RightColumn = 11;

    // Configure chart title
    chart.ChartTitle = "Data Labels Demo";
    chart.ChartTitleArea.IsBold = true;
    chart.ChartTitleArea.Size = 12;

    // Bind category labels
    let cs1 = chart.Series.get(0);
    cs1.CategoryLabels = sheet.Range.get("A2:A7");

    // Set data label display content: show values, series names, and category names
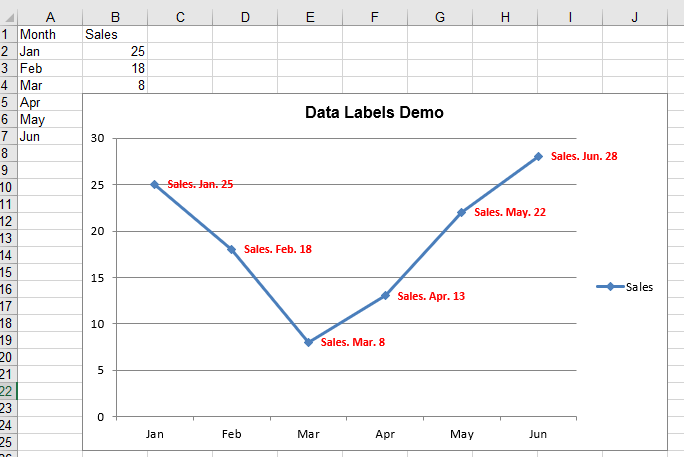
    cs1.DataPoints.DefaultDataPoint.DataLabels.HasValue = true;
    cs1.DataPoints.DefaultDataPoint.DataLabels.HasSeriesName = true;
    cs1.DataPoints.DefaultDataPoint.DataLabels.HasCategoryName = true;

    // Set data label delimiter
    cs1.DataPoints.DefaultDataPoint.DataLabels.Delimiter = ". ";

    // Customize data label font styles
    cs1.DataPoints.DefaultDataPoint.DataLabels.Size = 9;
    cs1.DataPoints.DefaultDataPoint.DataLabels.Color = xlsModule.Color.get_Red();
    cs1.DataPoints.DefaultDataPoint.DataLabels.FontName = "Calibri";
    cs1.DataPoints.DefaultDataPoint.DataLabels.IsBold = true;

    // Save the workbook
    const outputFileName = 'DataLabelContentAndFont.xlsx';
    workbook.SaveToFile(outputFileName);
    workbook.Dispose();

    // Read the file from VFS and trigger download
    const fileArray = window.dotnetRuntime.Module.FS.readFile(outputFileName);
    const blob = new Blob([fileArray], { type: 'application/vnd.openxmlformats-officedocument.spreadsheetml.sheet' });
    const url = URL.createObjectURL(blob);
    const a = document.createElement('a');
    a.href = url;
    a.download = outputFileName;
    a.click();
    URL.revokeObjectURL(url);
  };

  return (
    <div style={{ textAlign: 'center', height: '300px' }}>
      <h1>Set Data Label Content and Font</h1>
      <button onClick={setDataLabelContentAndFont}>
        Generate
      </button>
    </div>
  );
}

export default App;
Data label content and font set with Spire.XLS for JavaScript
Adjust Data Label Position and Appearance
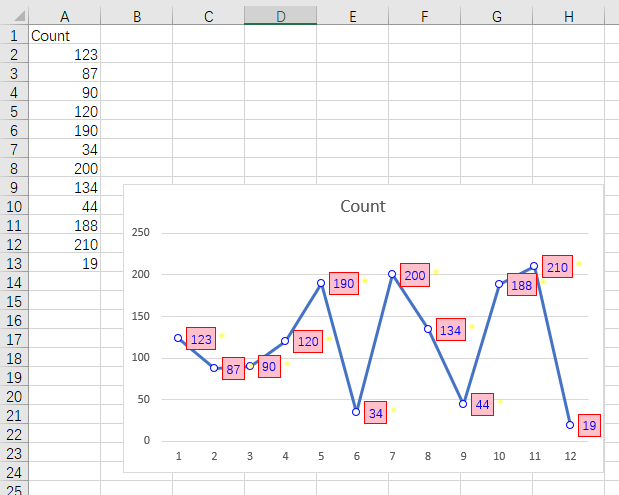
Beyond display content and font styles, the position and appearance of data labels are also important aspects of chart visual enhancement. Spire.XLS for JavaScript supports adjusting the display position of data labels through the DataLabelPositionType enumeration, and allows you to set fill colors, border styles, and shadow effects for data labels. The steps are as follows:
- Create a
Workbookobject and load an existing Excel file containing a chart. - Get the worksheet via
workbook.Worksheets.get(). - Get the chart object using
sheet.Charts.get(). - Iterate through the chart's data series and set the data label position using
DataLabels.Position. - Set a background fill color for the data labels via
FrameFormat.Fill. - Set border color and style for the data labels via
FrameFormat.Border. - Add shadow effects to data labels via
FrameFormat.Shadow(type, color, transparency, size, blur, angle, and distance). - Save the workbook to an Excel file using
SaveToFile().
Below is a complete code example demonstrating how to adjust chart data label position and appearance in React:
function App() {
  const setDataLabelPositionAndAppearance = async () => {
    // Get the Spire.XLS WASM module
    const xlsModule = window.wasmModule?.spirexls;

    // Check if the module is ready
    if (!xlsModule) {
      alert('Spire.Xls is not ready yet');
      return;
    }

    // Load the sample file into the virtual file system (VFS)
    let excelFileName = 'SampleChart.xlsx';
    await window.spire.FetchFileToVFS(excelFileName, '', `${process.env.PUBLIC_URL}data/`);

    // Create a workbook object and load the existing file
    const workbook = new xlsModule.Workbook();
    workbook.LoadFromFile({ fileName: excelFileName });

    // Get the first worksheet
    let sheet = workbook.Worksheets.get(0);

    // Get the first chart
    let chart = sheet.Charts.get(0);

    // Iterate through all data series and adjust data label position and appearance
    for (let i = 0; i < chart.Series.Count; i++) {
      let cs = chart.Series.get(i);
      // Set data point marker style and size to make data points more prominent
      cs.DataFormat.MarkerSize = 6;
      cs.DataFormat.MarkerStyle = xlsModule.ChartMarkerType.Circle;
      cs.DataFormat.MarkerForegroundColor = xlsModule.Color.get_Blue();
      cs.DataFormat.MarkerBackgroundColor = xlsModule.Color.get_White();

      let dataLabels = cs.DataPoints.DefaultDataPoint.DataLabels;

      // Enable value labels
      dataLabels.HasValue = true;

      // Set data label position
      dataLabels.Position = xlsModule.DataLabelPositionType.Right;

      // Set data label font color and size
      dataLabels.Color = xlsModule.Color.get_Blue();
      dataLabels.Size = 10;

      // Set pink fill background
      dataLabels.FrameFormat.Fill.FillType = xlsModule.ShapeFillType.SolidColor;
      dataLabels.FrameFormat.ForeGroundColor = xlsModule.Color.get_Pink();

      // Set red border
      dataLabels.FrameFormat.Border.Pattern = xlsModule.ChartLinePatternType.Solid;
      dataLabels.FrameFormat.Border.Color = xlsModule.Color.get_Red();

      // Set yellow shadow effect
      dataLabels.FrameFormat.Shadow.ShadowOuterType = xlsModule.XLSXChartShadowOuterType.OffsetDiagonalBottomLeft;
      dataLabels.FrameFormat.Shadow.Color = xlsModule.Color.get_Yellow();
      dataLabels.FrameFormat.Shadow.Transparency = 0;
      dataLabels.FrameFormat.Shadow.Size = 10;
      dataLabels.FrameFormat.Shadow.Blur = 2;
      dataLabels.FrameFormat.Shadow.Angle = 45;
      dataLabels.FrameFormat.Shadow.Distance = 8;
    }

    // Save the workbook
    const outputFileName = 'DataLabelPositionAndAppearance.xlsx';
    workbook.SaveToFile(outputFileName);
    workbook.Dispose();

    // Read the file from VFS and trigger download
    const fileArray = window.dotnetRuntime.Module.FS.readFile(outputFileName);
    const blob = new Blob([fileArray], { type: 'application/vnd.openxmlformats-officedocument.spreadsheetml.sheet' });
    const url = URL.createObjectURL(blob);
    const a = document.createElement('a');
    a.href = url;
    a.download = outputFileName;
    a.click();
    URL.revokeObjectURL(url);
  };

  return (
    <div style={{ textAlign: 'center', height: '300px' }}>
      <h1>Set Data Label Position and Appearance</h1>
      <button onClick={setDataLabelPositionAndAppearance}>
        Generate
      </button>
    </div>
  );
}

export default App;
Data label position and appearance adjusted with Spire.XLS for JavaScript
FAQ
How to modify the label content of a specific data point instead of the entire series?
Cause: DefaultDataPoint.DataLabels applies to all data points in a series and cannot control individual data points separately.
Solution: Use DataPoints.get(index) to access a specific data point and set its label:
// Modify the label text of the third data point
chart.Series.get(0).DataPoints.get(2).DataLabels.Text = "Peak";
chart.Series.get(0).DataPoints.get(2).DataLabels.HasValue = false;
How to set number format for data labels (decimal places, currency symbols)
Cause: The number format of data labels matches the cell format by default, but sometimes needs to be controlled independently.
Solution: Use the DataLabels.NumberFormat property to customize the number format:
// Show two decimal places
dataLabels.NumberFormat = "0.00";
// Display as percentage
dataLabels.NumberFormat = "0.0%";
// Display with currency symbol
dataLabels.NumberFormat = "$#,##0";
Get a Free License
Spire.XLS for JavaScript offers a 30-day full-featured free trial license with no functional limitations. Apply here to evaluate before purchasing.
Convert Excel to TXT or TXT to Excel with JavaScript in React
In daily office work, data often needs to be exchanged between Excel spreadsheets and plain text (TXT) files. Spire.XLS for JavaScript runs entirely in the browser via WebAssembly, using a virtual file system (VFS) to manage input and output files — no backend server is required. It provides flexible APIs for controlling conversion parameters such as delimiters and encoding formats.
With Spire.XLS for JavaScript, you can export Excel worksheet data as structured text files, or import delimited text files to create fully formatted Excel workbooks. This makes data migration between different applications more convenient and efficient.
This article covers two core features:
For installation and project setup, refer to Integrating Spire.XLS for JavaScript in a React Project. The examples below assume Spire.XLS is installed and the WebAssembly module is initialized.
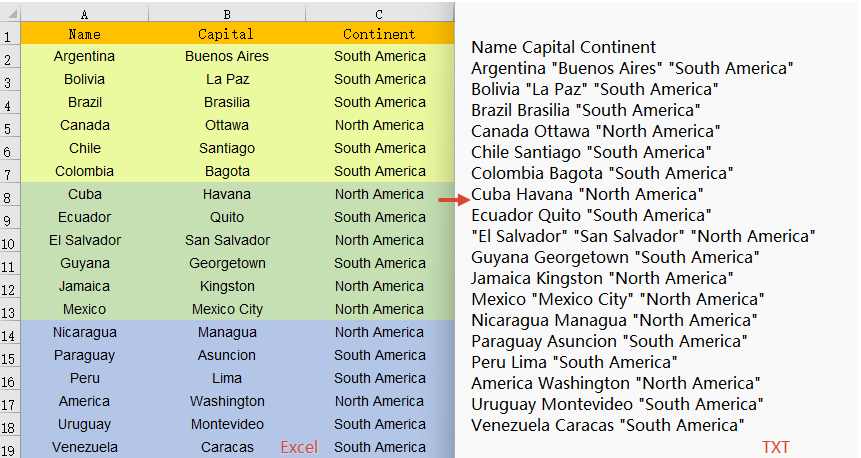
Convert Excel Worksheet Data to TXT
Exporting Excel data as a plain text file makes it convenient for further processing or analysis in other applications. With Spire.XLS for JavaScript, you can save the contents of a specified worksheet as a TXT file, with flexible control over the field separator and character encoding. The steps are as follows:
- Create a
Workbookobject and load an existing Excel file. - Retrieve a specific worksheet via
workbook.Worksheets.get(index). - Call the worksheet's
SaveToFile()method, specifying the output filename, separator, and encoding. - Dispose of the workbook resources, read the result file from VFS, and trigger the download.
Below is a complete code example demonstrating how to convert Excel to TXT in React:
function App() {
  const convertToText = async () => {
    // Get the Spire.XLS WASM module
    const xlsModule = window.wasmModule?.spirexls;

    // Check if the module is ready
    if (!xlsModule) {
      alert('Spire.Xls is not ready yet');
      return;
    }

    // Load the sample file into VFS
    await window.spire.FetchFileToVFS('Sample.xlsx', '', `${process.env.PUBLIC_URL}data/`);

    // Create a workbook object and load the Excel file
    const workbook = new xlsModule.Workbook();
    workbook.LoadFromFile({ fileName: 'Sample.xlsx' });

    // Get the first worksheet
    let sheet = workbook.Worksheets.get(0);

    // Save the worksheet as a TXT file with space separator and UTF-8 encoding
    const outputFileName = 'ExcelToTxt.txt';
    sheet.SaveToFile({
      fileName: outputFileName,
      separator: " ",
      encoding: xlsModule.Encoding.get_UTF8()
    });
    workbook.Dispose();

    // Read the file from VFS and trigger download
    const fileArray = window.dotnetRuntime.Module.FS.readFile(outputFileName);
    const blob = new Blob([fileArray], { type: 'text/plain' });
    const url = URL.createObjectURL(blob);
    const a = document.createElement('a');
    a.href = url;
    a.download = outputFileName;
    a.click();
    URL.revokeObjectURL(url);
  };

  return (
    <div style={{ textAlign: 'center', height: '300px' }}>
      <h1>Convert Excel to TXT</h1>
      <button onClick={convertToText}>
        Generate
      </button>
    </div>
  );
}

export default App;
Excel converted to TXT with Spire.XLS for JavaScript
Convert TXT File to Excel Workbook
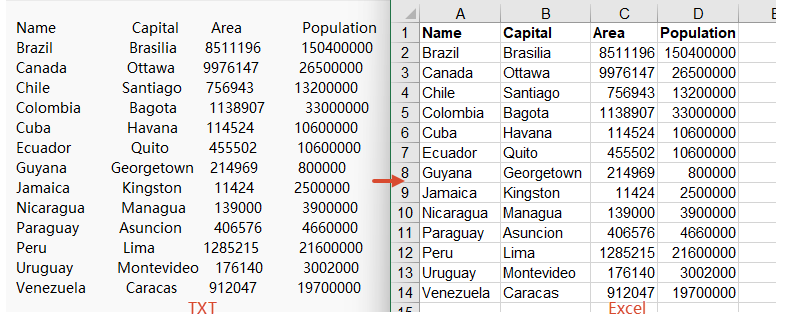
Importing a delimited text file into an Excel spreadsheet allows you to take full advantage of Excel's formatting, calculation, and charting capabilities. Spire.XLS for JavaScript supports TXT-to-Excel conversion by reading the text file content and writing data to the workbook cell by cell. Formatting such as bold headers can also be applied during the process. The steps are as follows:
- Load the font file and TXT sample file into the VFS.
- Read the TXT file content from VFS, split it by lines, and parse the cell data for each line.
- Create a
Workbookobject, iterate through the data array, and write data to worksheet cells row by row and column by column. - Apply bold styling to the header row and call
AllocatedRange.AutoFitColumns()to auto-fit column widths. - Save the workbook as an Excel file and trigger the download.
Below is a complete code example demonstrating how to convert TXT to Excel in React:
function App() {
  const convertToExcel = async () => {
    // Get the Spire.XLS WASM module
    const xlsModule = window.wasmModule?.spirexls;

    // Check if the module is ready
    if (!xlsModule) {
      alert('Spire.Xls is not ready yet');
      return;
    }

    // Load the font file to ensure proper text rendering
    await window.spire.FetchFileToVFS('ARIAL.TTF', '', `${process.env.PUBLIC_URL}font/`);

    // Load the TXT file into VFS
    await window.spire.FetchFileToVFS('Sample.txt', '', `${process.env.PUBLIC_URL}data/`);

    // Read the text file content from VFS
    const txtData = window.dotnetRuntime.Module.FS.readFile('Sample.txt');
    const text = typeof txtData === 'string' ? txtData : new TextDecoder('utf-8').decode(txtData);

    // Split by lines, compatible with \r\n and \n
    const lines = text.trim().split(/\r?\n/);

    // Parse each line of data (try tab delimiter first, then fallback to other delimiters)
    const data = [];
    for (const line of lines) {
      const trimmed = line.trim();
      if (!trimmed) continue;
      let cells = trimmed.split('\t');
      if (cells.length === 1) {
        cells = trimmed.split(/\s+/);
      }
      data.push(cells);
    }

    // Create a Workbook object
    const workbook = new xlsModule.Workbook();

    // Get the first worksheet
    const sheet = workbook.Worksheets.get(0);

    // Iterate through rows and columns in the data array and write to cells
    for (let row = 0; row < data.length; row++) {
      for (let col = 0; col < data[row].length; col++) {
        const cell = sheet.get_Item(row + 1, col + 1);
        cell.Value = data[row][col];
        // Bold the header row
        if (row === 0) {
          cell.Style.Font.IsBold = true;
        }
      }
    }

    // Auto-fit column widths
    sheet.AllocatedRange.AutoFitColumns();

    // Save the workbook and release resources
    const outputFileName = 'TxtToExcel.xlsx';
    workbook.SaveToFile({ fileName: outputFileName, version: xlsModule.ExcelVersion.Version2010 });
    workbook.Dispose();

    // Read the file from VFS and trigger download
    const fileArray = window.dotnetRuntime.Module.FS.readFile(outputFileName);
    const blob = new Blob([fileArray], { type: 'application/vnd.openxmlformats-officedocument.spreadsheetml.sheet' });
    const url = URL.createObjectURL(blob);
    const a = document.createElement('a');
    a.href = url;
    a.download = outputFileName;
    a.click();
    URL.revokeObjectURL(url);
  };

  return (
    <div style={{ textAlign: 'center', height: '300px' }}>
      <h1>Convert TXT to Excel</h1>
      <button onClick={convertToExcel}>
        Generate
      </button>
    </div>
  );
}

export default App;
TXT converted to Excel with Spire.XLS for JavaScript
FAQ
How to handle encoding issues during conversion?
Cause: The TXT file in this example uses UTF-8 encoding. If the TXT file uses a different encoding format (such as GBK, GB2312, etc.), decoding it directly with TextDecoder('utf-8') will result in garbled text.
Solution: Specify the corresponding encoding type in the TextDecoder constructor parameter based on the actual encoding of the TXT file:
// UTF-8 encoding
const text = new TextDecoder('utf-8').decode(txtData);

// GBK encoding
const text = new TextDecoder('gbk').decode(txtData);

// GB2312 encoding
const text = new TextDecoder('gb2312').decode(txtData);

// UTF-16 encoding
const text = new TextDecoder('utf-16').decode(txtData);
How to handle TXT files with different delimiters?
Cause: TXT files may use different delimiters such as tabs (\t), spaces, commas (,), semicolons (;), etc. Choosing the wrong delimiter can lead to data parsing errors.
Solution: In JavaScript, you can specify different delimiters by modifying the parameter of the split() method:
// Tab delimiter
let cells = trimmed.split('\t');

// Comma delimiter
let cells = trimmed.split(',');

// Semicolon delimiter
let cells = trimmed.split(';');

// Regular expression: split by one or more whitespace characters (spaces, tabs, etc.)
let cells = trimmed.split(/\s+/);
Get a Free License
Spire.XLS for JavaScript offers a 30-day full-featured free trial license with no functional limitations. Apply here to evaluate before purchasing.
Hide or Unhide Excel Rows and Columns with JavaScript in React
Hiding and unhiding rows and columns is a common feature in daily office work. It helps protect sensitive information, simplify data views, or temporarily conceal unnecessary data. Spire.XLS for JavaScript runs entirely in the browser via WebAssembly, using a virtual file system (VFS) to manage input and output files — no backend server required. It provides a simple API for controlling the visibility of rows and columns.
This article covers four core features:
- Hide Specific Rows and Columns in Excel
- Unhide Specific Rows and Columns in Excel
- Hide Multiple Rows and Columns at Once in Excel
- Unhide All Hidden Rows and Columns in Excel
For installation and project setup, refer to Integrating Spire.XLS for JavaScript in a React Project. The examples below assume Spire.XLS is installed and the WebAssembly module is initialized.
Hide Specific Rows and Columns in Excel
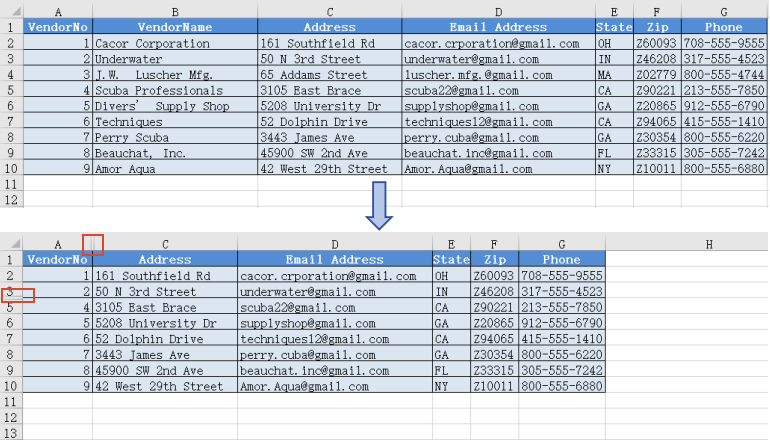
Hiding specific rows and columns can keep your worksheet cleaner and more readable without compromising data integrity. Spire.XLS for JavaScript supports hiding a specific row or column using the HideRow() and HideColumn() methods. The steps are as follows:
- Create a
Workbookobject and load an existing Excel file containing data. - Use
worksheet.HideRow()to hide a specific row. - Use
worksheet.HideColumn()to hide a specific column. - Save the workbook to an Excel file using
SaveToFile().
Below is a complete code example demonstrating how to hide specific rows and columns in Excel in React:
function App() {
  const hideSpecificRowsAndColumns = async () => {
    // Get the Spire.XLS WASM module
    const xlsModule = window.wasmModule?.spirexls;

    // Check if the module is ready
    if (!xlsModule) {
      alert('Spire.Xls is not ready yet');
      return;
    }

    // Load the sample file into the virtual file system (VFS)
    let excelFileName = 'Sample.xlsx';
    await window.spire.FetchFileToVFS(excelFileName, '', `${process.env.PUBLIC_URL}data/`);

    // Create a workbook object and load the existing file
    const workbook = new xlsModule.Workbook();
    workbook.LoadFromFile({ fileName: excelFileName });
    let sheet = workbook.Worksheets.get(0);

    // Hide a specific row (row 4)
    sheet.HideRow(4);

    // Hide a specific column (column 2, i.e., column B)
    sheet.HideColumn(2);

    // Save the workbook
    const outputFileName = 'HideSpecificRowsColumns.xlsx';
    workbook.SaveToFile(outputFileName);
    workbook.Dispose();

    // Read the file from VFS and trigger download
    const fileArray = window.dotnetRuntime.Module.FS.readFile(outputFileName);
    const blob = new Blob([fileArray], { type: 'application/vnd.openxmlformats-officedocument.spreadsheetml.sheet' });
    const url = URL.createObjectURL(blob);
    const a = document.createElement('a');
    a.href = url;
    a.download = outputFileName;
    a.click();
    URL.revokeObjectURL(url);
  };

  return (
    <div style={{ textAlign: 'center', height: '300px' }}>
      <h1>Hide Specific Rows and Columns</h1>
      <button onClick={hideSpecificRowsAndColumns}>
        Generate
      </button>
    </div>
  );
}

export default App;
Specific rows and columns hidden with Spire.XLS for JavaScript
Unhide Specific Rows and Columns in Excel
When you need to view or edit specific hidden data, you can unhide a particular row or column individually. Spire.XLS for JavaScript supports unhiding a specific row or column using the ShowRow() and ShowColumn() methods. The steps are as follows:
- Create a
Workbookobject and load an existing Excel file containing hidden rows/columns. - Use
sheet.ShowRow()to unhide a specific row. - Use
sheet.ShowColumn()to unhide a specific column. - Save the workbook to an Excel file using
SaveToFile().
Below is a complete code example demonstrating how to unhide specific rows and columns in Excel in React:
function App() {
  const unhideSpecificRowsAndColumns = async () => {
    // Get the Spire.XLS WASM module
    const xlsModule = window.wasmModule?.spirexls;

    // Check if the module is ready
    if (!xlsModule) {
      alert('Spire.Xls is not ready yet');
      return;
    }

    // Load the sample file into the virtual file system (VFS)
    let excelFileName = 'HideSpecificRowsColumns.xlsx';
    await window.spire.FetchFileToVFS(excelFileName, '', `${process.env.PUBLIC_URL}data/`);

    // Create a workbook object and load the existing file
    const workbook = new xlsModule.Workbook();
    workbook.LoadFromFile({ fileName: excelFileName });

    // Get the first worksheet
    let sheet = workbook.Worksheets.get(0);

    // Unhide a specific row (row 4)
    sheet.ShowRow(4);

    // Unhide a specific column (column 2, i.e., column B)
    sheet.ShowColumn(2);

    // Save the workbook
    const outputFileName = 'UnhideSpecificRowsColumns.xlsx';
    workbook.SaveToFile(outputFileName);
    workbook.Dispose();

    // Read the file from VFS and trigger download
    const fileArray = window.dotnetRuntime.Module.FS.readFile(outputFileName);
    const blob = new Blob([fileArray], { type: 'application/vnd.openxmlformats-officedocument.spreadsheetml.sheet' });
    const url = URL.createObjectURL(blob);
    const a = document.createElement('a');
    a.href = url;
    a.download = outputFileName;
    a.click();
    URL.revokeObjectURL(url);
  };

  return (
    <div style={{ textAlign: 'center', height: '300px' }}>
      <h1>Unhide Specific Rows and Columns</h1>
      <button onClick={unhideSpecificRowsAndColumns}>
        Generate
      </button>
    </div>
  );
}

export default App;
Specific rows and columns unhidden with Spire.XLS for JavaScript
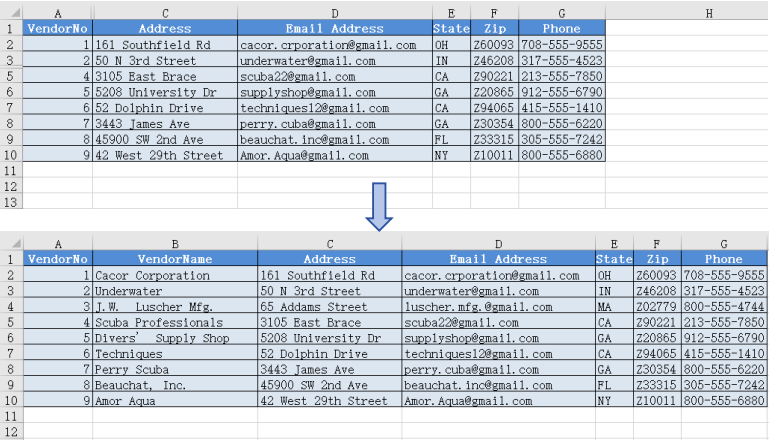
Hide Multiple Rows and Columns at Once in Excel
When there are multiple rows or columns that you don't need to display, hiding them one by one is inefficient. Spire.XLS for JavaScript supports hiding multiple rows and columns at once through loops, greatly improving operational efficiency. The steps are as follows:
- Create a
Workbookobject and load an existing Excel file containing data. - Use a loop to call
worksheet.HideRow()to hide multiple rows at once. - Use a loop to call
worksheet.HideColumn()to hide multiple columns at once. - Save the workbook to an Excel file using
SaveToFile().
Below is a complete code example demonstrating how to hide multiple rows and columns at once in Excel in React:
function App() {
  const hideMultipleRowsAndColumns = async () => {
    // Get the Spire.XLS WASM module
    const xlsModule = window.wasmModule?.spirexls;

    // Check if the module is ready
    if (!xlsModule) {
      alert('Spire.Xls is not ready yet');
      return;
    }

    // Load the sample file into the virtual file system (VFS)
    let excelFileName = 'Sample.xlsx';
    await window.spire.FetchFileToVFS(excelFileName, '', `${process.env.PUBLIC_URL}data/`);

    // Create a workbook object and load the existing file
    const workbook = new xlsModule.Workbook();
    workbook.LoadFromFile({ fileName: excelFileName });
    let sheet = workbook.Worksheets.get(0);

    // Hide multiple rows at once (rows 6 through 10)
    for (let i = 6; i <= 10; i++) {
      sheet.HideRow(i);
    }

    // Hide multiple columns at once (columns 4 through 5, i.e., columns D to E)
    for (let j = 4; j <= 5; j++) {
      sheet.HideColumn(j);
    }

    // Save the workbook
    const outputFileName = 'HideMultipleRowsColumns.xlsx';
    workbook.SaveToFile(outputFileName);
    workbook.Dispose();

    // Read the file from VFS and trigger download
    const fileArray = window.dotnetRuntime.Module.FS.readFile(outputFileName);
    const blob = new Blob([fileArray], { type: 'application/vnd.openxmlformats-officedocument.spreadsheetml.sheet' });
    const url = URL.createObjectURL(blob);
    const a = document.createElement('a');
    a.href = url;
    a.download = outputFileName;
    a.click();
    URL.revokeObjectURL(url);
  };

  return (
    <div style={{ textAlign: 'center', height: '300px' }}>
      <h1>Hide Multiple Rows and Columns</h1>
      <button onClick={hideMultipleRowsAndColumns}>
        Generate
      </button>
    </div>
  );
}

export default App;
Multiple rows and columns hidden at once with Spire.XLS for JavaScript
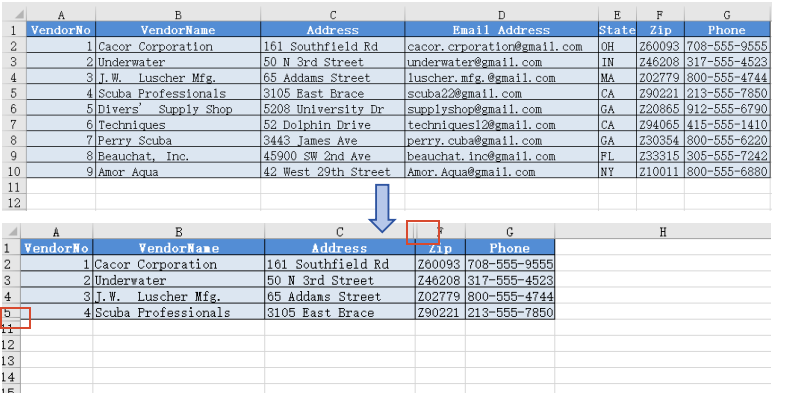
Unhide All Hidden Rows and Columns in Excel
To unhide all hidden rows and columns, iterate through the rows and columns in the worksheet, use GetRowIsHide() and GetColumnIsHide() to find hidden ones, then call ShowRow() and ShowColumn() to unhide them. The steps are as follows:
- Create a
Workbookobject and load the Excel file. - Get the worksheet.
- Iterate through rows, use
GetRowIsHide()to find hidden rows, useShowRow()to unhide. - Iterate through columns, use
GetColumnIsHide()to find hidden columns, useShowColumn()to unhide. - Save the result file using
SaveToFile().
Below is a complete code example demonstrating how to unhide all hidden rows and columns in Excel in React:
function App() {
  const unhideAllRowsAndColumns = async () => {
    // Get the Spire.XLS WASM module
    const xlsModule = window.wasmModule?.spirexls;

    // Check if the module is ready
    if (!xlsModule) {
      alert('Spire.Xls is not ready yet');
      return;
    }

    // Load the sample file into the virtual file system (VFS)
    let excelFileName = 'HideMultipleRowsColumns.xlsx';
    await window.spire.FetchFileToVFS(excelFileName, '', `${process.env.PUBLIC_URL}data/`);

    // Create a workbook object and load the existing file
    const workbook = new xlsModule.Workbook();
    workbook.LoadFromFile({ fileName: excelFileName });

    // Get the first worksheet
    let sheet = workbook.Worksheets.get(0);

    for (let i = 1; i <= sheet.Rows.length; i++) {
      if (sheet.GetRowIsHide(i)) {
        // Unhide row
        sheet.ShowRow(i);
      }
    }

    for (let j = 1; j <= sheet.Columns.length; j++) {
      if (sheet.GetColumnIsHide(j)) {
        // Unhide column
        sheet.ShowColumn(j);
      }
    }

    // Save the workbook
    const outputFileName = 'UnhideAllRowsColumns.xlsx';
    workbook.SaveToFile(outputFileName);
    workbook.Dispose();

    // Read the file from VFS and trigger download
    const fileArray = window.dotnetRuntime.Module.FS.readFile(outputFileName);
    const blob = new Blob([fileArray], { type: 'application/vnd.openxmlformats-officedocument.spreadsheetml.sheet' });
    const url = URL.createObjectURL(blob);
    const a = document.createElement('a');
    a.href = url;
    a.download = outputFileName;
    a.click();
    URL.revokeObjectURL(url);
  };

  return (
    <div style={{ textAlign: 'center', height: '300px' }}>
      <h1>Unhide All Rows and Columns</h1>
      <button onClick={unhideAllRowsAndColumns}>
        Generate
      </button>
    </div>
  );
}

export default App;
All hidden rows and columns unhidden with Spire.XLS for JavaScript
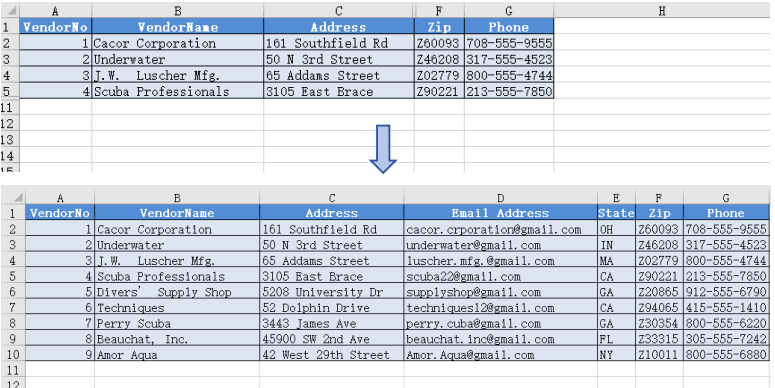
FAQ
How to check whether a row or column is hidden?
Solution: Use the GetRowIsHide() and GetColumnIsHide() methods to check:
// Check if row 3 is hidden
let rowIsHidden = sheet.GetRowIsHide(3);

// Check if column 2 (column B) is hidden
let columnIsHidden = sheet.GetColumnIsHide(2);
Are row heights or column widths preserved after hiding?
Solution: When hiding rows or columns, the original row height and column width values are preserved. After unhiding with ShowRow() or ShowColumn(), the original dimensions are automatically restored without any additional configuration.
Get a Free License
Spire.XLS for JavaScript offers a 30-day full-featured free trial license with no functional limitations. Apply here to evaluate before purchasing.
Read or Delete Excel Document Properties with JavaScript in React
Excel document properties — such as title, author, category, and other metadata — are essential for file management and information retrieval. Spire.XLS for JavaScript runs entirely in the browser via WebAssembly, using a virtual file system (VFS) to manage input and output files. It provides a complete API for accessing and managing both DocumentProperties (standard/built-in properties) and CustomDocumentProperties (user-defined name-value pairs).
Spire.XLS categorizes document properties into two types: standard and custom. Standard document properties are predefined built-in metadata like title, subject, author, category, keywords, and comments. Custom document properties are user-defined name-value pairs that can contain text, numbers, dates, or boolean values.
This article covers two core features:
For installation and project setup, refer to Integrating Spire.XLS for JavaScript in a React Project. The examples below assume Spire.XLS is installed and the WebAssembly module is initialized.
Read Standard and Custom Document Properties
Reading document properties is the first step in understanding an Excel file's metadata. Through the DocumentProperties and CustomDocumentProperties collections, you can easily access all property information stored in the file. The steps are as follows:
- Create a
Workbookobject and load an existing Excel file. - Retrieve the standard document properties collection via
workbook.DocumentProperties. - Iterate through the
DocumentPropertiescollection to read each property's name and value. - Retrieve the custom document properties collection via
workbook.CustomDocumentProperties. - Iterate through the
CustomDocumentPropertiescollection to read each custom property's name and value. - Output the retrieved property information to a text file.
Below is a complete code example demonstrating how to read Excel document properties in React:
function App() {
  const readDocumentProperties = async () => {
    // Get the Spire.XLS WASM module
    const xlsModule = window.wasmModule?.spirexls;

    // Check if the module is ready
    if (!xlsModule) {
      alert('Spire.Xls is not ready yet');
      return;
    }

    // Load the sample file into VFS
    await window.spire.FetchFileToVFS('Sample.xlsx', '', `${process.env.PUBLIC_URL}data/`);

    const workbook = new xlsModule.Workbook();
    workbook.LoadFromFile({ fileName: 'Sample.xlsx' });

    // Get standard document properties
    let properties1 = workbook.DocumentProperties;
    let sb = [];
    sb.push("Excel Properties:");
    for (let i = 0; i < properties1.Count; i++) {
      let name = properties1.get(i).Name;
      let obj = properties1.get(i).Value;
      let t = properties1.get(i).PropertyType;
      let value = null;
      if (t === xlsModule.PropertyType.Double) {
        value = xlsModule.Double.Convert(obj).Value;
      } else if (t === xlsModule.PropertyType.DateTime) {
        // Convert OADate to JavaScript Date and format as date string
        let oaDate = xlsModule.DateTime.Convert(obj).Value;
        let jsDate = new Date((oaDate - 25569) * 86400 * 1000);
        value = jsDate.toLocaleDateString();
      } else if (t === xlsModule.PropertyType.Bool) {
        value = xlsModule.Boolean.Convert(obj).Value;
      } else if (
        t === xlsModule.PropertyType.Int ||
        t === xlsModule.PropertyType.Int32
      ) {
        value = xlsModule.Int32.Convert(obj).Value;
      } else {
        value = xlsModule.String.Convert(obj).Value;
      }
      sb.push(name + ": " + String(value));
    }
    sb.push("");

    // Get custom document properties
    let properties2 = workbook.CustomDocumentProperties;
    sb.push("Custom Properties:");
    for (let i = 0; i < properties2.Count; i++) {
      let name = properties2.get(i).Name;
      let t = properties2.get(i).PropertyType;
      let obj = properties2.get(i).Value;
      let value = null;
      if (t === xlsModule.PropertyType.Double) {
        value = xlsModule.Double.Convert(obj).Value;
      } else if (t === xlsModule.PropertyType.DateTime) {
        // Convert OADate to JavaScript Date and format as date string
        let oaDate = xlsModule.DateTime.Convert(obj).Value;
        let jsDate = new Date((oaDate - 25569) * 86400 * 1000);
        value = jsDate.toLocaleDateString();
      } else if (t === xlsModule.PropertyType.Bool) {
        value = xlsModule.Boolean.Convert(obj).Value;
      } else if (
        t === xlsModule.PropertyType.Int ||
        t === xlsModule.PropertyType.Int32
      ) {
        value = xlsModule.Int32.Convert(obj).Value;
      } else {
        value = xlsModule.String.Convert(obj).Value;
      }
      sb.push(name + ": " + String(value));
    }

    // Save the property information to a text file
    const outputFileName = 'DocumentProperties.txt';
    window.dotnetRuntime.Module.FS.writeFile(outputFileName, sb.join("\n"));
    workbook.Dispose();

    // Read the file from VFS and trigger download
    const fileArray = window.dotnetRuntime.Module.FS.readFile(outputFileName);
    const blob = new Blob([fileArray], { type: 'text/plain' });
    const url = URL.createObjectURL(blob);
    const a = document.createElement('a');
    a.href = url;
    a.download = outputFileName;
    a.click();
    URL.revokeObjectURL(url);
  };

  return (
    <div style={{ textAlign: 'center', height: '300px' }}>
      <h1>Read Excel Document Properties</h1>
      <button onClick={readDocumentProperties}>
        Generate
      </button>
    </div>
  );
}

export default App;
Document properties read with Spire.XLS for JavaScript
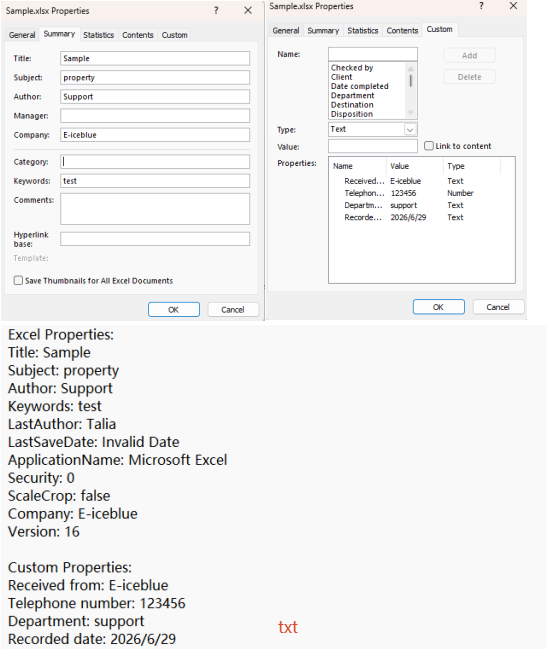
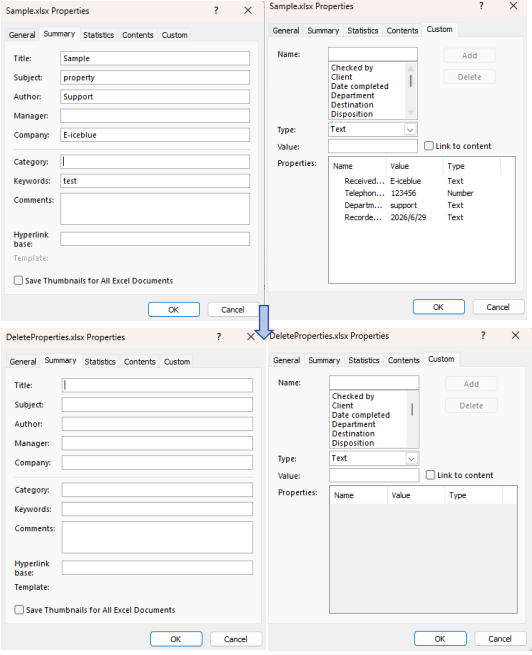
Delete Standard and Custom Document Properties
In some scenarios, you may need to clear sensitive or outdated metadata from Excel files. Spire.XLS for JavaScript allows you to delete both standard and custom document properties through straightforward API calls. The steps are as follows:
- Create a
Workbookobject and load an existing Excel file. - Retrieve the standard document properties collection via
workbook.DocumentProperties. - Clear standard properties by setting their values to empty strings.
- Retrieve the custom document properties collection via
workbook.CustomDocumentProperties. - Iterate through the collection and use the
Remove()method to delete each custom property. - Save the modified workbook to a new Excel file.
Below is a complete code example demonstrating how to delete Excel document properties in React:
function App() {
  const deleteDocumentProperties = async () => {
    // Get the Spire.XLS WASM module
    const xlsModule = window.wasmModule?.spirexls;

    // Check if the module is ready
    if (!xlsModule) {
      alert('Spire.Xls is not ready yet');
      return;
    }

    // Load the sample file into VFS
    await window.spire.FetchFileToVFS('Sample.xlsx', '', `${process.env.PUBLIC_URL}data/`);

    const workbook = new xlsModule.Workbook();
    workbook.LoadFromFile({ fileName: 'Sample.xlsx' });

    // Get the standard document properties collection and clear their values
    let standardProperties = workbook.DocumentProperties;
    standardProperties.Title = "";
    standardProperties.Subject = "";
    standardProperties.Manager = "";
    standardProperties.Category = "";
    standardProperties.Keywords = "";
    standardProperties.Comments = "";
    standardProperties.Author = "";
    standardProperties.Company = "";

    // Get the custom document properties collection, iterate and remove all properties
    let customProperties = workbook.CustomDocumentProperties;
    for (let i = customProperties.Count - 1; i >= 0; i--) {
      customProperties.Remove(customProperties.get(i).Name);
    }

    // Save the workbook
    const outputFileName = 'DeleteProperties.xlsx';
    workbook.SaveToFile(outputFileName);
    workbook.Dispose();

    // Read the file from VFS and trigger download
    const fileArray = window.dotnetRuntime.Module.FS.readFile(outputFileName);
    const blob = new Blob([fileArray], { type: 'application/vnd.openxmlformats-officedocument.spreadsheetml.sheet' });
    const url = URL.createObjectURL(blob);
    const a = document.createElement('a');
    a.href = url;
    a.download = outputFileName;
    a.click();
    URL.revokeObjectURL(url);
  };

  return (
    <div style={{ textAlign: 'center', height: '300px' }}>
      <h1>Delete Excel Document Properties</h1>
      <button onClick={deleteDocumentProperties}>
        Generate
      </button>
    </div>
  );
}

export default App;
Document properties deleted with Spire.XLS for JavaScript
FAQ
Why can't standard document properties be removed using Remove() like custom properties?
Cause: Standard document properties are part of the Excel file structure, each with a fixed definition position that cannot be removed from the collection.
Solution: Clear standard properties by setting their values to empty strings instead of removing the properties themselves:
standardProperties.Title = "";
standardProperties.Author = "";
Custom properties can be directly deleted using the Remove() method.
How to handle reading non-text property types such as dates, booleans, and numbers?
Cause: Using String.Convert() directly on date or boolean properties may produce results in an unexpected format.
Solution: Check the PropertyType to determine the type and use the appropriate conversion method:
if (t === xlsModule.PropertyType.DateTime) {
  let oaDate = xlsModule.DateTime.Convert(obj).Value;
  let jsDate = new Date((oaDate - 25569) * 86400 * 1000);
  value = jsDate.toLocaleDateString();
} else if (t === xlsModule.PropertyType.Bool) {
  value = xlsModule.Boolean.Convert(obj).Value;
}
Get a Free License
Spire.XLS for JavaScript offers a 30-day full-featured free trial license with no functional limitations. Apply here to evaluate before purchasing.
Como inserir equações no PowerPoint: 4 métodos práticos
Equações matemáticas são comuns em apresentações sobre ciência, engenharia, finanças, estatística e educação. Uma fórmula simples como E = mc² pode ser fácil de digitar, mas frações, matrizes, integrais e expressões com vários níveis de sobrescritos podem rapidamente se tornar difíceis de formatar em uma caixa de texto comum.
Este guia aborda quatro maneiras práticas de inserir equações no PowerPoint:
- Use a ferramenta de Equação integrada do PowerPoint
- Converta fórmulas manuscritas com a Tinta para Matemática
- Insira uma equação como imagem
- Insira equações programaticamente com C#
Comparação Rápida
A melhor maneira de inserir uma equação no PowerPoint depende se ela precisa permanecer editável, como foi criada e se você está trabalhando em um slide ou gerando muitas apresentações automaticamente.
| Método | Melhor para | Editável como Equação? | Limitação Principal |
|---|---|---|---|
| Ferramenta de Equação do PowerPoint | Criar algumas equações editáveis manualmente | Sim | Fórmulas complexas levam mais tempo para serem criadas |
| Tinta para Matemática | Usuários de canetas stylus e telas sensíveis ao toque | Sim, após a conversão | O reconhecimento de escrita pode exigir correção |
| Inserir como imagem | Preservar uma equação criada em outro lugar | Não | A imagem deve ser recriada quando a fórmula mudar |
| C# com Free Spire.Presentation | Geração em lote e relatórios automatizados | Sim | Requer conhecimento básico de C# |
Método 1: Inserir uma Equação Usando a Ferramenta de Equação do PowerPoint
Para a maioria dos usuários, o editor de equações integrado do PowerPoint é o melhor ponto de partida. Ele cria objetos de equação nativos que podem ser redimensionados, reposicionados e editados diretamente na apresentação.
Inserir uma Equação Integrada
O PowerPoint inclui várias equações comuns (como a Fórmula Quadrática ou o Teorema de Pitágoras) que podem ser inseridas diretamente.
-
Abra sua apresentação do PowerPoint e selecione o slide desejado.
-
Vá para a guia Inserir na faixa de opções superior.
-
No grupo Símbolos, clique na seta suspensa ao lado de Equação.
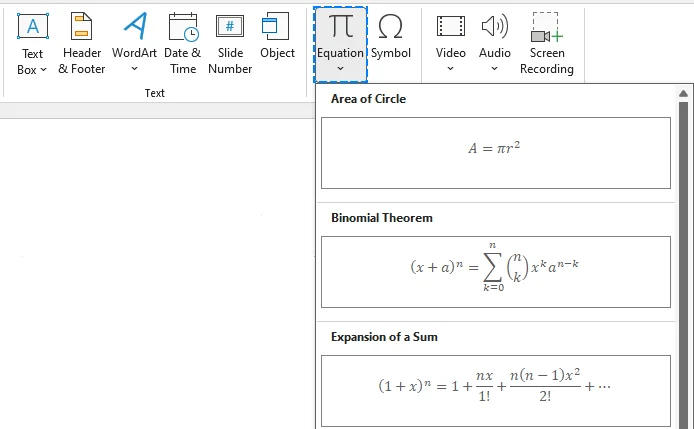
-
Selecione uma das equações integradas da galeria.
-
Clique dentro da caixa de equação no seu slide para editar seus valores, símbolos ou estrutura.
Criar uma Nova Equação do Zero
Para criar uma equação personalizada:
-
Vá para Inserir > Equação > Inserir Nova Equação (ou pressione Alt + = no Windows) para inserir uma nova caixa de equação.
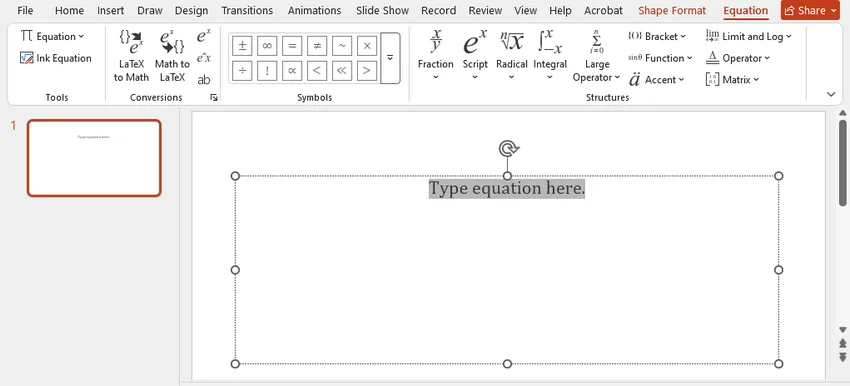
-
A faixa de opções mudará automaticamente para a guia Equação.
-
Clique na categoria que você precisa (como Fração, Sobrescrito, Radical, Integral ou Matriz) no grupo Estruturas para inserir modelos vazios padrão.
-
Clique nos espaços reservados quadrados tracejados dentro da fórmula e digite suas variáveis ou números.
Digitar uma Equação em Formato Linear
Para usuários avançados, inserir fórmulas em sintaxe linear é muito mais rápido do que clicar nos ícones da faixa de opções.
O PowerPoint no Microsoft 365 suporta a conversão de notação LaTeX e UnicodeMath suportada em equações formatadas profissionalmente. Os comandos disponíveis e as opções de conversão podem variar de acordo com a versão.
-
Insira uma caixa de equação em branco (Alt + = no Windows).
-
Digite sua expressão dentro da caixa usando sintaxe linear. Exemplos:
- UnicodeMath:
(a+b)/(c+d),x^2ouy_1 - LaTeX:
\int_0^\infty e^{-x} dx
- UnicodeMath:
-
Clique com o botão direito dentro da caixa de equação, passe o mouse sobre Opções de Matemática e selecione Profissional (ou clique em Conversões > Profissional na faixa de opções Equação) para renderizar a fórmula linear completa na notação matemática visual padrão.
O que fazer se a equação não for convertida
Se o PowerPoint deixar a notação como texto simples:
- Confirme se o texto está dentro de uma caixa de equação em vez de uma caixa de texto normal.
- Selecione toda a expressão antes de escolher o comando de conversão.
- Simplifique comandos não suportados ou recursos específicos de pacotes.
- Verifique se há chaves faltando, delimitadores sem correspondência ou comandos que diferenciam maiúsculas de minúsculas.
- Atualize o PowerPoint se as opções de conversão esperadas não estiverem disponíveis.
Para uma equação que o PowerPoint ainda não consegue converter corretamente, considere inseri-la como uma imagem (método 3) ou gerá-la programaticamente (método 4).
Método 2: Escrever uma Equação à Mão com Tinta para Matemática
Se você estiver usando um tablet, Microsoft Surface ou um laptop com tela sensível ao toque, digitar equações pode parecer restritivo. O recurso Tinta para Matemática do PowerPoint permite que você desenhe fórmulas naturalmente e as converta em texto matemático digital editável.
Inserir uma Equação Manuscrita
-
Vá para a guia Desenhar e clique no botão Tinta para Matemática para abrir o painel de entrada matemática.

-
Use sua caneta stylus, dedo ou mouse para escrever sua fórmula na área da grade.
-
Visualize a conversão digital em tempo real na parte superior do painel.
-
Se um caractere for lido incorretamente, use a ferramenta Selecionar e Corrigir no menu inferior, clique no símbolo incorreto e escolha o correto nas sugestões pop-up.
-
Clique em Inserir para colocar a equação no seu slide.
Nota: As opções de Tinta para Matemática disponíveis podem variar de acordo com a versão do PowerPoint. No Microsoft 365 para Windows, você também pode escrever uma equação diretamente no slide, selecionar a tinta com a Seleção de Laço e escolher Desenhar > Tinta para Matemática. Este recurso de conversão direta requer que as experiências conectadas do Microsoft 365 estejam habilitadas. Para mais detalhes, consulte a documentação de suporte da Microsoft.
Método 3: Inserir uma Equação como Imagem
Se uma equação já foi criada em um editor LaTeX, aplicativo científico ou renderizador de equações online, ela pode ser exportada como uma imagem SVG ou PNG e inserida no PowerPoint.
Esta costuma ser a solução mais simples quando a equação já está finalizada e não precisa ser editada posteriormente.
SVG ou PNG: Qual formato escolher
- Use SVG sempre que possível. É um formato vetorial, portanto, a equação permanece nítida quando redimensionada.
- Use PNG quando o SVG não estiver disponível. Exporte-o em uma resolução suficientemente alta e use um fundo transparente sempre que possível.
Inserir a Imagem da Equação
-
Exporte a equação como um arquivo SVG ou PNG de um editor ou renderizador de equações.
-
Abra o slide de destino.
-
Selecione Inserir > Imagens > Este Dispositivo.
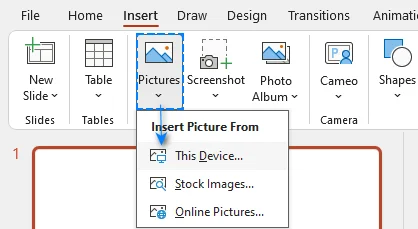
-
Escolha o arquivo de imagem da equação.
-
Redimensione e posicione-a sem alterar sua proporção.
Limitação Importante
Uma equação inserida como imagem não pode ser editada como conteúdo matemático. Mantenha o arquivo de origem original para que a fórmula possa ser regenerada caso ela mude.
Para acessibilidade, adicione texto alternativo que descreva a fórmula em vez de simplesmente rotulá-la como uma imagem. Por exemplo:
Fórmula quadrática: x é igual a menos b mais ou menos a raiz quadrada de b ao quadrado menos quatro a c, dividido por dois a.
Use este método quando
- A equação foi criada em outro aplicativo.
- A aparência visual exata é mais importante do que a editabilidade.
- O PowerPoint não renderiza uma fórmula complexa corretamente.
- A equação é final e improvável de mudar.
Método 4: Inserir Equações Programaticamente em C#
A entrada manual de equações é adequada para alguns slides. Torna-se ineficiente quando as equações precisam ser adicionadas repetidamente a modelos de relatório, materiais de treinamento, apresentações financeiras ou bancos de questões.
Nesses casos, uma biblioteca .NET pode gerar conteúdo matemático no PowerPoint a partir de código LaTeX sem abrir o PowerPoint manualmente. O exemplo a seguir usa o Free Spire.Presentation. A biblioteca pode criar e modificar arquivos do PowerPoint sem exigir que o Microsoft PowerPoint esteja instalado.
- *Nota: A edição gratuita foi projetada para tarefas de pequena escala e permite processar até 10 slides por arquivo. Se sua apresentação exceder esse limite, você pode mudar para a edição completa e solicitar uma licença de teste gratuita para um teste sem restrições.
Passo 1: Instalar o Pacote Necessário
Instale o Free Spire.Presentation através do Console do Gerenciador de Pacotes NuGet:
Install-Package FreeSpire.Presentation
Alternativamente, use a CLI do .NET:
dotnet add package FreeSpire.Presentation
Passo 2: Escrever o Código C#
O código a seguir cria uma apresentação, adiciona uma forma ao primeiro slide, gera uma equação a partir de código LaTeX e salva o resultado como um arquivo PPTX:
using Spire.Presentation;
using Spire.Presentation.Drawing;
using System;
using System.Drawing;
using System.IO;

namespace EquationDemo
{
    internal class Program
    {
        static void Main(string[] args)
        {
            string outputFolder = "generated-slides";
            string outputFile = Path.Combine(outputFolder, "QuadraticFormula.pptx");
            Directory.CreateDirectory(outputFolder);

            using (Presentation deck = new Presentation())
            {
                try
                {
                    ISlide firstSlide = deck.Slides[0];

                    // Um retângulo transparente atua como um contêiner para o texto da equação
                    IAutoShape equationBox = firstSlide.Shapes.AppendShape(
                        ShapeType.Rectangle,
                        new RectangleF(60, 120, 560, 90)
                    );
                    equationBox.Fill.FillType = FillFormatType.None;
                    equationBox.Line.FillType = FillFormatType.None;
                    equationBox.TextFrame.Paragraphs.Clear();

                    // Fórmula quadrática, escrita em LaTeX
                    string quadraticFormula = @"x=\frac{-b\pm\sqrt{b^{2}-4ac}}{2a}";
                    equationBox.TextFrame.Paragraphs.AddParagraphFromLatexMathCode(quadraticFormula);

                    deck.SaveToFile(outputFile, FileFormat.Pptx2019);
                    Console.WriteLine($"Salvo: {outputFile}");
                }
                catch (Exception ex)
                {
                    Console.WriteLine($"Não foi possível gerar o slide: {ex.Message}");
                }
            }
        }
    }
}
Resultado:
Notas para Desenvolvedores:
- Processando apresentações existentes: Este exemplo cria uma nova apresentação. Para inserir equações em um arquivo existente, carregue-o primeiro com deck.LoadFromFile("caminho_do_seu_arquivo.pptx"), depois use os mesmos métodos de forma/equação mostrados acima.
- Geração em lote: Envolva a lógica de inserção de equação em um loop (por exemplo, lendo strings LaTeX de um CSV ou banco de dados) para processar muitos slides ou arquivos automaticamente.
- Teste equações incomuns primeiro: Comandos menos comuns e matrizes complexas devem ser testados antes de serem usados em um fluxo de trabalho de produção.
- Limites da edição gratuita: O Free Spire.Presentation suporta até 10 slides por apresentação. Se a apresentação de origem exceder esse limite, divida-a com antecedência usando o PowerPoint ou outra ferramenta sem restrições, ou use a edição comercial.
Dicas para Criar Equações Claras no PowerPoint
Use um Tamanho Legível
Uma equação que parece aceitável em um laptop pode ser difícil de ler em um projetor. Visualize o slide no modo de apresentação e verifique-o a uma distância de visualização razoável.
Mantenha a Formatação Consistente
Use um tamanho, alinhamento e espaçamento de equação consistentes em toda a apresentação. Evite misturar capturas de tela, equações nativas e equações de suplementos, a menos que sua aparência visual seja semelhante.
Evite Superlotação
Quando uma derivação contém várias etapas, revele-as em vários slides ou use a animação com cuidado. Um único slide preenchido com notação densa é difícil para o público acompanhar.
Verifique a Compatibilidade de Fontes
Use uma fonte matemática padrão, como Cambria Math, e teste a apresentação no computador usado para a reprodução. Fontes ausentes podem alterar o espaçamento ou a aparência da equação. Para reduzir problemas de compatibilidade, incorpore fontes suportadas através de Arquivo > Opções > Salvar > Incorporar fontes no arquivo, ou exporte a apresentação final para PDF.
Resumo: Qual método você deve escolher para inserir equações?
Para a maioria dos usuários, a ferramenta de Equação integrada do PowerPoint é a melhor escolha porque é simples e mantém as fórmulas editáveis. Use Tinta para Matemática para entrada manuscrita, imagem SVG ou PNG para equações criadas em outro lugar e C# com Free Spire.Presentation para geração repetida ou automatizada.
Perguntas Frequentes sobre como Inserir Equações no PowerPoint
Qual é a maneira mais rápida de inserir uma equação no PowerPoint?
No Windows, pressione Alt + = para inserir uma nova caixa de equação e, em seguida, digite ou cole a fórmula. Você também pode selecionar Inserir > Equação e escolher uma fórmula integrada.
O PowerPoint pode converter código LaTeX em uma equação?
Sim. Os aplicativos do Microsoft 365, incluindo o PowerPoint, podem converter notação LaTeX suportada em conteúdo de Matemática do Office quando a expressão é inserida em uma zona matemática. No entanto, o PowerPoint pode não suportar todos os comandos ou pacotes disponíveis em uma instalação completa do LaTeX.
As equações podem ser editadas após serem inseridas?
As equações criadas com a ferramenta de Equação do PowerPoint ou convertidas através da Tinta para Matemática permanecem editáveis. Equações geradas como conteúdo matemático do PowerPoint com C# também podem ser editadas. Uma equação inserida como imagem SVG ou PNG não pode ser editada como conteúdo matemático.
Por que uma equação LaTeX parece diferente no PowerPoint?
O PowerPoint suporta um subconjunto definido de LaTeX em vez de um sistema de composição LaTeX completo. Comandos não suportados ou recursos específicos de pacotes podem aparecer como texto literal ou ser renderizados de forma diferente. Simplifique a expressão ou insira-a como uma imagem SVG quando for necessária uma formatação exata.
Posso copiar uma equação do Word para o PowerPoint?
Sim. As equações criadas com o editor de equações do Microsoft Office geralmente podem ser copiadas do Word e coladas no PowerPoint, permanecendo editáveis. Após colar, verifique o tamanho, o alinhamento e o espaçamento entre linhas no slide.
Posso inserir equações em vários arquivos do PowerPoint automaticamente?
Sim. Você pode usar C# com bibliotecas como o Free Spire.Presentation para inserir equações em lote em várias apresentações do PowerPoint.
PowerPoint에서 수식을 삽입하는 방법: 4가지 실용적인 방법
수학 수식은 과학, 공학, 금융, 통계 및 교육 관련 프레젠테이션에서 흔히 사용됩니다. E = mc²와 같은 간단한 공식은 입력하기 쉽지만, 분수, 행렬, 적분 및 여러 단계의 위첨자가 포함된 식은 일반 텍스트 상자에서 서식을 지정하기가 매우 어렵습니다.
이 가이드에서는 PowerPoint에 수식을 삽입하는 네 가지 실용적인 방법을 다룹니다:
빠른 비교
PowerPoint에 수식을 삽입하는 가장 좋은 방법은 수식의 수정 가능 여부, 생성 방식, 그리고 단일 슬라이드 작업인지 아니면 여러 프레젠테이션을 자동으로 생성하는지에 따라 달라집니다.
| 방법 | 최적 용도 | 수식으로 편집 가능 여부 | 주요 제한 사항 |
|---|---|---|---|
| PowerPoint 수식 도구 | 수동으로 몇 개의 편집 가능한 수식 생성 | 예 | 복잡한 공식은 작성 시간이 오래 걸림 |
| 잉크 수식(Ink to Math) | 스타일러스 및 터치스크린 사용자 | 예 (변환 후) | 필기 인식 수정이 필요할 수 있음 |
| 이미지로 삽입 | 다른 곳에서 생성된 수식 보존 | 아니요 | 공식이 변경되면 이미지를 다시 생성해야 함 |
| C# 및 Free Spire.Presentation | 일괄 생성 및 자동화된 보고서 | 예 | 기본적인 C# 지식 필요 |
방법 1: PowerPoint 수식 도구를 사용하여 수식 삽입하기
대부분의 사용자에게는 PowerPoint의 내장 수식 편집기가 가장 좋은 시작점입니다. 이 도구는 프레젠테이션 내에서 직접 크기 조정, 위치 변경 및 편집이 가능한 기본 수식 개체를 생성합니다.
내장 수식 삽입하기
PowerPoint에는 직접 삽입할 수 있는 여러 일반적인 수식(이차 방정식이나 피타고라스 정리 등)이 포함되어 있습니다.
-
PowerPoint 프레젠테이션을 열고 원하는 슬라이드를 선택합니다.
-
상단 리본 메뉴에서 삽입 탭으로 이동합니다.
-
기호 그룹에서 수식 옆의 드롭다운 화살표를 클릭합니다.
-
갤러리에서 내장 수식 중 하나를 선택합니다.
-
슬라이드의 수식 상자 안을 클릭하여 값, 기호 또는 구조를 편집합니다.
처음부터 새 수식 만들기
사용자 지정 수식을 만들려면:
-
삽입 > 수식 > 새 수식 삽입으로 이동하거나(Windows에서는 Alt + = 누름) 새 수식 상자를 삽입합니다.
-
리본 메뉴가 자동으로 수식 탭으로 전환됩니다.
-
구조 그룹에서 필요한 범주(분수, 첨자, 근호, 적분, 행렬 등)를 클릭하여 표준 빈 템플릿을 삽입합니다.
-
공식 내부의 점선 사각형 자리 표시자를 클릭하고 변수나 숫자를 입력합니다.
선형 형식으로 수식 입력하기
고급 사용자의 경우, 리본 아이콘을 클릭하는 것보다 선형 구문으로 공식을 입력하는 것이 훨씬 빠릅니다.
Microsoft 365의 PowerPoint는 지원되는 LaTeX 및 UnicodeMath 표기법을 전문적으로 서식 지정된 수식으로 변환하는 기능을 지원합니다. 사용 가능한 명령 및 변환 옵션은 버전에 따라 다를 수 있습니다.
-
빈 수식 상자를 삽입합니다(Windows에서는 Alt + =).
-
상자 안에 선형 구문을 사용하여 식을 입력합니다. 예시:
- UnicodeMath:
(a+b)/(c+d),x^2, 또는y_1 - LaTeX:
\int_0^\infty e^{-x} dx
- UnicodeMath:
-
수식 상자 안에서 마우스 오른쪽 버튼을 클릭하고 수학 옵션에 마우스를 올린 다음 전문가용을 선택하거나(또는 수식 리본에서 변환 > 전문가용 클릭) 선형 공식을 표준 시각적 수학 표기법으로 렌더링합니다.
수식이 변환되지 않는 경우 대처 방법
PowerPoint가 표기법을 일반 텍스트로 남겨두는 경우:
- 텍스트가 일반 텍스트 상자가 아닌 수식 상자 안에 있는지 확인합니다.
- 변환 명령을 선택하기 전에 전체 식을 선택합니다.
- 지원되지 않는 명령이나 패키지별 기능을 단순화합니다.
- 괄호 누락, 일치하지 않는 구분 기호 또는 대소문자 구분 명령을 확인합니다.
- 예상되는 변환 옵션을 사용할 수 없는 경우 PowerPoint를 업데이트합니다.
PowerPoint가 여전히 올바르게 변환할 수 없는 수식의 경우, 이미지로 삽입(방법 3)하거나 프로그래밍 방식으로 생성(방법 4)하는 것을 고려하십시오.
방법 2: 잉크 수식(Ink to Math)으로 손글씨 수식 작성하기
태블릿, Microsoft Surface 또는 터치스크린 노트북을 사용하는 경우, 수식을 타이핑하는 것이 제한적으로 느껴질 수 있습니다. PowerPoint의 잉크 수식 기능을 사용하면 자연스럽게 공식을 그리고 이를 편집 가능한 디지털 수학 텍스트로 변환할 수 있습니다.
손글씨 수식 삽입하기
-
그리기 탭으로 이동하여 잉크 수식 버튼을 클릭하여 수학 입력 패널을 엽니다.
-
스타일러스, 손가락 또는 마우스를 사용하여 그리드 영역에 공식을 작성합니다.
-
패널 상단에서 실시간 디지털 변환 결과를 미리 봅니다.
-
문자가 잘못 읽힌 경우 하단 메뉴에서 선택 및 수정 도구를 사용하고, 잘못된 기호를 클릭한 다음 팝업 제안에서 올바른 기호를 선택합니다.
-
삽입을 클릭하여 슬라이드에 수식을 넣습니다.
참고: 사용 가능한 잉크 수식 옵션은 PowerPoint 버전에 따라 다를 수 있습니다. Windows용 Microsoft 365에서는 슬라이드에 직접 수식을 작성하고 올가미 선택으로 잉크를 선택한 다음 그리기 > 잉크 수식을 선택할 수도 있습니다. 이 직접 변환 기능은 Microsoft 365 연결된 환경이 활성화되어 있어야 합니다. 자세한 내용은 Microsoft 지원 문서를 참조하십시오.
방법 3: 이미지로 수식 삽입하기
LaTeX 편집기, 과학 애플리케이션 또는 온라인 수식 렌더러에서 이미 생성된 수식은 SVG 또는 PNG 이미지로 내보내 PowerPoint에 삽입할 수 있습니다.
이는 수식이 이미 완성되어 있고 나중에 편집할 필요가 없을 때 가장 간단한 해결책입니다.
SVG 또는 PNG: 어떤 형식을 선택할 것인가
- 가능하면 SVG를 사용하십시오. 벡터 형식이므로 크기를 조정해도 수식이 선명하게 유지됩니다.
- SVG를 사용할 수 없는 경우 PNG를 사용하십시오. 충분히 높은 해상도로 내보내고 가능하면 투명 배경을 사용하십시오.
수식 이미지 삽입하기
-
수식 편집기나 렌더러에서 수식을 SVG 또는 PNG 파일로 내보냅니다.
-
대상 슬라이드를 엽니다.
-
삽입 > 그림 > 이 디바이스를 선택합니다.
-
수식 이미지 파일을 선택합니다.
-
가로세로 비율을 유지하면서 크기를 조정하고 위치를 잡습니다.
중요한 제한 사항
이미지로 삽입된 수식은 수학적 콘텐츠로 편집할 수 없습니다. 공식이 변경될 경우를 대비하여 원본 소스 파일을 보관하십시오.
접근성을 위해 단순히 이미지라고 표시하는 대신 공식을 설명하는 대체 텍스트를 추가하십시오. 예시:
이차 방정식: x는 마이너스 b 플러스 마이너스 제곱근, b 제곱 마이너스 4ac, 나누기 2a.
이 방법을 사용하는 경우
- 수식이 다른 애플리케이션에서 생성된 경우.
- 편집 가능성보다 정확한 시각적 모양이 더 중요한 경우.
- PowerPoint가 복잡한 공식을 올바르게 렌더링하지 못하는 경우.
- 수식이 최종본이며 변경될 가능성이 없는 경우.
방법 4: C#을 사용하여 프로그래밍 방식으로 수식 삽입하기
수동 수식 입력은 몇 개의 슬라이드에는 적합합니다. 하지만 보고서 템플릿, 교육 자료, 금융 프레젠테이션 또는 문제 은행에 수식을 반복적으로 추가해야 할 때는 비효율적입니다.
이러한 경우 .NET 라이브러리를 사용하면 PowerPoint를 수동으로 열지 않고도 LaTeX 코드에서 PowerPoint 수학 콘텐츠를 생성할 수 있습니다. 다음 예제는 Free Spire.Presentation을 사용합니다. 이 라이브러리는 Microsoft PowerPoint를 설치하지 않고도 PowerPoint 파일을 생성 및 수정할 수 있습니다.
- *참고: 무료 버전은 소규모 작업용으로 설계되었으며 파일당 최대 10개의 슬라이드 처리를 허용합니다. 프레젠테이션이 이 제한을 초과하는 경우 전체 버전으로 전환하고 무료 평가판 라이선스를 신청하여 제한 없이 테스트할 수 있습니다.
1단계: 필요한 패키지 설치하기
NuGet 패키지 관리자 콘솔을 통해 Free Spire.Presentation을 설치합니다:
Install-Package FreeSpire.Presentation
또는 .NET CLI를 사용합니다:
dotnet add package FreeSpire.Presentation
2단계: C# 코드 작성하기
다음 코드는 프레젠테이션을 만들고, 첫 번째 슬라이드에 도형을 추가하며, LaTeX 코드에서 수식을 생성하고, 결과를 PPTX 파일로 저장합니다:
using Spire.Presentation;
using Spire.Presentation.Drawing;
using System;
using System.Drawing;
using System.IO;

namespace EquationDemo
{
    internal class Program
    {
        static void Main(string[] args)
        {
            string outputFolder = "generated-slides";
            string outputFile = Path.Combine(outputFolder, "QuadraticFormula.pptx");
            Directory.CreateDirectory(outputFolder);

            using (Presentation deck = new Presentation())
            {
                try
                {
                    ISlide firstSlide = deck.Slides[0];

                    // 투명한 사각형이 수식 텍스트의 컨테이너 역할을 합니다
                    IAutoShape equationBox = firstSlide.Shapes.AppendShape(
                        ShapeType.Rectangle,
                        new RectangleF(60, 120, 560, 90)
                    );
                    equationBox.Fill.FillType = FillFormatType.None;
                    equationBox.Line.FillType = FillFormatType.None;
                    equationBox.TextFrame.Paragraphs.Clear();

                    // LaTeX로 작성된 이차 방정식
                    string quadraticFormula = @"x=\frac{-b\pm\sqrt{b^{2}-4ac}}{2a}";
                    equationBox.TextFrame.Paragraphs.AddParagraphFromLatexMathCode(quadraticFormula);

                    deck.SaveToFile(outputFile, FileFormat.Pptx2019);
                    Console.WriteLine($"저장됨: {outputFile}");
                }
                catch (Exception ex)
                {
                    Console.WriteLine($"슬라이드를 생성할 수 없음: {ex.Message}");
                }
            }
        }
    }
}
결과:
개발자를 위한 참고 사항:
- 기존 프레젠테이션 처리: 이 예제는 새 프레젠테이션을 만듭니다. 기존 파일에 수식을 삽입하려면 먼저 deck.LoadFromFile("your_file_path.pptx")로 로드한 다음 위와 동일한 도형/수식 메서드를 사용하십시오.
- 일괄 생성: 수식 삽입 로직을 루프(예: CSV 또는 데이터베이스에서 LaTeX 문자열 읽기)로 감싸서 많은 슬라이드나 파일을 자동으로 처리하십시오.
- 흔하지 않은 수식 먼저 테스트: 일반적이지 않은 명령과 복잡한 행렬은 프로덕션 워크플로에서 사용하기 전에 테스트해야 합니다.
- 무료 버전 제한: Free Spire.Presentation은 프레젠테이션당 최대 10개의 슬라이드를 지원합니다. 소스 프레젠테이션이 이 제한을 초과하는 경우, PowerPoint나 다른 제한 없는 도구를 사용하여 미리 분할하거나 상용 버전을 사용하십시오.
PowerPoint에서 명확한 수식을 만들기 위한 팁
읽기 쉬운 크기 사용
노트북에서는 괜찮아 보이는 수식이 프로젝터에서는 읽기 어려울 수 있습니다. 프레젠테이션 모드에서 슬라이드를 미리 보고 적절한 시청 거리에서 확인하십시오.
서식 일관성 유지
프레젠테이션 전체에서 일관된 수식 크기, 정렬 및 간격을 사용하십시오. 시각적 모양이 비슷하지 않은 한 스크린샷, 기본 수식 및 추가 기능 수식을 혼합하지 마십시오.
과도한 정보 피하기
유도 과정에 여러 단계가 포함된 경우, 여러 슬라이드에 나누어 표시하거나 애니메이션을 신중하게 사용하십시오. 밀도 높은 표기로 가득 찬 단일 슬라이드는 청중이 따라가기 어렵습니다.
글꼴 호환성 확인
Cambria Math와 같은 표준 수학 글꼴을 사용하고 재생에 사용되는 컴퓨터에서 프레젠테이션을 테스트하십시오. 글꼴이 없으면 수식 간격이나 모양이 변경될 수 있습니다. 호환성 문제를 줄이려면 파일 > 옵션 > 저장 > 파일에 글꼴 포함을 통해 지원되는 글꼴을 포함하거나, 최종 프레젠테이션을 PDF로 내보내십시오.
요약: 수식 삽입을 위해 어떤 방법을 선택해야 할까요?
대부분의 사용자에게는 PowerPoint의 내장 수식 도구가 간단하고 수식을 편집 가능한 상태로 유지하므로 가장 좋은 선택입니다. 손글씨 입력에는 잉크 수식을, 다른 곳에서 생성된 수식에는 SVG 또는 PNG 이미지를, 반복적이거나 자동화된 생성에는 C#과 Free Spire.Presentation을 사용하십시오.
PowerPoint에 수식 삽입에 관한 자주 묻는 질문
PowerPoint에서 수식을 삽입하는 가장 빠른 방법은 무엇인가요?
Windows에서는 Alt + =를 눌러 새 수식 상자를 삽입한 다음 공식을 입력하거나 붙여넣으십시오. 삽입 > 수식을 선택하고 내장 공식을 선택할 수도 있습니다.
PowerPoint가 LaTeX 코드를 수식으로 변환할 수 있나요?
네. PowerPoint를 포함한 Microsoft 365 애플리케이션은 수학 영역에 식이 입력될 때 지원되는 LaTeX 표기법을 Office 수학 콘텐츠로 변환할 수 있습니다. 그러나 PowerPoint가 전체 LaTeX 설치에서 사용할 수 있는 모든 명령이나 패키지를 지원하지는 않을 수 있습니다.
수식을 삽입한 후에도 편집할 수 있나요?
PowerPoint의 수식 도구로 생성하거나 잉크 수식을 통해 변환된 수식은 계속 편집할 수 있습니다. C#으로 PowerPoint 수학 콘텐츠로 생성된 수식도 편집할 수 있습니다. SVG 또는 PNG 이미지로 삽입된 수식은 수학적 콘텐츠로 편집할 수 없습니다.
LaTeX 수식이 PowerPoint에서 다르게 보이는 이유는 무엇인가요?
PowerPoint는 완전한 LaTeX 조판 시스템이 아닌 정의된 LaTeX 하위 집합을 지원합니다. 지원되지 않는 명령이나 패키지별 기능은 리터럴 텍스트로 나타나거나 다르게 렌더링될 수 있습니다. 정확한 서식이 필요한 경우 식을 단순화하거나 SVG 이미지로 삽입하십시오.
Word에서 PowerPoint로 수식을 복사할 수 있나요?
네. Microsoft Office의 수식 편집기로 생성된 수식은 일반적으로 Word에서 복사하여 PowerPoint에 붙여넣을 수 있으며 편집 가능한 상태로 유지됩니다. 붙여넣은 후 슬라이드의 크기, 정렬 및 줄 간격을 확인하십시오.
여러 PowerPoint 파일에 자동으로 수식을 삽입할 수 있나요?
네. Free Spire.Presentation과 같은 라이브러리와 C#을 사용하여 여러 PowerPoint 프레젠테이션에 수식을 일괄 삽입할 수 있습니다.
Come inserire equazioni in PowerPoint: 4 metodi pratici
Le equazioni matematiche sono comuni nelle presentazioni riguardanti scienza, ingegneria, finanza, statistica e istruzione. Una formula semplice come E = mc² può essere facile da digitare, ma frazioni, matrici, integrali ed espressioni con diversi livelli di apici possono diventare rapidamente difficili da formattare in una normale casella di testo.
Questa guida illustra quattro modi pratici per inserire equazioni in PowerPoint:
- Utilizzare lo strumento Equazione integrato di PowerPoint
- Convertire formule scritte a mano con "Input penna matematico"
- Inserire un'equazione come immagine
- Inserire equazioni a livello di programmazione con C#
Confronto rapido
Il modo migliore per inserire un'equazione in PowerPoint dipende dal fatto che debba rimanere modificabile, da come è stata creata e se si sta lavorando su una singola diapositiva o generando molte presentazioni automaticamente.
| Metodo | Ideale per | Modificabile come equazione? | Limitazione principale |
|---|---|---|---|
| Strumento Equazione di PowerPoint | Creare manualmente alcune equazioni modificabili | Sì | Le formule complesse richiedono più tempo per essere costruite |
| Input penna matematico | Utenti con stilo e touchscreen | Sì, dopo la conversione | Il riconoscimento della grafia potrebbe richiedere correzioni |
| Inserire come immagine | Preservare un'equazione creata altrove | No | L'immagine deve essere ricreata se la formula cambia |
| C# con Free Spire.Presentation | Generazione batch e reportistica automatizzata | Sì | Richiede conoscenze base di C# |
Metodo 1: Inserire un'equazione utilizzando lo strumento Equazione di PowerPoint
Per la maggior parte degli utenti, l'editor di equazioni integrato di PowerPoint è il punto di partenza migliore. Crea oggetti equazione nativi che possono essere ridimensionati, riposizionati e modificati direttamente nella presentazione.
Inserire un'equazione predefinita
PowerPoint include diverse equazioni comuni (come la formula quadratica o il teorema di Pitagora) che possono essere inserite direttamente.
-
Apri la tua presentazione PowerPoint e seleziona la diapositiva desiderata.
-
Vai alla scheda Inserisci sulla barra multifunzione in alto.
-
Nel gruppo Simboli, fai clic sulla freccia a discesa accanto a Equazione.
-
Seleziona una delle equazioni integrate dalla galleria.
-
Fai clic all'interno della casella dell'equazione sulla diapositiva per modificarne valori, simboli o struttura.
Creare una nuova equazione da zero
Per costruire un'equazione personalizzata:
-
Vai su Inserisci > Equazione > Inserisci nuova equazione (o premi Alt + = su Windows) per inserire una nuova casella di equazione.
-
La barra multifunzione passerà automaticamente alla scheda Equazione.
-
Fai clic sulla categoria necessaria (come Frazione, Apice, Radicale, Integrale o Matrice) nel gruppo Strutture per inserire modelli vuoti standard.
-
Fai clic nei segnaposto quadrati tratteggiati all'interno della formula e digita le tue variabili o numeri.
Digitare un'equazione in formato lineare
Per gli utenti esperti, inserire formule in sintassi lineare è molto più veloce rispetto al cliccare sulle icone della barra multifunzione.
PowerPoint in Microsoft 365 supporta la conversione della notazione LaTeX e UnicodeMath supportata in equazioni formattate professionalmente. I comandi disponibili e le opzioni di conversione possono variare in base alla versione.
-
Inserisci una casella di equazione vuota (Alt + = su Windows).
-
Digita la tua espressione all'interno della casella utilizzando la sintassi lineare. Esempi:
- UnicodeMath:
(a+b)/(c+d),x^2, oy_1 - LaTeX:
\int_0^\infty e^{-x} dx
- UnicodeMath:
-
Fai clic con il tasto destro all'interno della casella dell'equazione, passa il mouse su Opzioni matematiche e seleziona Professionale (o fai clic su Conversioni > Professionale sulla barra multifunzione Equazione) per trasformare la formula lineare nella notazione matematica visiva standard.
Cosa fare se l'equazione non viene convertita
Se PowerPoint lascia la notazione come testo semplice:
- Verifica che il testo sia all'interno di una casella di equazione e non di una normale casella di testo.
- Seleziona l'intera espressione prima di scegliere il comando di conversione.
- Semplifica i comandi non supportati o le funzionalità specifiche del pacchetto.
- Controlla se mancano parentesi graffe, delimitatori non corrispondenti o comandi sensibili alle maiuscole/minuscole.
- Aggiorna PowerPoint se le opzioni di conversione previste non sono disponibili.
Per un'equazione che PowerPoint non riesce ancora a convertire correttamente, prendi in considerazione l'inserimento come immagine (metodo 3) o la generazione a livello di programmazione (metodo 4).
Metodo 2: Scrivere un'equazione a mano con "Input penna matematico"
Se utilizzi un tablet, un Microsoft Surface o un laptop touchscreen, digitare equazioni può sembrare limitante. La funzionalità "Input penna matematico" di PowerPoint ti consente di disegnare formule in modo naturale e le converte in testo matematico digitale modificabile.
Inserire un'equazione scritta a mano
-
Vai alla scheda Disegno e fai clic sul pulsante Input penna matematico per aprire il pannello di input matematico.
-
Usa lo stilo, il dito o il mouse per scrivere la tua formula nell'area della griglia.
-
Visualizza l'anteprima della conversione digitale in tempo reale nella parte superiore del pannello.
-
Se un carattere viene letto in modo errato, usa lo strumento Seleziona e correggi dal menu in basso, fai clic sul simbolo errato e scegli quello corretto dai suggerimenti a comparsa.
-
Fai clic su Inserisci per inserire l'equazione nella tua diapositiva.
Nota: Le opzioni disponibili per l'Input penna matematico possono variare in base alla versione di PowerPoint. In Microsoft 365 per Windows, puoi anche scrivere un'equazione direttamente sulla diapositiva, selezionare l'input penna con Selezione lazo e scegliere Disegno > Input penna matematico. Questa funzione di conversione diretta richiede che le esperienze connesse di Microsoft 365 siano abilitate. Per ulteriori dettagli, consulta la documentazione di supporto Microsoft.
Metodo 3: Inserire un'equazione come immagine
Se un'equazione è già stata creata in un editor LaTeX, un'applicazione scientifica o un renderizzatore di equazioni online, può essere esportata come immagine SVG o PNG e inserita in PowerPoint.
Questa è spesso la soluzione più semplice quando l'equazione è già definitiva e non deve essere modificata in seguito.
SVG o PNG: quale formato scegliere
- Usa SVG quando possibile. È un formato vettoriale, quindi l'equazione rimane nitida quando viene ridimensionata.
- Usa PNG quando SVG non è disponibile. Esportalo a una risoluzione sufficientemente alta e usa uno sfondo trasparente quando possibile.
Inserire l'immagine dell'equazione
-
Esporta l'equazione come file SVG o PNG da un editor o renderizzatore di equazioni.
-
Apri la diapositiva di destinazione.
-
Seleziona Inserisci > Immagini > Questo dispositivo.
-
Scegli il file immagine dell'equazione.
-
Ridimensiona e posiziona senza modificarne le proporzioni.
Limitazione importante
Un'equazione inserita come immagine non può essere modificata come contenuto matematico. Conserva il file sorgente originale in modo che la formula possa essere rigenerata se cambia.
Per l'accessibilità, aggiungi un testo alternativo che descriva la formula invece di etichettarla semplicemente come immagine. Ad esempio:
Formula quadratica: x uguale a meno b più o meno la radice quadrata di b al quadrato meno quattro a c, diviso due a.
Usa questo metodo quando
- L'equazione è stata creata in un'altra applicazione.
- L'aspetto visivo esatto conta più della modificabilità.
- PowerPoint non renderizza correttamente una formula complessa.
- L'equazione è definitiva e difficilmente cambierà.
Metodo 4: Inserire equazioni a livello di programmazione in C#
L'inserimento manuale delle equazioni è adatto per poche diapositive. Diventa inefficiente quando le equazioni devono essere aggiunte ripetutamente a modelli di report, materiali didattici, presentazioni finanziarie o banche dati di domande.
In questi casi, una libreria .NET può generare contenuti matematici per PowerPoint dal codice LaTeX senza aprire PowerPoint manualmente. L'esempio seguente utilizza Free Spire.Presentation. La libreria può creare e modificare file PowerPoint senza richiedere l'installazione di Microsoft PowerPoint.
- *Nota: L'edizione gratuita è progettata per attività su piccola scala e consente di elaborare fino a 10 diapositive per file. Se la tua presentazione supera questo limite, puoi passare all' edizione completa e richiedere una licenza di prova gratuita per un test senza restrizioni.
Passaggio 1: Installare il pacchetto richiesto
Installa Free Spire.Presentation tramite la Console di Gestione pacchetti NuGet:
Install-Package FreeSpire.Presentation
In alternativa, usa la CLI .NET:
dotnet add package FreeSpire.Presentation
Passaggio 2: Scrivere il codice C#
Il codice seguente crea una presentazione, aggiunge una forma alla prima diapositiva, genera un'equazione dal codice LaTeX e salva il risultato come file PPTX:
using Spire.Presentation;
using Spire.Presentation.Drawing;
using System;
using System.Drawing;
using System.IO;

namespace EquationDemo
{
    internal class Program
    {
        static void Main(string[] args)
        {
            string outputFolder = "generated-slides";
            string outputFile = Path.Combine(outputFolder, "QuadraticFormula.pptx");
            Directory.CreateDirectory(outputFolder);

            using (Presentation deck = new Presentation())
            {
                try
                {
                    ISlide firstSlide = deck.Slides[0];

                    // Un rettangolo trasparente funge da contenitore per il testo dell'equazione
                    IAutoShape equationBox = firstSlide.Shapes.AppendShape(
                        ShapeType.Rectangle,
                        new RectangleF(60, 120, 560, 90)
                    );
                    equationBox.Fill.FillType = FillFormatType.None;
                    equationBox.Line.FillType = FillFormatType.None;
                    equationBox.TextFrame.Paragraphs.Clear();

                    // Formula quadratica, scritta in LaTeX
                    string quadraticFormula = @"x=\frac{-b\pm\sqrt{b^{2}-4ac}}{2a}";
                    equationBox.TextFrame.Paragraphs.AddParagraphFromLatexMathCode(quadraticFormula);

                    deck.SaveToFile(outputFile, FileFormat.Pptx2019);
                    Console.WriteLine($"Salvato: {outputFile}");
                }
                catch (Exception ex)
                {
                    Console.WriteLine($"Impossibile generare la diapositiva: {ex.Message}");
                }
            }
        }
    }
}
Risultato:
Note per gli sviluppatori:
- Elaborazione di presentazioni esistenti: Questo esempio crea una nuova presentazione. Per inserire equazioni in un file esistente, caricalo prima con deck.LoadFromFile("percorso_del_tuo_file.pptx"), quindi utilizza gli stessi metodi di forma/equazione mostrati sopra.
- Generazione batch: Inserisci la logica di inserimento dell'equazione in un ciclo (ad esempio leggendo stringhe LaTeX da un CSV o database) per elaborare molte diapositive o file automaticamente.
- Testa prima le equazioni non comuni: I comandi meno comuni e le matrici complesse dovrebbero essere testati prima di essere utilizzati in un flusso di lavoro di produzione.
- Limiti dell'edizione gratuita: Free Spire.Presentation supporta fino a 10 diapositive per presentazione. Se la presentazione di origine supera questo limite, suddividila in anticipo utilizzando PowerPoint o un altro strumento senza restrizioni, oppure utilizza l'edizione commerciale.
Suggerimenti per creare equazioni chiare in PowerPoint
Usa una dimensione leggibile
Un'equazione che sembra accettabile su un laptop potrebbe essere difficile da leggere su un proiettore. Visualizza in anteprima la diapositiva in modalità presentazione e controllala da una distanza di visione ragionevole.
Mantieni la formattazione coerente
Usa una dimensione, un allineamento e una spaziatura delle equazioni coerenti in tutta la presentazione. Evita di mescolare screenshot, equazioni native ed equazioni di componenti aggiuntivi a meno che il loro aspetto visivo non sia simile.
Evita il sovraffollamento
Quando una derivazione contiene diversi passaggi, rivelali su più diapositive o usa l'animazione con attenzione. Una singola diapositiva piena di notazioni dense è difficile da seguire per un pubblico.
Controlla la compatibilità dei caratteri
Usa un carattere matematico standard come Cambria Math e testa la presentazione sul computer utilizzato per la riproduzione. I caratteri mancanti potrebbero modificare la spaziatura o l'aspetto dell'equazione. Per ridurre i problemi di compatibilità, incorpora i caratteri supportati tramite File > Opzioni > Salva > Incorpora caratteri nel file, oppure esporta la presentazione finale in PDF.
Riepilogo: quale metodo dovresti scegliere per inserire le equazioni?
Per la maggior parte degli utenti, lo strumento Equazione integrato di PowerPoint è la scelta migliore perché è semplice e mantiene le formule modificabili. Usa l'Input penna matematico per l'input scritto a mano, l'immagine SVG o PNG per le equazioni create altrove e C# con Free Spire.Presentation per la generazione ripetuta o automatizzata.
Domande frequenti sull'inserimento di equazioni in PowerPoint
Qual è il modo più rapido per inserire un'equazione in PowerPoint?
Su Windows, premi Alt + = per inserire una nuova casella di equazione, quindi digita o incolla la formula. Puoi anche selezionare Inserisci > Equazione e scegliere una formula predefinita.
PowerPoint può convertire il codice LaTeX in un'equazione?
Sì. Le applicazioni Microsoft 365, incluso PowerPoint, possono convertire la notazione LaTeX supportata in contenuto Office Math quando l'espressione viene inserita in una zona matematica. Tuttavia, PowerPoint potrebbe non supportare ogni comando o pacchetto disponibile in un'installazione LaTeX completa.
Le equazioni possono essere modificate dopo essere state inserite?
Le equazioni create con lo strumento Equazione di PowerPoint o convertite tramite Input penna matematico rimangono modificabili. Anche le equazioni generate come contenuto matematico di PowerPoint con C# possono essere modificate. Un'equazione inserita come immagine SVG o PNG non può essere modificata come contenuto matematico.
Perché un'equazione LaTeX appare diversa in PowerPoint?
PowerPoint supporta un sottoinsieme definito di LaTeX piuttosto che un sistema di composizione LaTeX completo. I comandi non supportati o le funzionalità specifiche del pacchetto potrebbero apparire come testo letterale o essere renderizzati in modo diverso. Semplifica l'espressione o inseriscila come immagine SVG quando è richiesta una formattazione esatta.
Posso copiare un'equazione da Word a PowerPoint?
Sì. Le equazioni create con l'editor di equazioni di Microsoft Office possono solitamente essere copiate da Word e incollate in PowerPoint rimanendo modificabili. Dopo aver incollato, controlla la dimensione, l'allineamento e l'interlinea sulla diapositiva.
Posso inserire equazioni in più file PowerPoint automaticamente?
Sì. Puoi utilizzare C# con librerie come Free Spire.Presentation per inserire in batch equazioni in più presentazioni PowerPoint.